

Introduction
n8n is a workflow automation tool for connecting apps and services via nodes (send email, call APIs, process data). When AI models enter the loop, behavior becomes less predictable—making robust n8n monitoring essential.
In this guide, we’ll set up end‑to‑end n8n observability in minutes. We’ll instrument n8n with OpenTelemetry and Winston to capture structured logs, distributed traces, and metrics, then ship everything to Parseable over OTLP. From there, we can analyze with SQL, build dashboards, and set alerts for reliable, AI‑powered automation at scale.
What you’ll get:
- Structured, correlated logs from n8n using Winston + OpenTelemetry.
- Distributed traces for every workflow and node to pinpoint slow or failing steps.
- Metrics for durations, error rates, and token usage to track performance and cost.
- A single OTLP pipeline into Parseable for unified storage and analysis.
- Ready‑to‑use SQL queries, dashboards, and alerts for n8n monitoring.
The problem
AI Agents are great when they work, but a nightmare to debug. The in-deterministic nature of agentic workflows means that failures can happen at any point, often without clear explanations.
To be able to properly debug and analyse agents, we need at the least below data:
- A span that shows which node failed and how long it ran
- A log that captures the error message and context
- A metric that tells you if this is a one-off or a trend
Our approach
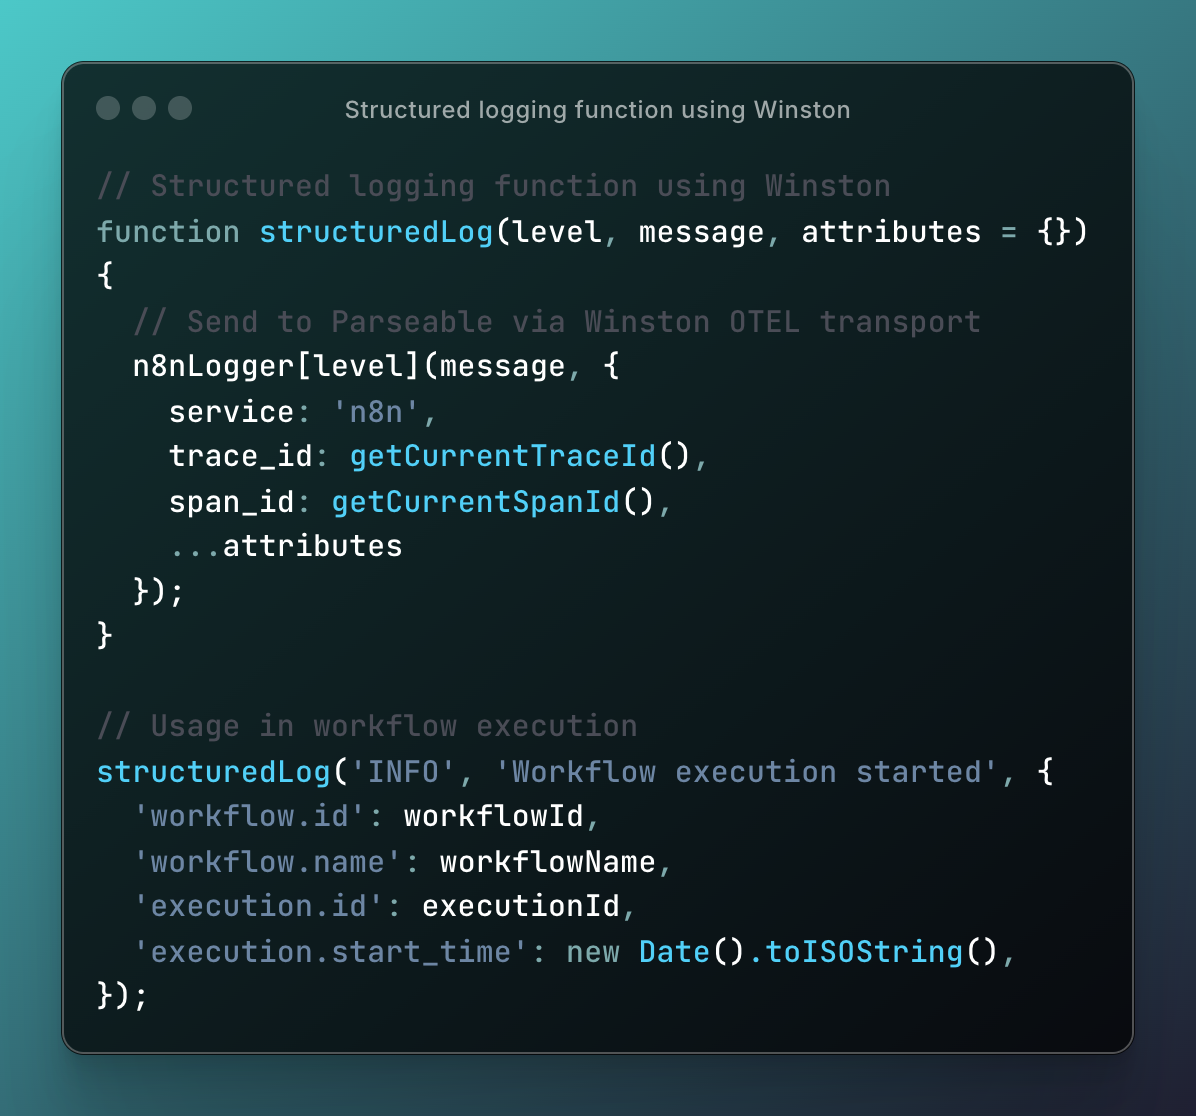
n8n uses the Winston logging library internally for all its logging operations. This makes it straightforward to integrate with OpenTelemetry's Winston instrumentation to capture structured logs with trace correlation automatically.
This allows us to create deep instrumentation using the Winston library and then ship the telemetry data to Parseable in the OTel format.
┌───────────┐     ┌───────────────────────┐     ┌──────────────────────┐
│    n8n    │ ───▶│ OpenTelemetry (OTLP)  │ ───▶│ Parseable (Datasets) │
│           │     │ - Traces              │     │ - otel-traces        │
│ Workflows │     │ - Metrics             │     │ - otel-metrics       │
│ Nodes     │     │ - Logs (Winston)      │     │ - otel-logs          │
└───────────┘     └───────────────────────┘     └──────────────────────┘
Instrumenting OTel for n8n
Agentic workflows are typically complex, because there is so much going on, and there is the added in-determinism of asynchronous execution. Let's understand the different layers of instrumentation.
First you have the application level components interacting with each other - this is very specific to the workflow and needs custom instrumentation. Then you have the token level instrumentation, which tracks the flow of data and decisions within the workflow. After that there are infrastructure components like databases, message queues, and external APIs. Finally the node level telemetry tells you how each individual node is performing.
All of this data is important for effectively observing the workflow. So, the key to comprehensive n8n observability is instrumenting at all these levels.
Winston serves as the unified logging bridge that captures all telemetry data. It is a great choice here because n8n already uses Winston for all logging. The @opentelemetry/instrumentation-winston module provides automatic instrumentation to inject trace-context into Winston log records (log correlation) and to send Winston logging to the OpenTelemetry Logging SDK (log sending).
Let's take a look at the different layers of instrumentation, and the relevant code snippets. If you'd like to jump to the code directly, here is the GitHub repo for the instrumentation: n8n-observability
Workflow instrumentation
This is where we intercept n8n's core workflow execution to add comprehensive observability:
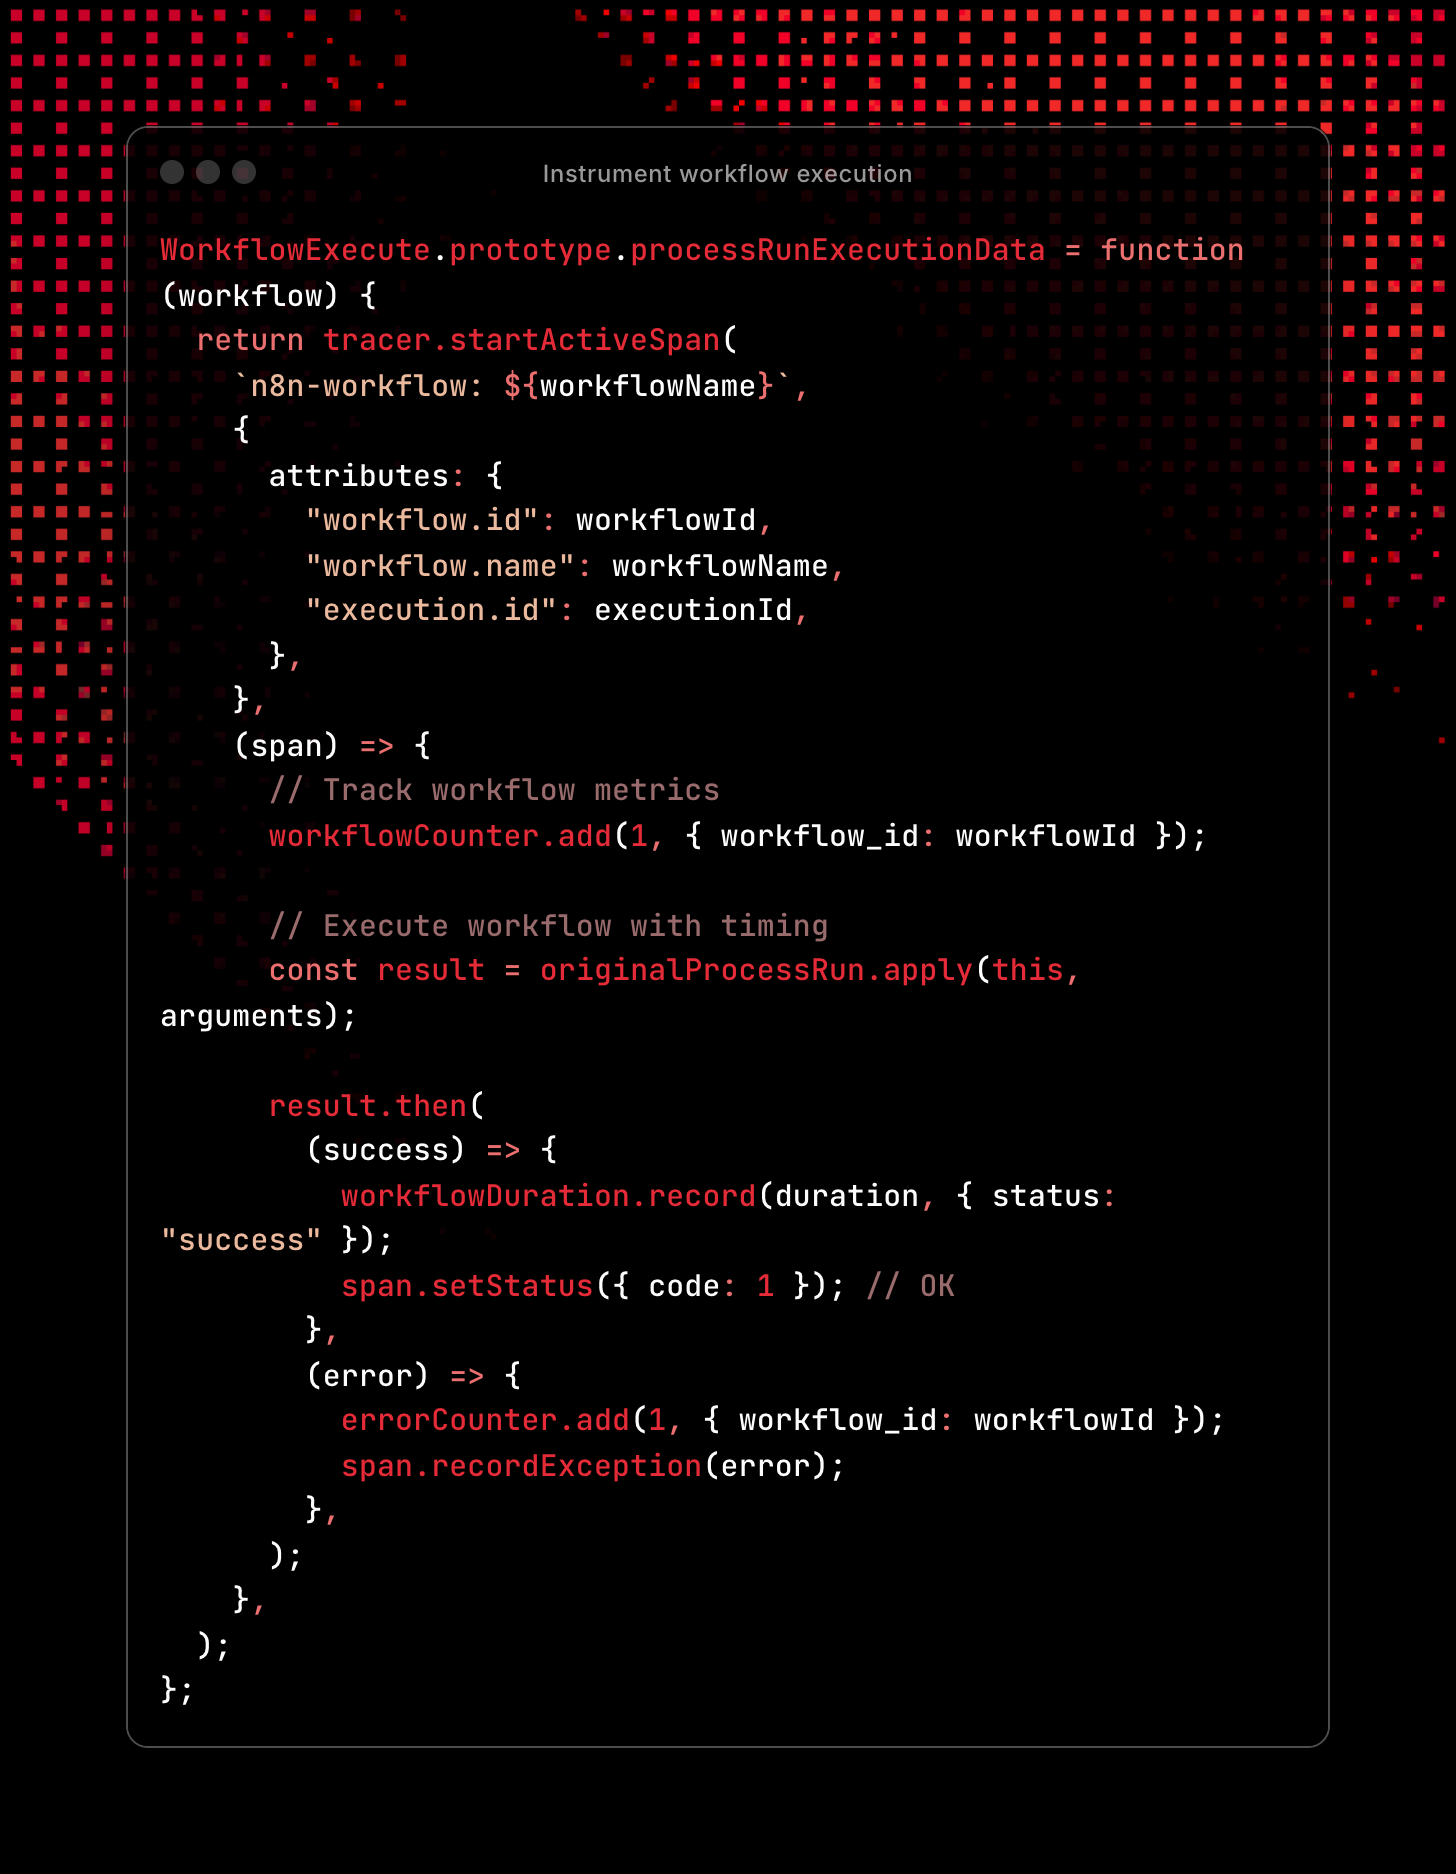
- Method Interception: We monkey-patch n8n's
processRunExecutionDatamethod without breaking existing functionality - Span Creation: Each workflow execution gets wrapped in a distributed trace span with structured metadata
- Immediate Metrics: Counter increments as soon as workflow starts, providing real-time throughput visibility
- Original Execution: The actual n8n workflow logic runs unchanged via
originalProcessRun.apply() - Promise Handling: We attach success/error handlers to capture outcomes and timing
- Structured Results:
- Success: Records duration histogram + sets span status to OK
- Error: Increments error counter + records exception in span for debugging
This gives you a complete trace for every workflow execution with timing, success/failure status, and correlation to all child node operations.
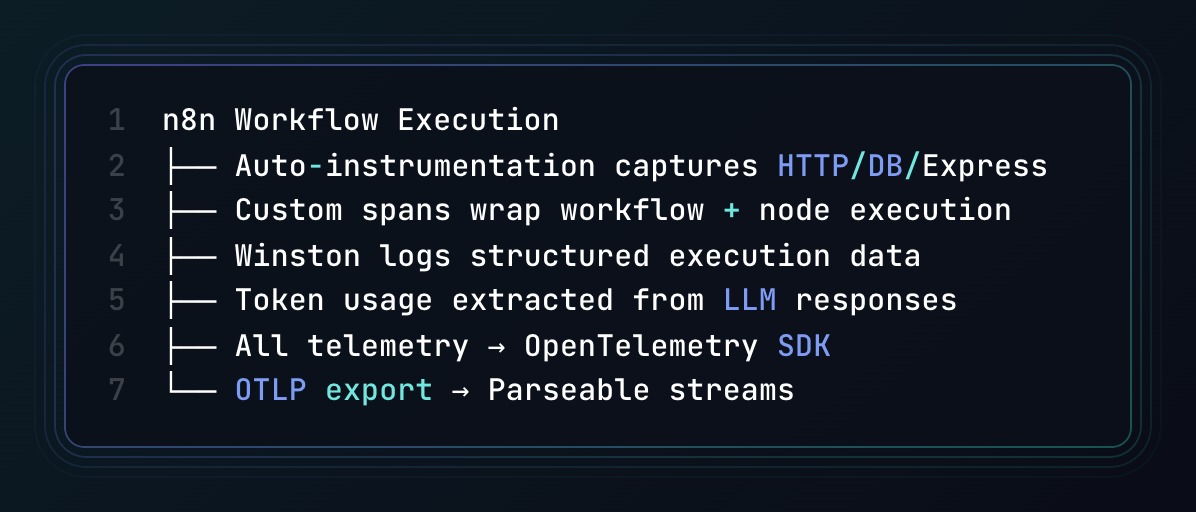
Instrumentation Overview for all kind of telemetry data
Here's how the telemetry data flows from n8n to Parseable:
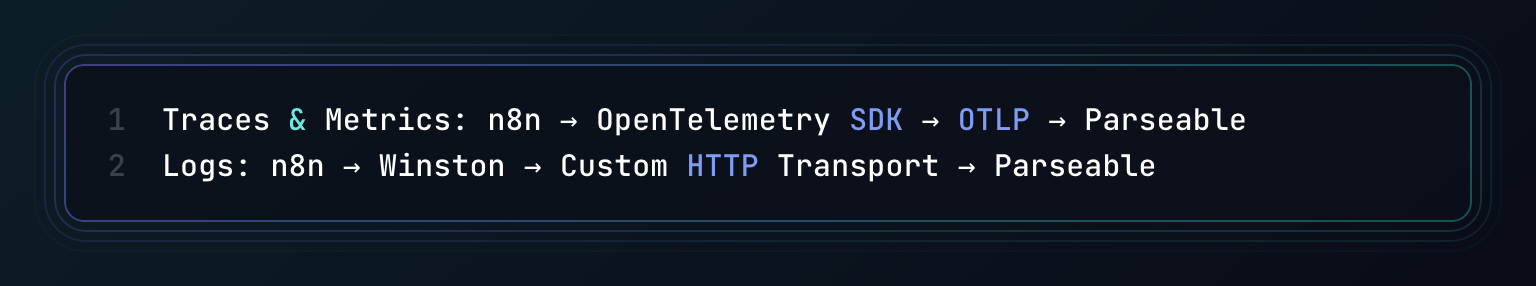
In this blog post we specifically focus on the Traces and Metrics data.
Infrastructure instrumentation
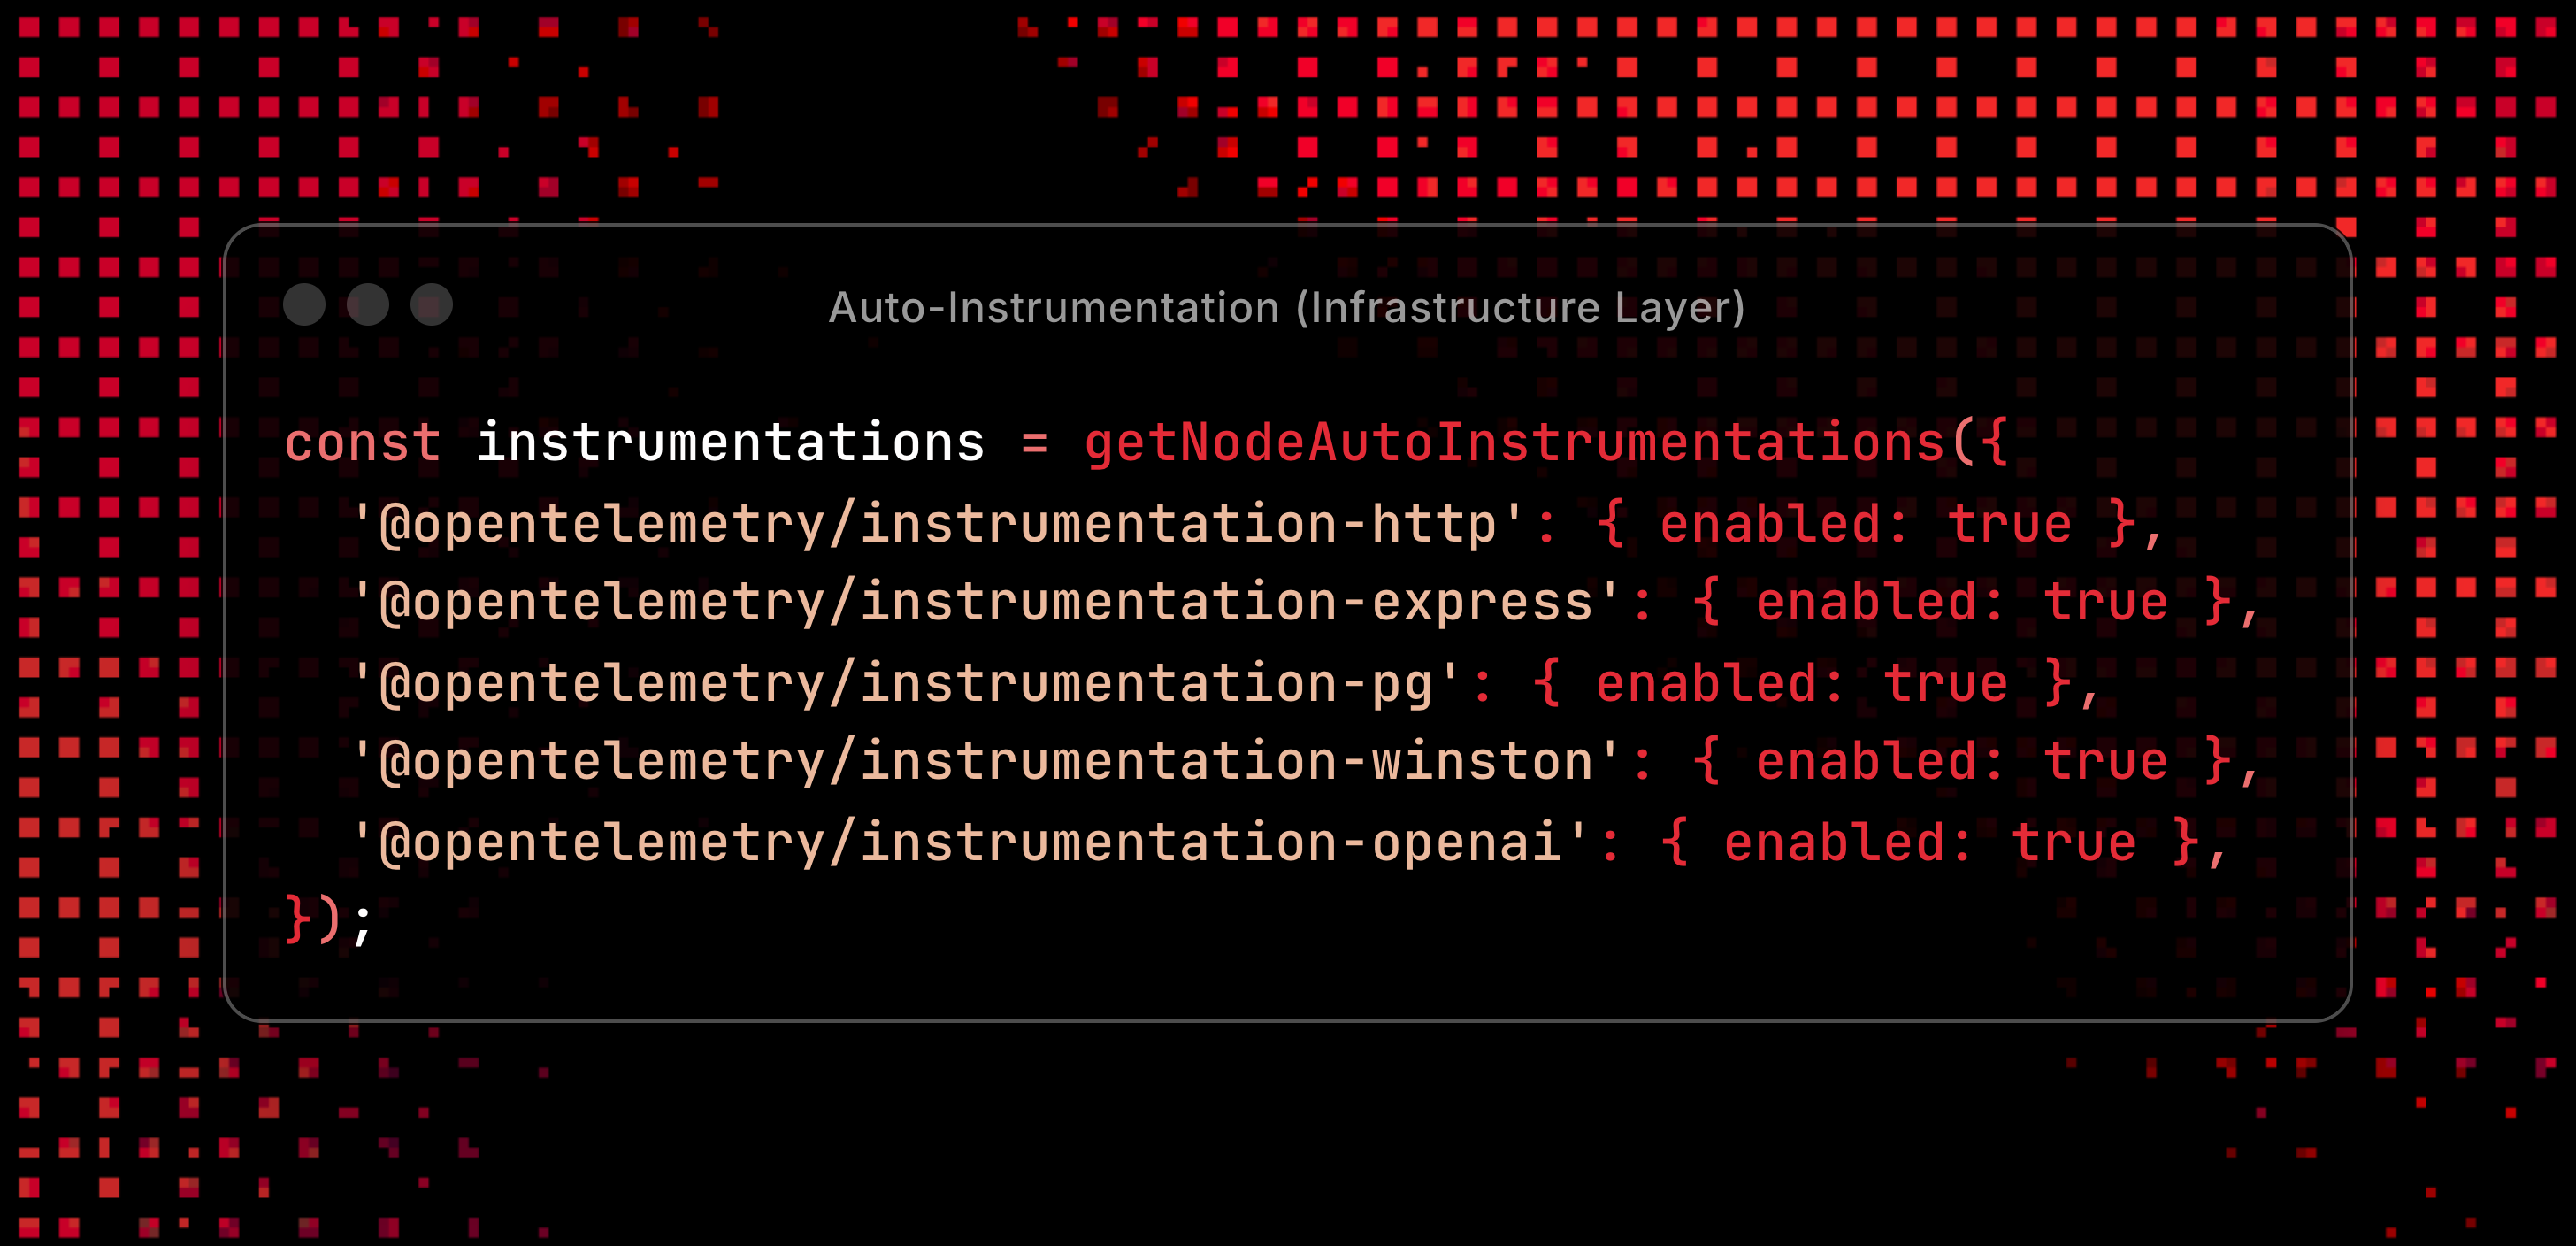
This captures:
- HTTP requests/responses (API calls, webhooks)
- Express middleware (routing, authentication)
- PostgreSQL queries (workflow storage, execution history)
- Winston logs (all application logging)
- OpenAI API calls (we specifically focus on OpenAI models since our agentic workflows primarily use OpenAI for LLM operations, and we need to track token usage for cost optimization)
Node instrumentation
This provides granular visibility into individual node performance and LLM usage:
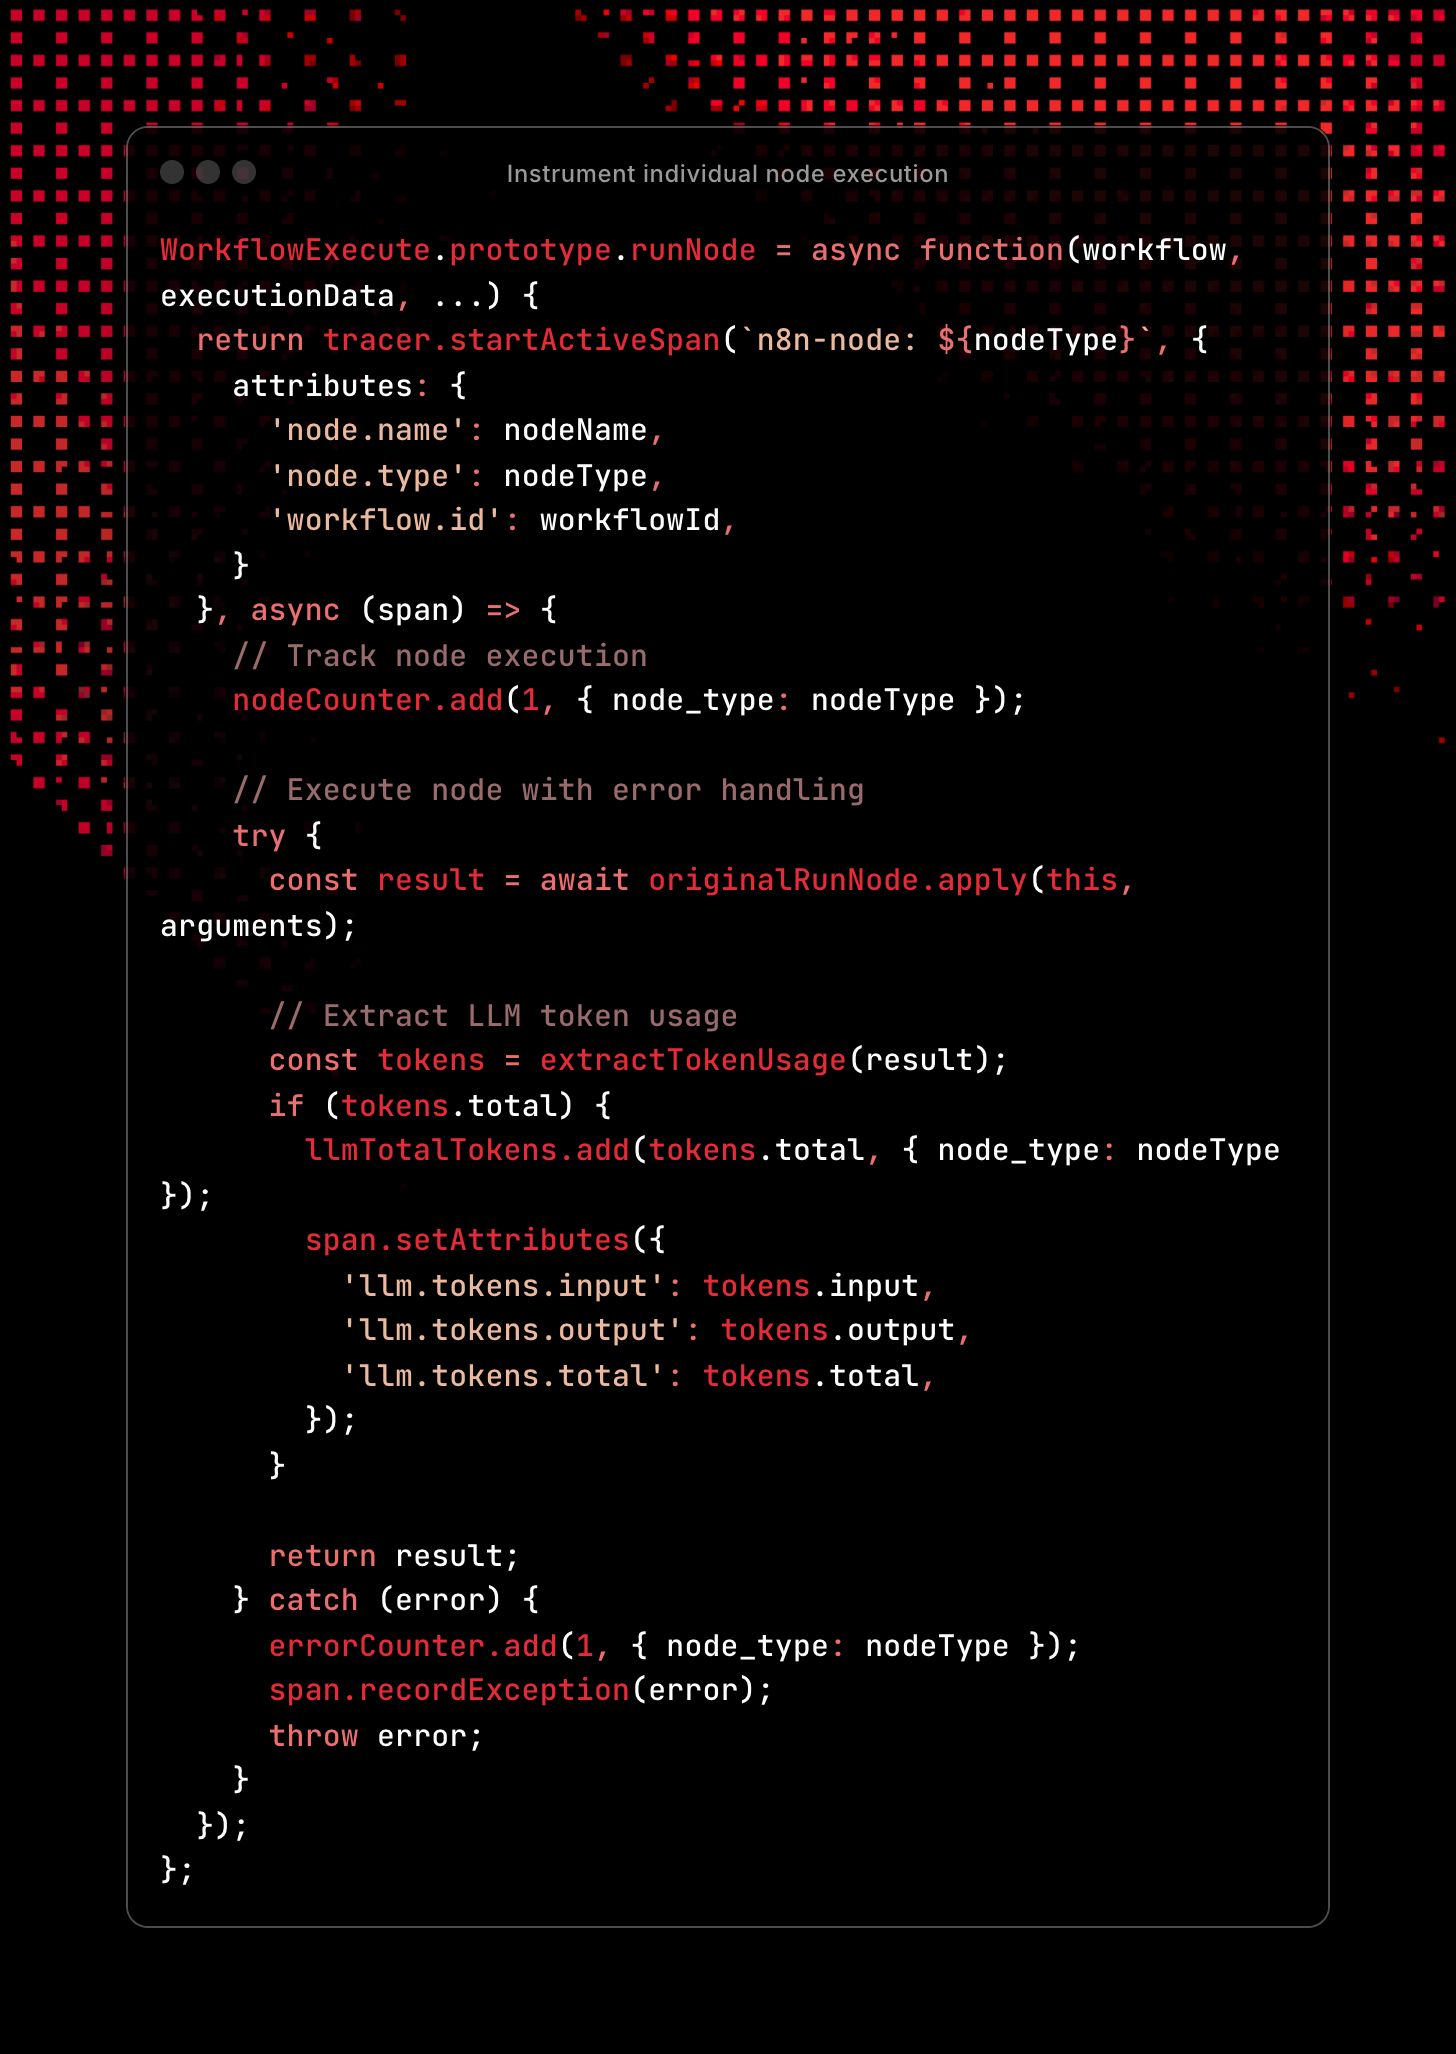
This captures:
- Individual Node Spans: Each node execution gets its own child span under the workflow span, creating a hierarchical trace
- Node Identification: Spans include node name, type, and workflow ID for precise filtering and correlation
- Execution Counting: Immediate metric increment tracks node usage patterns by type
- Async Execution: Uses
async/awaitto properly handle node operations that may involve API calls or database queries - LLM Token Extraction: Automatically detects and extracts token usage from LLM node responses:
- Captures input/output/total tokens from various API response formats
- Records both as span attributes (for traces) and metrics (for aggregation)
- Essential for tracking AI usage costs and rate limits
- Error Handling:
- Success: Returns original result unchanged
- Error: Increments error counter by node type + records full exception details in span
- Re-throws: Preserves original error flow for n8n's error handling
This creates a detailed execution tree where you can see exactly which nodes are slow, which LLM calls are expensive, and where errors occur in your workflows.
Custom Fields
It is quite crucial to capture traces of important events and behaviors within the workflows. So, we ensure the instrumentation creates these business-specific custom fields:
n8n.component- Component identifier for workflow elementsn8n.http.content_type- HTTP content type for API interactionsn8n.http.user_agent- User agent information for HTTP requestsn8n.node.index- Node position/index within the workflown8n.operation- Specific operation being performed by the node
Instrumentation summary
This approach gives you complete visibility into n8n workflows: infrastructure performance, business logic execution, error patterns, and LLM token usage - all correlated through trace IDs and structured attributes.
Setup
Now that you have an overview of the instrumentation. Let's look at how to run this setup on your machine to see this in action.
This Docker Compose setup provides a complete n8n observability stack with Parseable.
Lets look at the key components:
Parseable
Parseable is being used as the observability platform that receives and stores all OpenTelemetry data (logs, traces, metrics). You can access it at localhost:8000 (creds: admin/admin by default). For this blog post demo purpose, we use the standalone mode with local filesystem with persistent volumes.
n8n with OTel integration
This setup uses a custom build defined in Dockerfile.working with integrated OpenTelemetry instrumentation. All telemetry data is configured to be sent to Parseable for comprehensive observability, while Winston integration ensures structured logging is captured and forwarded to Parseable.
n8n:
  build:
    dockerfile: Dockerfile.working
  environment:
    - PARSEABLE_URL=http://parseable:8000
    - OTEL_SERVICE_NAME=n8n-comprehensive
    - N8N_WINSTON_LOGGING=true
PostgreSQL
PostgreSQL serves as the default database for storing n8n workflow definitions and execution history. All PostgreSQL queries are automatically traced via OpenTelemetry, providing visibility into database performance and query execution within your observability stack.
postgres:
  image: postgres:15-alpine
  environment:
    - POSTGRES_DB=n8n
    - POSTGRES_USER=n8n
Environment Variables
Create a .env file with these required variables:
# Parseable credentials
PARSEABLE_USERNAME=admin
PARSEABLE_PASSWORD=admin

# n8n authentication
N8N_BASIC_AUTH_PASSWORD=admin

# Database password
POSTGRES_PASSWORD=admin

# Optional: Custom domain/protocol
N8N_HOST=localhost
N8N_PROTOCOL=http
WEBHOOK_URL=http://localhost:5678/
Get started
git clone https://github.com/parseablehq/n8n-observability.git
cd n8n-observability
cp .env.example .env
# Edit .env with your passwords
docker-compose up -d
You can then access the applications at:
- n8n:
localhost:5678(admin/admin) - Parseable:
localhost:8000(admin/admin)
Verification
Check that all services are running and telemetry is flowing:
# Check service status
docker-compose ps

# View n8n logs for OpenTelemetry initialization
docker logs n8n-comprehensive | grep "OpenTelemetry"

# Verify Parseable streams exist
curl -s http://localhost:8000/api/v1/logstream \
  -H "Authorization: Basic $(echo -n 'admin:admin' | base64)"
You should see two streams: otel-traces, and otel-metrics.
Making Sense of the Data
Once your n8n observability stack is running, you'll have two datasets (otel-traces, otel-metrics) in Parseable. Let's see how to query and analyze them effectively.
Workflow execution metrics
SELECT
  "otel-metrics".metric_name,
  "otel-metrics"."workflow_name",
  "otel-metrics"."workflow_id",
  "otel-metrics".data_point_value,
  "otel-metrics".time_unix_nano
FROM "otel-metrics"
WHERE "otel-metrics".metric_name LIKE '%workflow%'
ORDER BY "otel-metrics".time_unix_nano DESC
LIMIT 20;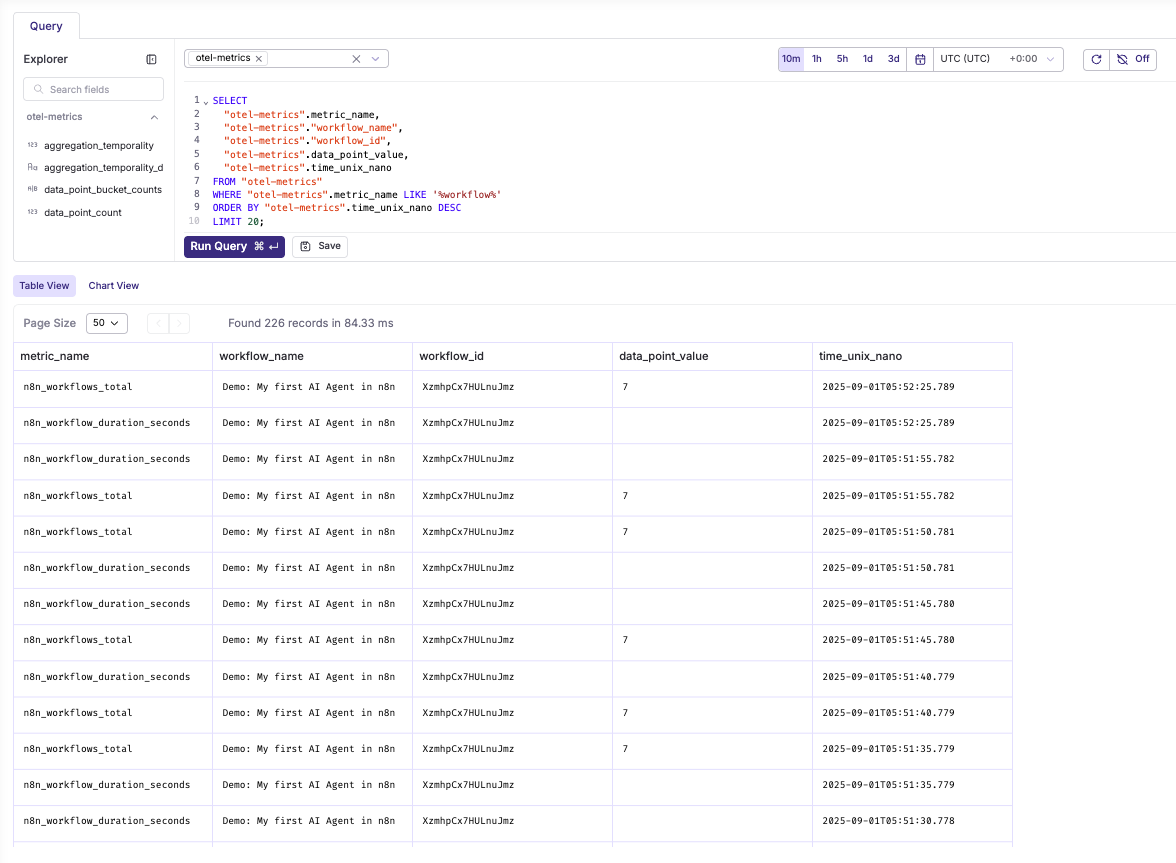
Node performance metrics
SELECT
  "otel-metrics".metric_name,
  "otel-metrics".node_type,
  "otel-metrics".node_name,
  "otel-metrics"."workflow_name",
  "otel-metrics".data_point_value,
  "otel-metrics".time_unix_nano
FROM "otel-metrics"
WHERE "otel-metrics".metric_name LIKE '%node%'
  AND "otel-metrics".node_type IS NOT NULL
ORDER BY "otel-metrics".time_unix_nano DESC
LIMIT 15;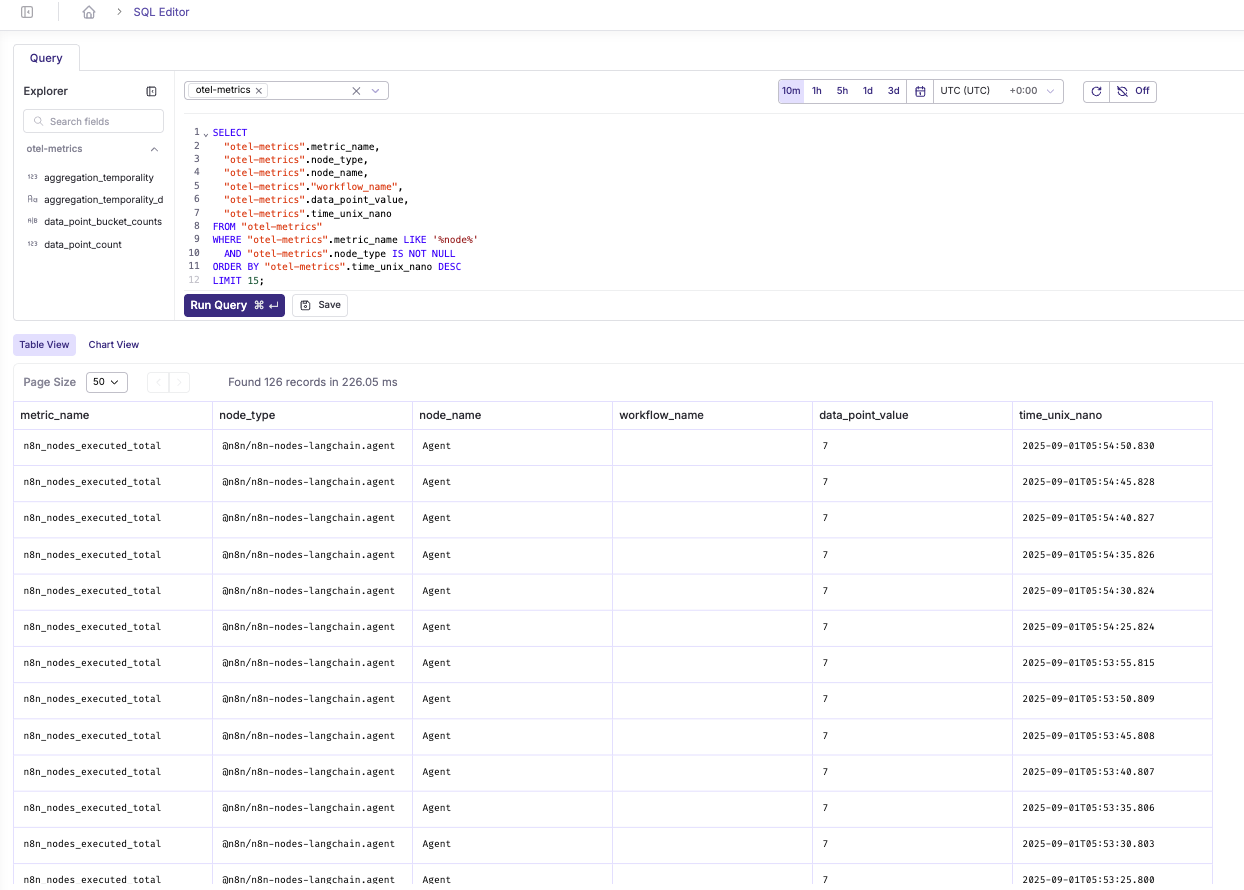
HTTP request success rate
SELECT
  "otel-metrics"."http.response.status_code",
  COUNT(*) as request_count,
  COUNT(*) * 100.0 / SUM(COUNT(*)) OVER() as percentage
FROM "otel-metrics"
WHERE "otel-metrics".metric_name LIKE '%http%'
  AND "otel-metrics"."http.response.status_code" IS NOT NULL
  AND "otel-metrics".p_timestamp > NOW() - INTERVAL '24 hours'
GROUP BY "otel-metrics"."http.response.status_code"
ORDER BY request_count DESC;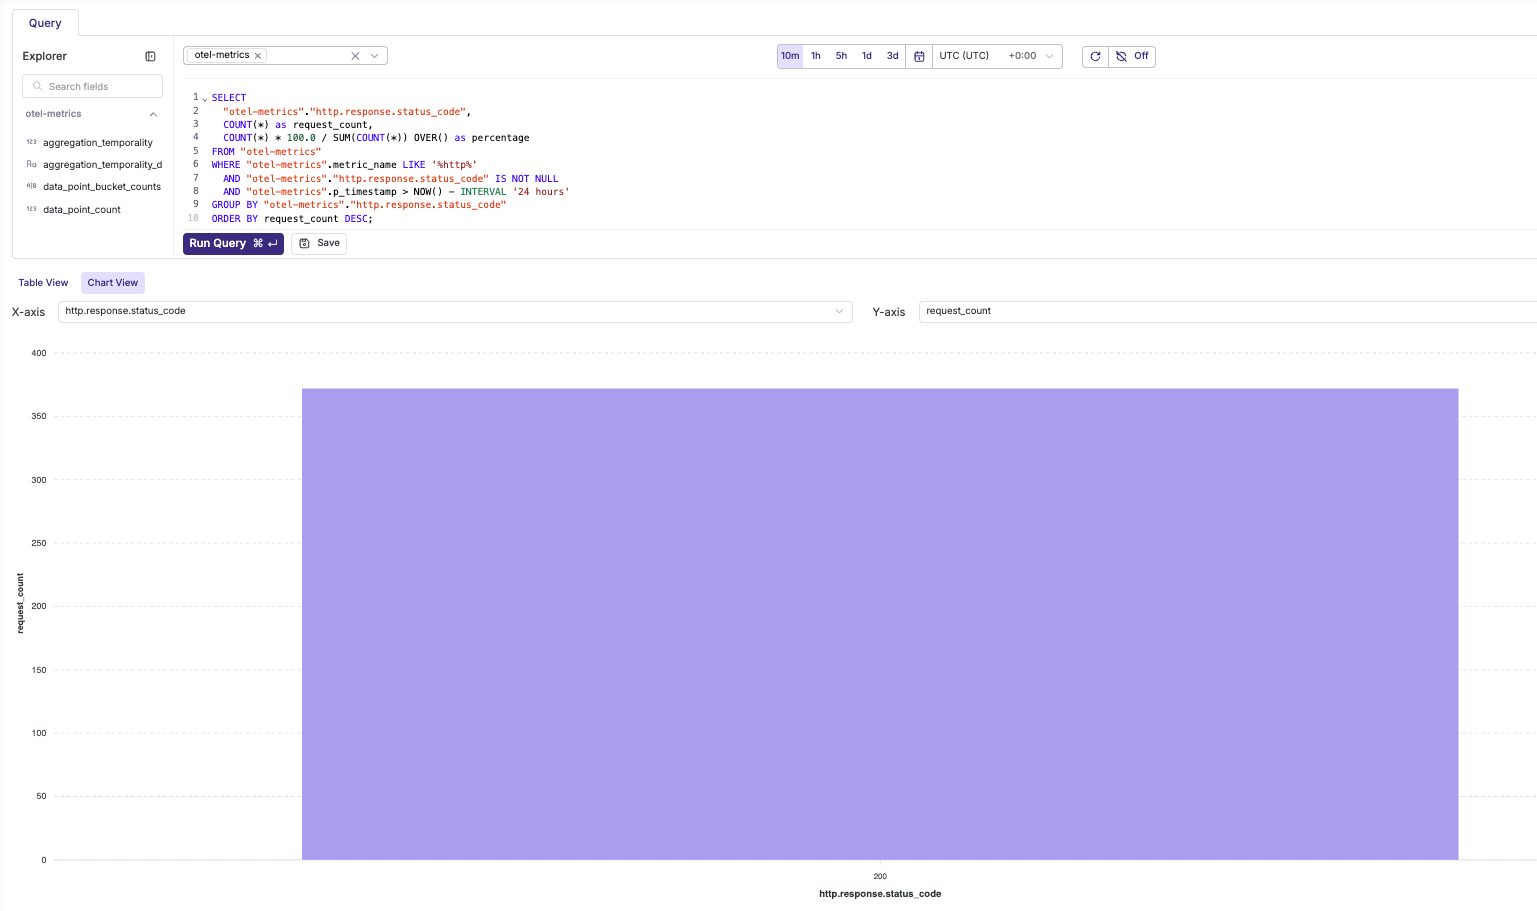
Slowest HTTP requests
SELECT
  "otel-traces".span_name,
  "otel-traces"."http.method",
  "otel-traces"."http.route",
  EXTRACT(EPOCH FROM ("otel-traces".span_end_time_unix_nano - "otel-traces".span_start_time_unix_nano)) * 1000 as duration_ms,
  "otel-traces"."http.response.status_code",
  "otel-traces".span_status_description
FROM "otel-traces"
WHERE "otel-traces".span_name LIKE 'GET %' OR "otel-traces".span_name LIKE 'POST %'
  AND EXTRACT(EPOCH FROM ("otel-traces".span_end_time_unix_nano - "otel-traces".span_start_time_unix_nano)) > 1
ORDER BY EXTRACT(EPOCH FROM ("otel-traces".span_end_time_unix_nano - "otel-traces".span_start_time_unix_nano)) DESC
LIMIT 10;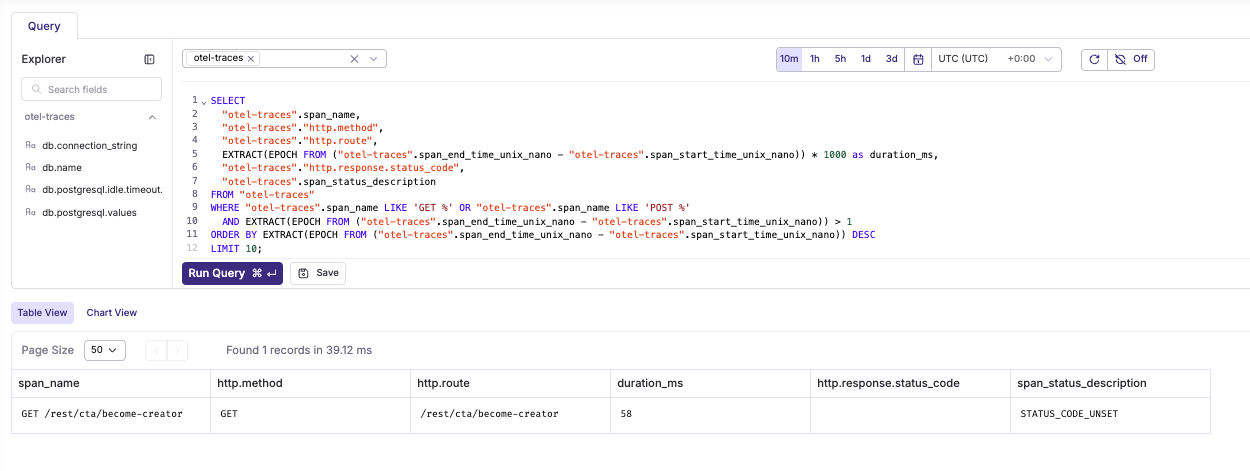
Slowest middleware operations
SELECT
  "otel-traces".span_name,
  EXTRACT(EPOCH FROM ("otel-traces".span_end_time_unix_nano - "otel-traces".span_start_time_unix_nano)) * 1000 as duration_ms,
  "otel-traces".span_status_code,
  "otel-traces".span_status_description
FROM "otel-traces"
WHERE "otel-traces".span_name LIKE 'middleware - %'
ORDER BY EXTRACT(EPOCH FROM ("otel-traces".span_end_time_unix_nano - "otel-traces".span_start_time_unix_nano)) DESC
LIMIT 10;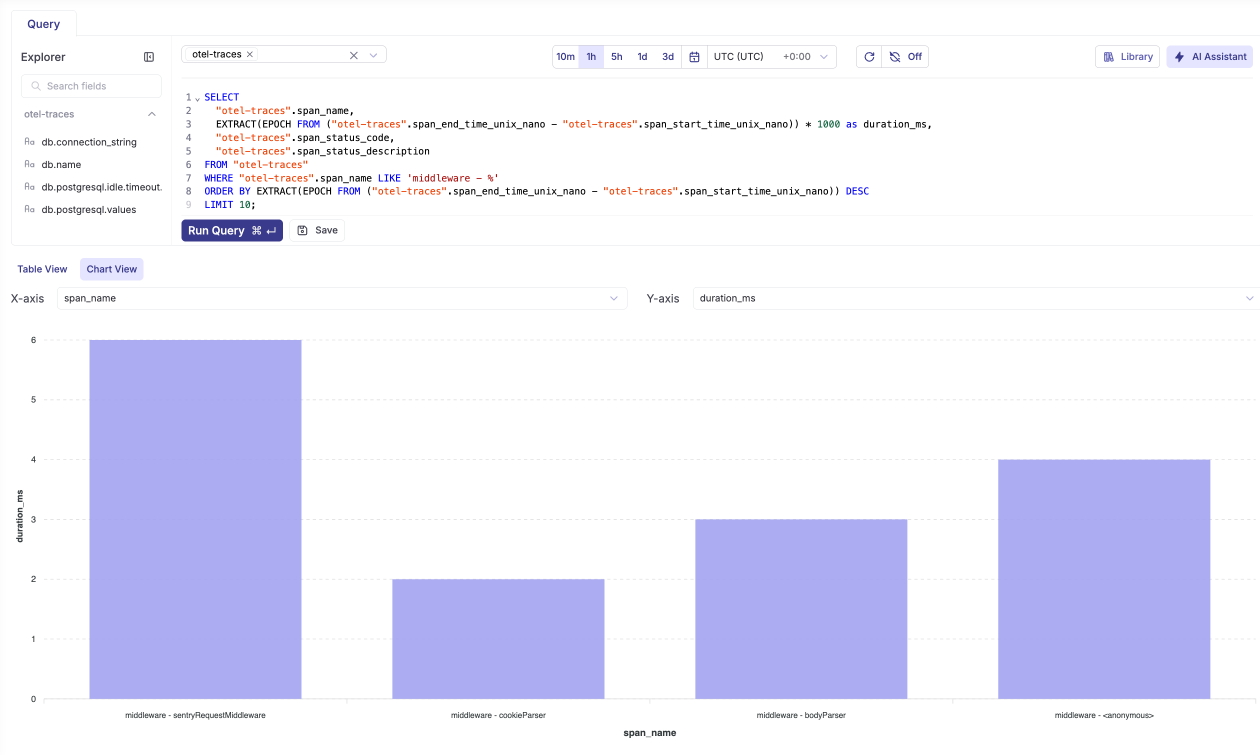
Database query performance
SELECT
  "otel-traces".span_name,
  "otel-traces"."db.statement",
  "otel-traces"."db.system",
  EXTRACT(EPOCH FROM ("otel-traces".span_end_time_unix_nano - "otel-traces".span_start_time_unix_nano)) * 1000 as duration_ms,
  "otel-traces".span_status_code,
  "otel-traces".span_status_description
FROM "otel-traces"
WHERE "otel-traces"."db.system" = 'postgresql'
  AND "otel-traces"."db.statement" IS NOT NULL
ORDER BY "otel-traces".p_timestamp DESC
LIMIT 15;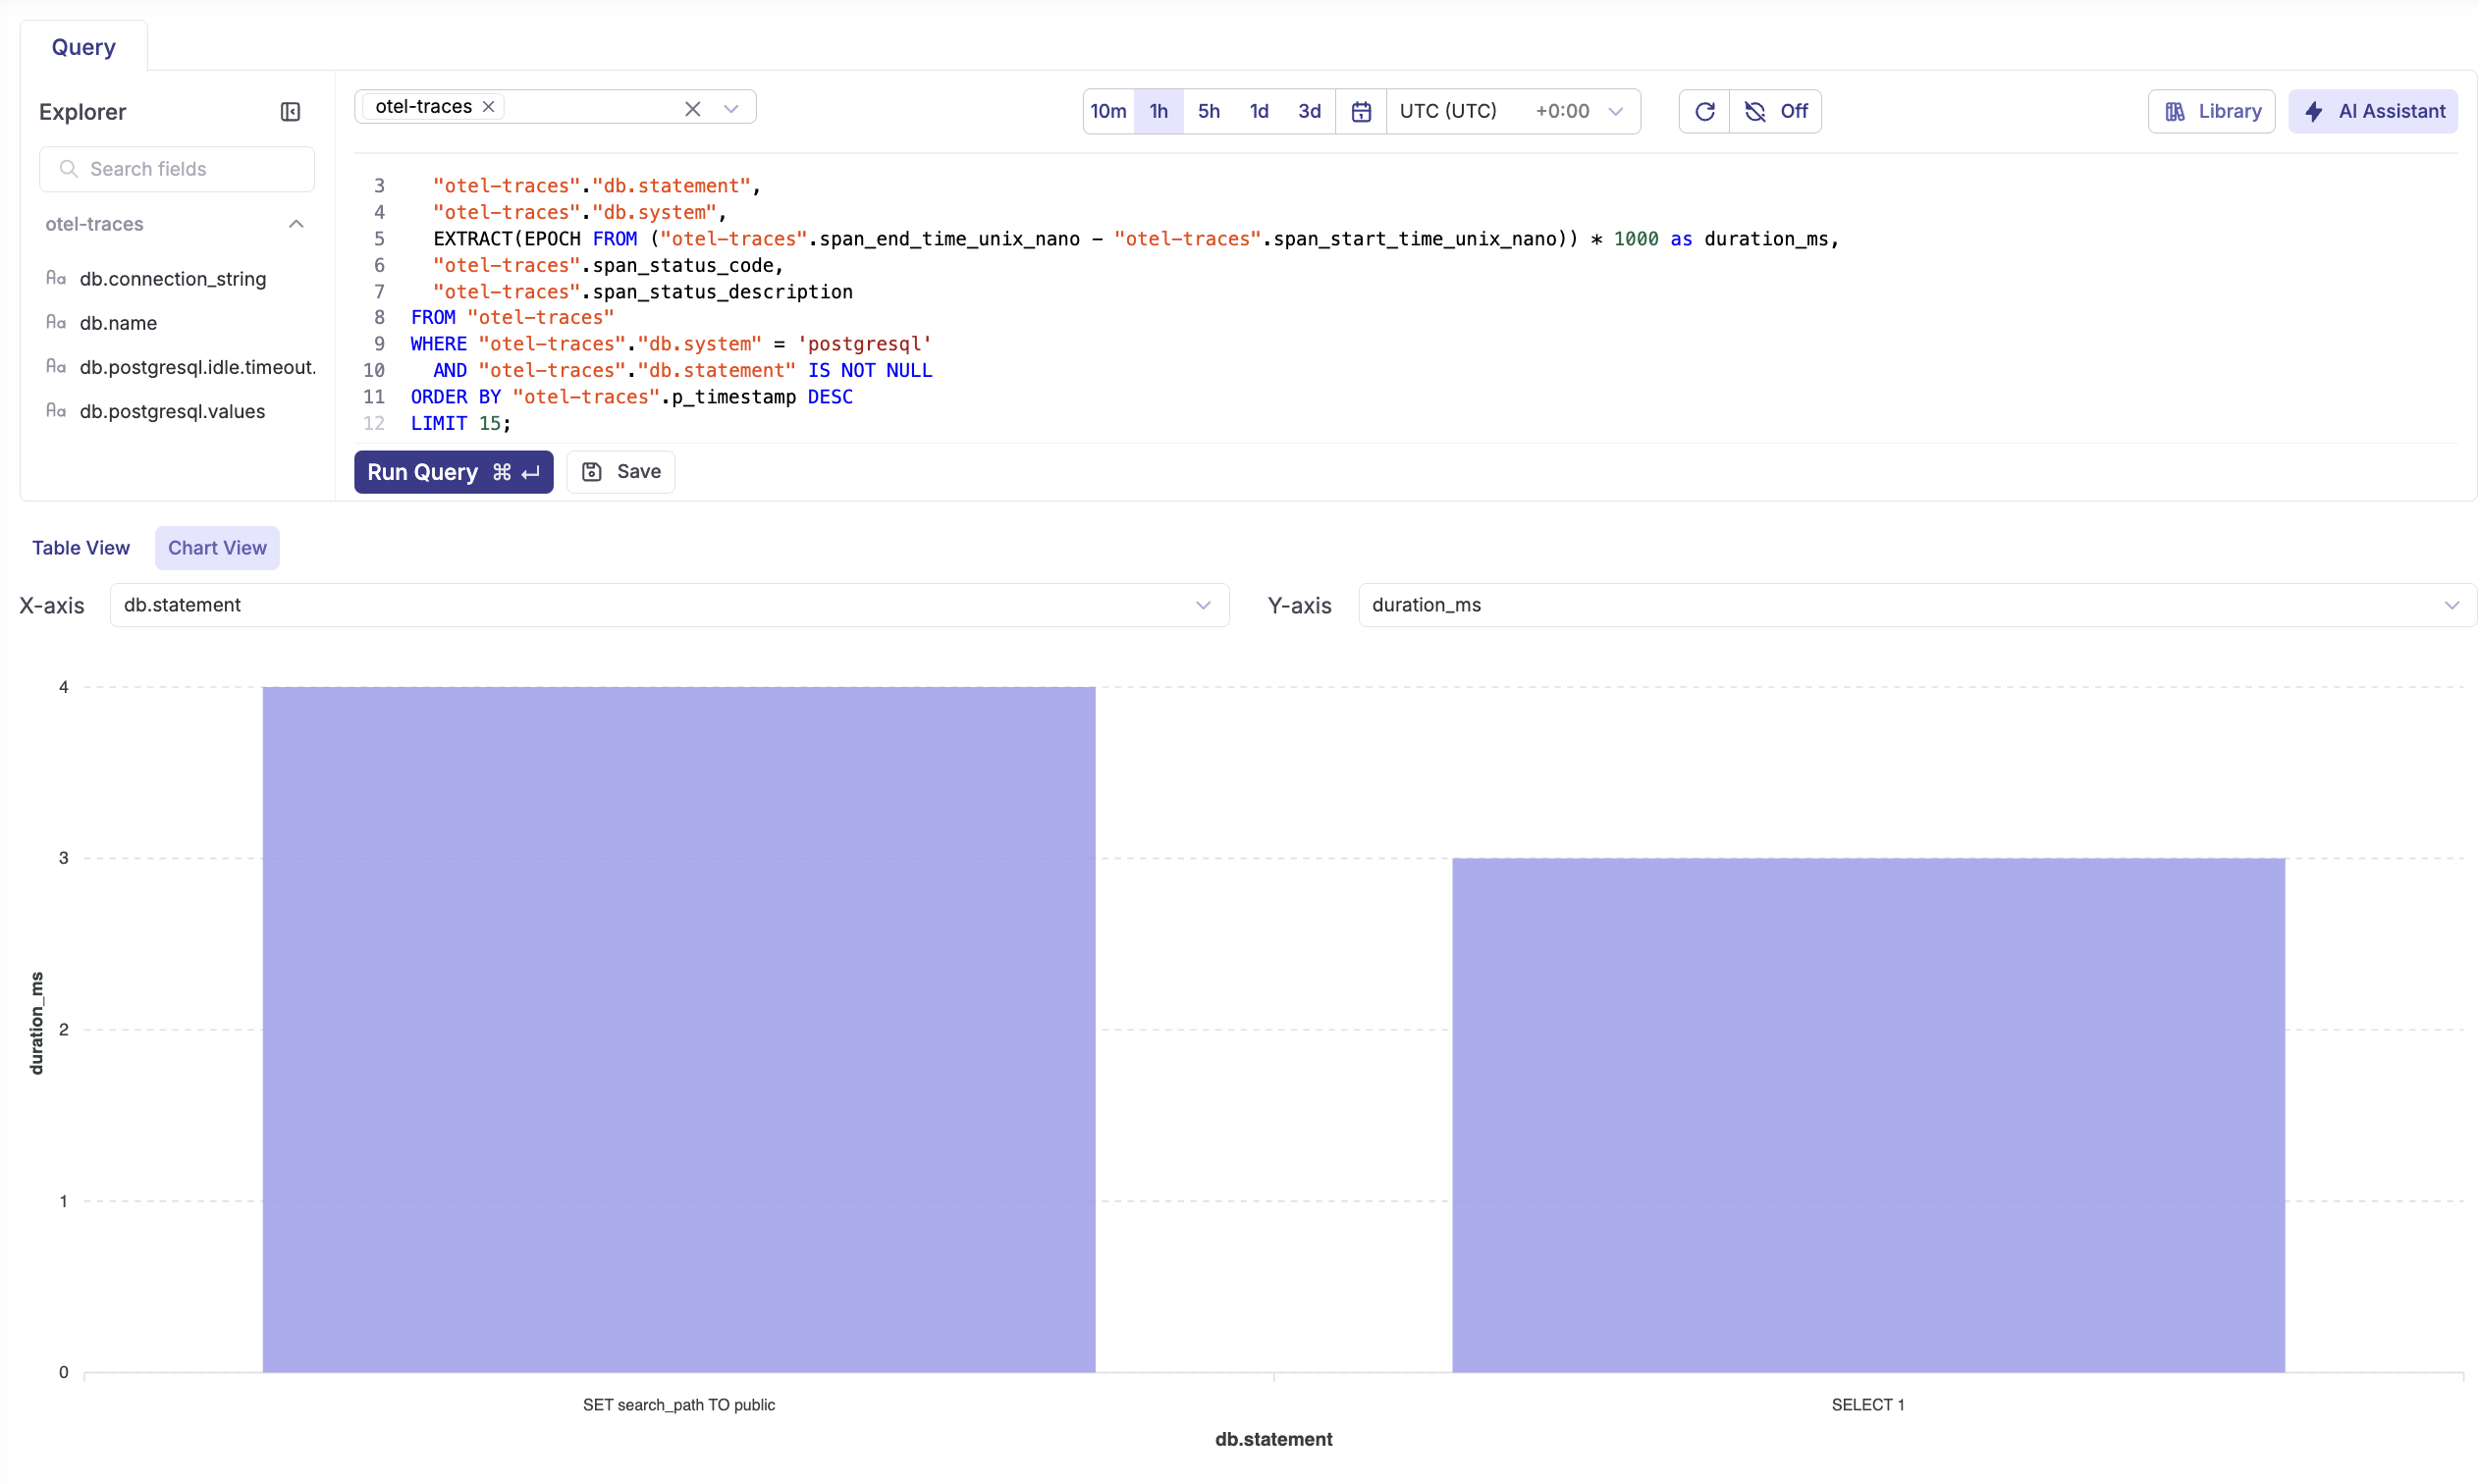
Workflow execution trends
SELECT
  "otel-metrics".metric_name,
  "otel-metrics"."workflow_name",
  COUNT(*) as execution_count,
  AVG("otel-metrics".data_point_value) as avg_value,
  MAX("otel-metrics".data_point_value) as max_value
FROM "otel-metrics"
WHERE "otel-metrics".metric_name LIKE '%workflow%'
  AND "otel-metrics"."workflow_name" IS NOT NULL
GROUP BY "otel-metrics".metric_name, "otel-metrics"."workflow_name"
ORDER BY execution_count DESC;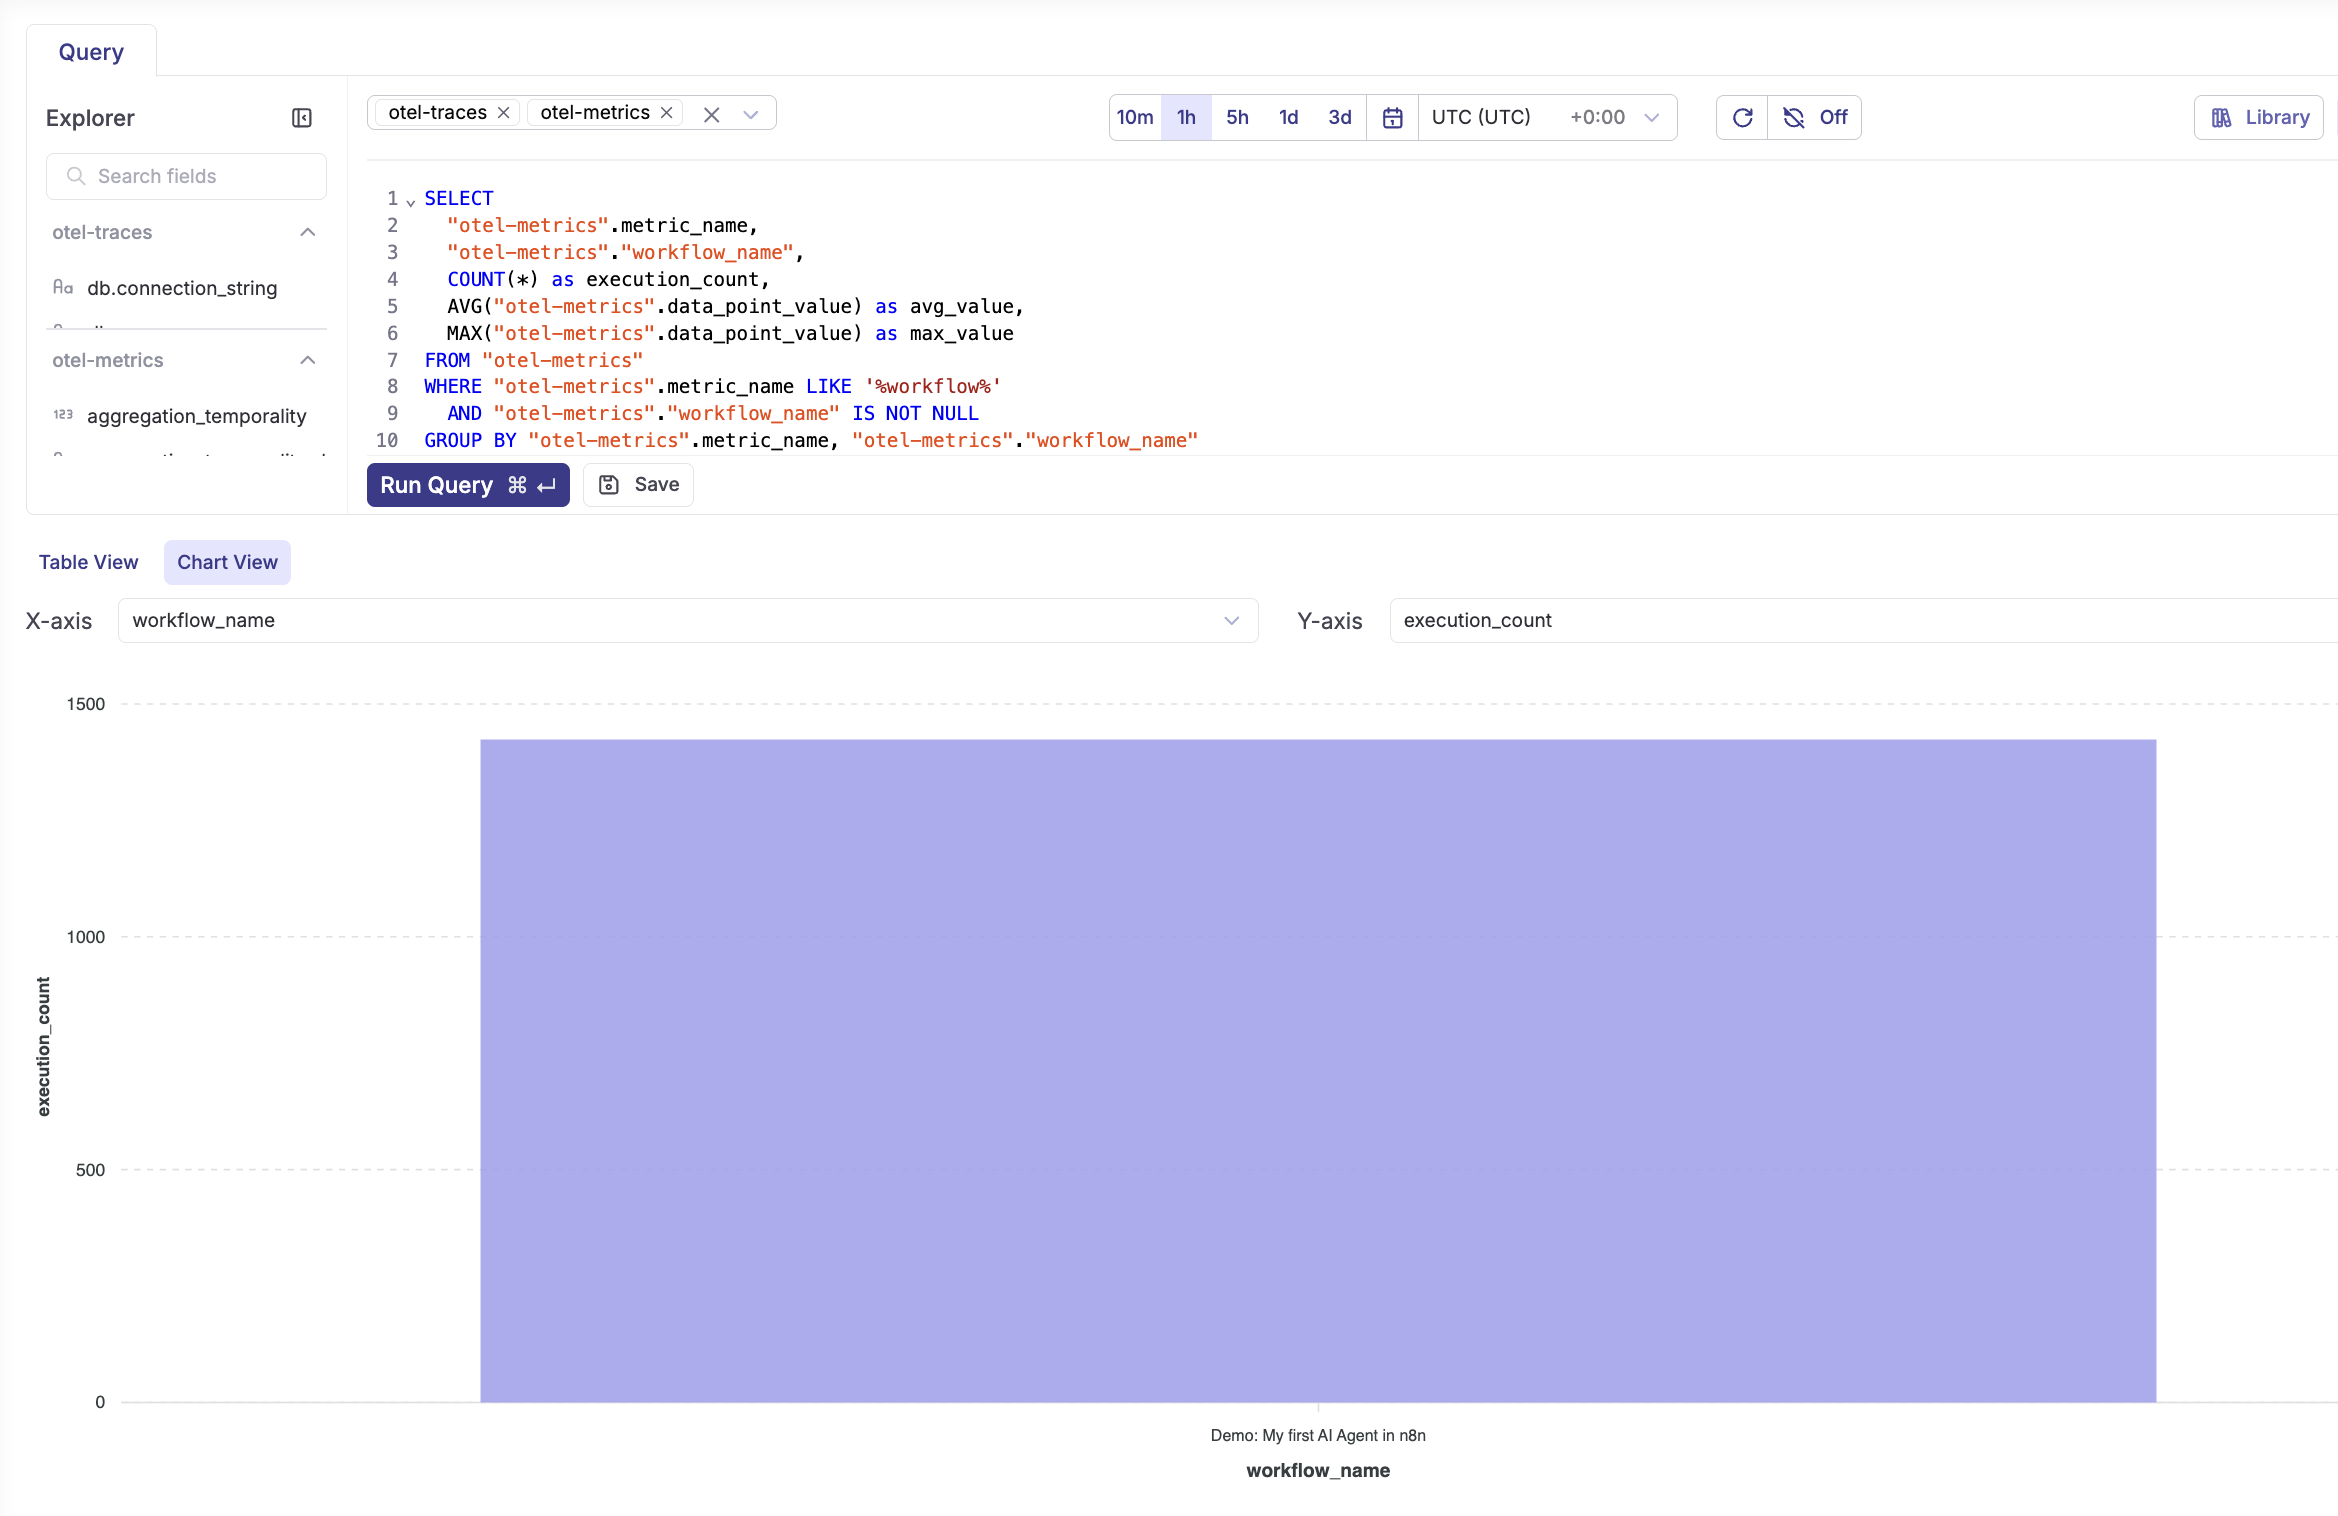
Node performance distribution
SELECT
  "otel-metrics".node_type,
  "otel-metrics".node_name,
  COUNT(*) as execution_count,
  AVG("otel-metrics".data_point_value) as avg_duration,
  MAX("otel-metrics".data_point_value) as max_duration
FROM "otel-metrics"
WHERE "otel-metrics".metric_name LIKE '%node%duration%'
  AND "otel-metrics".node_type IS NOT NULL
GROUP BY "otel-metrics".node_type, "otel-metrics".node_name
ORDER BY avg_duration DESC
LIMIT 20;
HTTP request patterns
SELECT
  "otel-metrics"."http.method",
  "otel-metrics"."http.response.status_code",
  COUNT(*) as request_count,
  AVG("otel-metrics".data_point_value) as avg_response_time
FROM "otel-metrics"
WHERE "otel-metrics".metric_name LIKE '%http%duration%'
  AND "otel-metrics"."http.method" IS NOT NULL
GROUP BY "otel-metrics"."http.method", "otel-metrics"."http.response.status_code"
ORDER BY request_count DESC;
Failed HTTP requests
SELECT
  "otel-traces".span_name,
  "otel-traces"."http.method",
  "otel-traces"."http.response.status_code",
  "otel-traces".span_status_description,
  "otel-traces"."exception.message",
  "otel-traces"."exception.type",
  "otel-traces".p_timestamp
FROM "otel-traces"
WHERE "otel-traces".span_status_code = 2  -- ERROR
  AND ("otel-traces".span_name LIKE 'GET %' OR "otel-traces".span_name LIKE 'POST %')
ORDER BY "otel-traces".p_timestamp DESC
LIMIT 10;
Router and request handler failures
SELECT
  "otel-traces".span_name,
  "otel-traces"."http.route",
  "otel-traces"."http.method",
  "otel-traces"."exception.message",
  "otel-traces"."exception.type",
  "otel-traces"."exception.stacktrace"
FROM "otel-traces"
WHERE "otel-traces".span_status_code = 2
  AND ("otel-traces".span_name LIKE 'router - %' OR "otel-traces".span_name LIKE 'request handler - %')
ORDER BY "otel-traces".p_timestamp DESC
LIMIT 15;
Error rate by operation type
SELECT
  CASE
    WHEN "otel-traces".span_name LIKE 'GET %' THEN 'HTTP GET'
    WHEN "otel-traces".span_name LIKE 'POST %' THEN 'HTTP POST'
    WHEN "otel-traces".span_name LIKE 'middleware - %' THEN 'Middleware'
    WHEN "otel-traces".span_name LIKE 'router - %' THEN 'Router'
    WHEN "otel-traces".span_name LIKE 'pg.query:%' THEN 'Database Query'
    ELSE 'Other'
  END as operation_type,
  COUNT(*) as total_executions,
  SUM(CASE WHEN "otel-traces".span_status_code = 2 THEN 1 ELSE 0 END) as error_count,
  (SUM(CASE WHEN "otel-traces".span_status_code = 2 THEN 1 ELSE 0 END) * 100.0 / COUNT(*)) as error_rate
FROM "otel-traces"
GROUP BY operation_type
ORDER BY error_rate DESC;
Token consumption by workflow
SELECT
  "otel-metrics"."workflow_name",
  "otel-metrics".node_type,
  SUM(CAST("otel-metrics".data_point_value AS BIGINT)) as total_tokens,
  COUNT(*) as llm_calls
FROM "otel-metrics"
WHERE "otel-metrics".metric_name LIKE '%token%'
  AND "otel-metrics"."workflow_name" IS NOT NULL
  AND "otel-metrics".node_type IS NOT NULL
GROUP BY "otel-metrics"."workflow_name", "otel-metrics".node_type
ORDER BY total_tokens DESC;
Daily token usage trends
SELECT
  DATE("otel-metrics".p_timestamp) as date,
  SUM(CAST("otel-metrics".data_point_value AS BIGINT)) as daily_tokens,
  COUNT(DISTINCT "otel-metrics"."workflow_id") as workflows_with_llm
FROM "otel-metrics"
WHERE "otel-metrics".metric_name LIKE '%token%'
  AND "otel-metrics".p_timestamp > NOW() - INTERVAL '7 days'
GROUP BY DATE("otel-metrics".p_timestamp)
ORDER BY date DESC;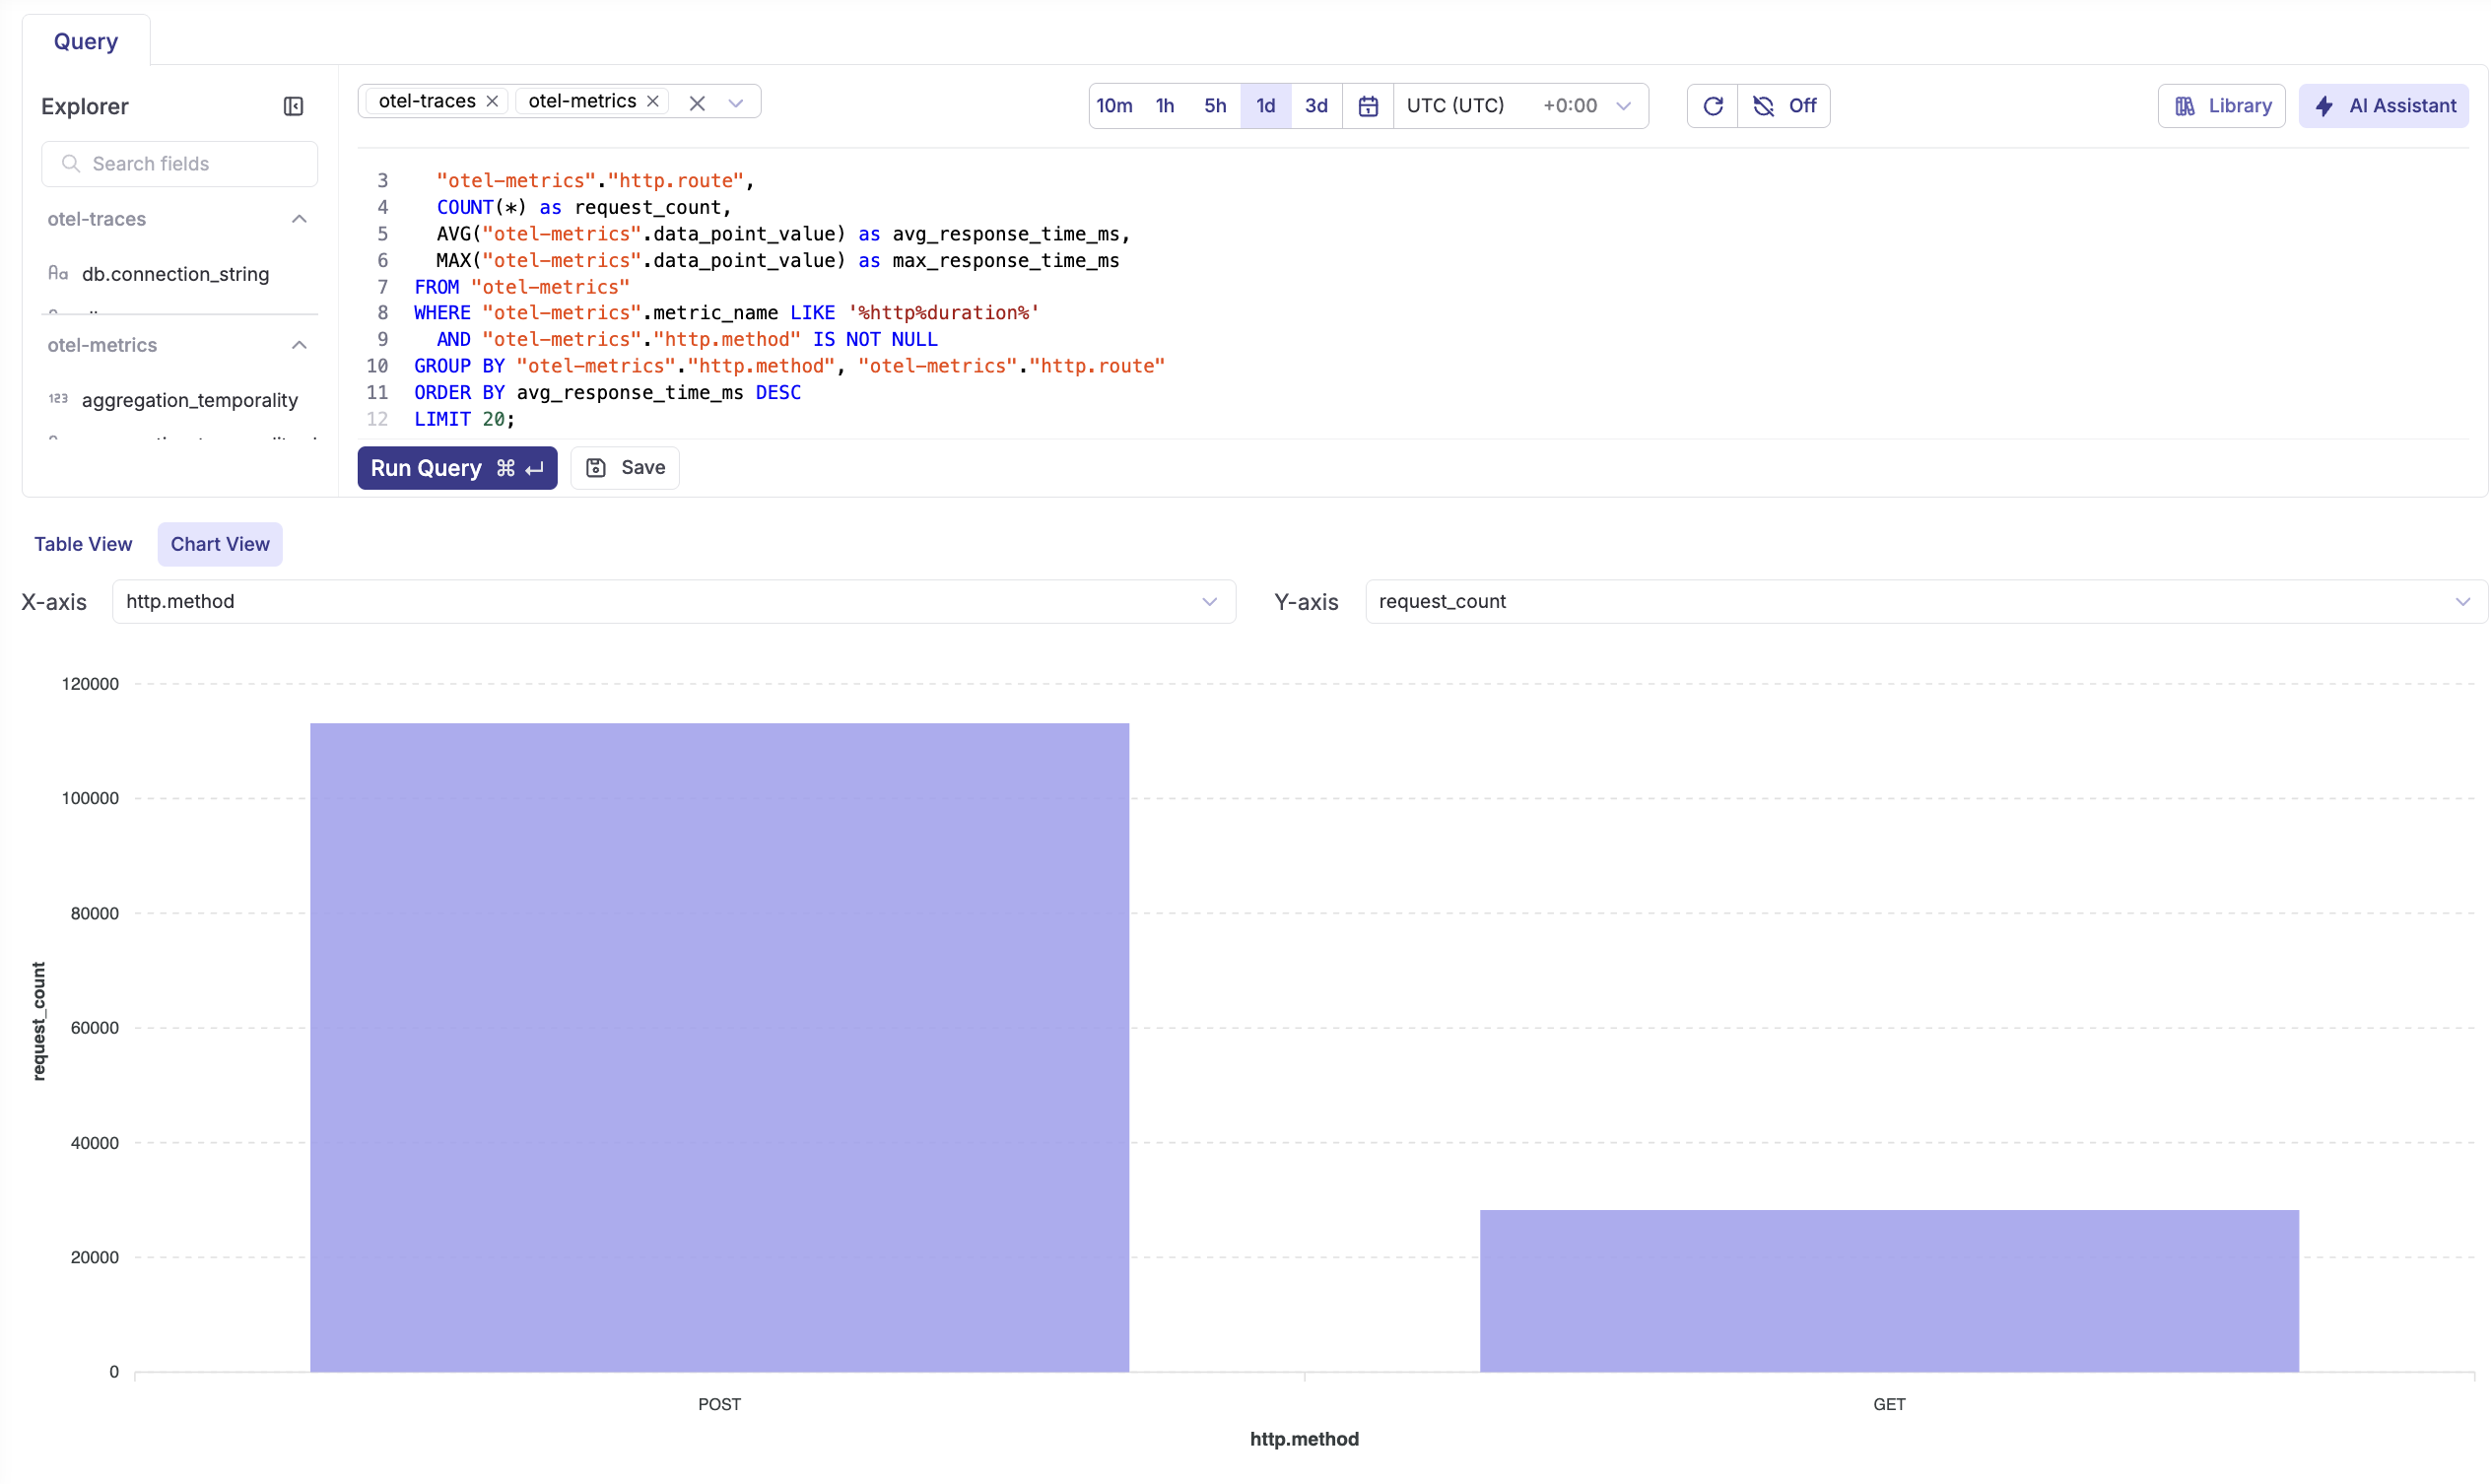
API endpoint performance
SELECT
  "otel-traces"."http.route",
  "otel-traces"."http.method",
  COUNT(*) as total_calls,
  AVG(EXTRACT(EPOCH FROM ("otel-traces".span_end_time_unix_nano - "otel-traces".span_start_time_unix_nano)) * 1000) as avg_duration_ms,
  COUNT(CASE WHEN "otel-traces".span_status_code = 2 THEN 1 END) as error_count
FROM "otel-traces"
WHERE "otel-traces"."http.route" IS NOT NULL
  AND ("otel-traces".span_name LIKE 'GET %' OR "otel-traces".span_name LIKE 'POST %')
GROUP BY "otel-traces"."http.route", "otel-traces"."http.method"
ORDER BY total_calls DESC;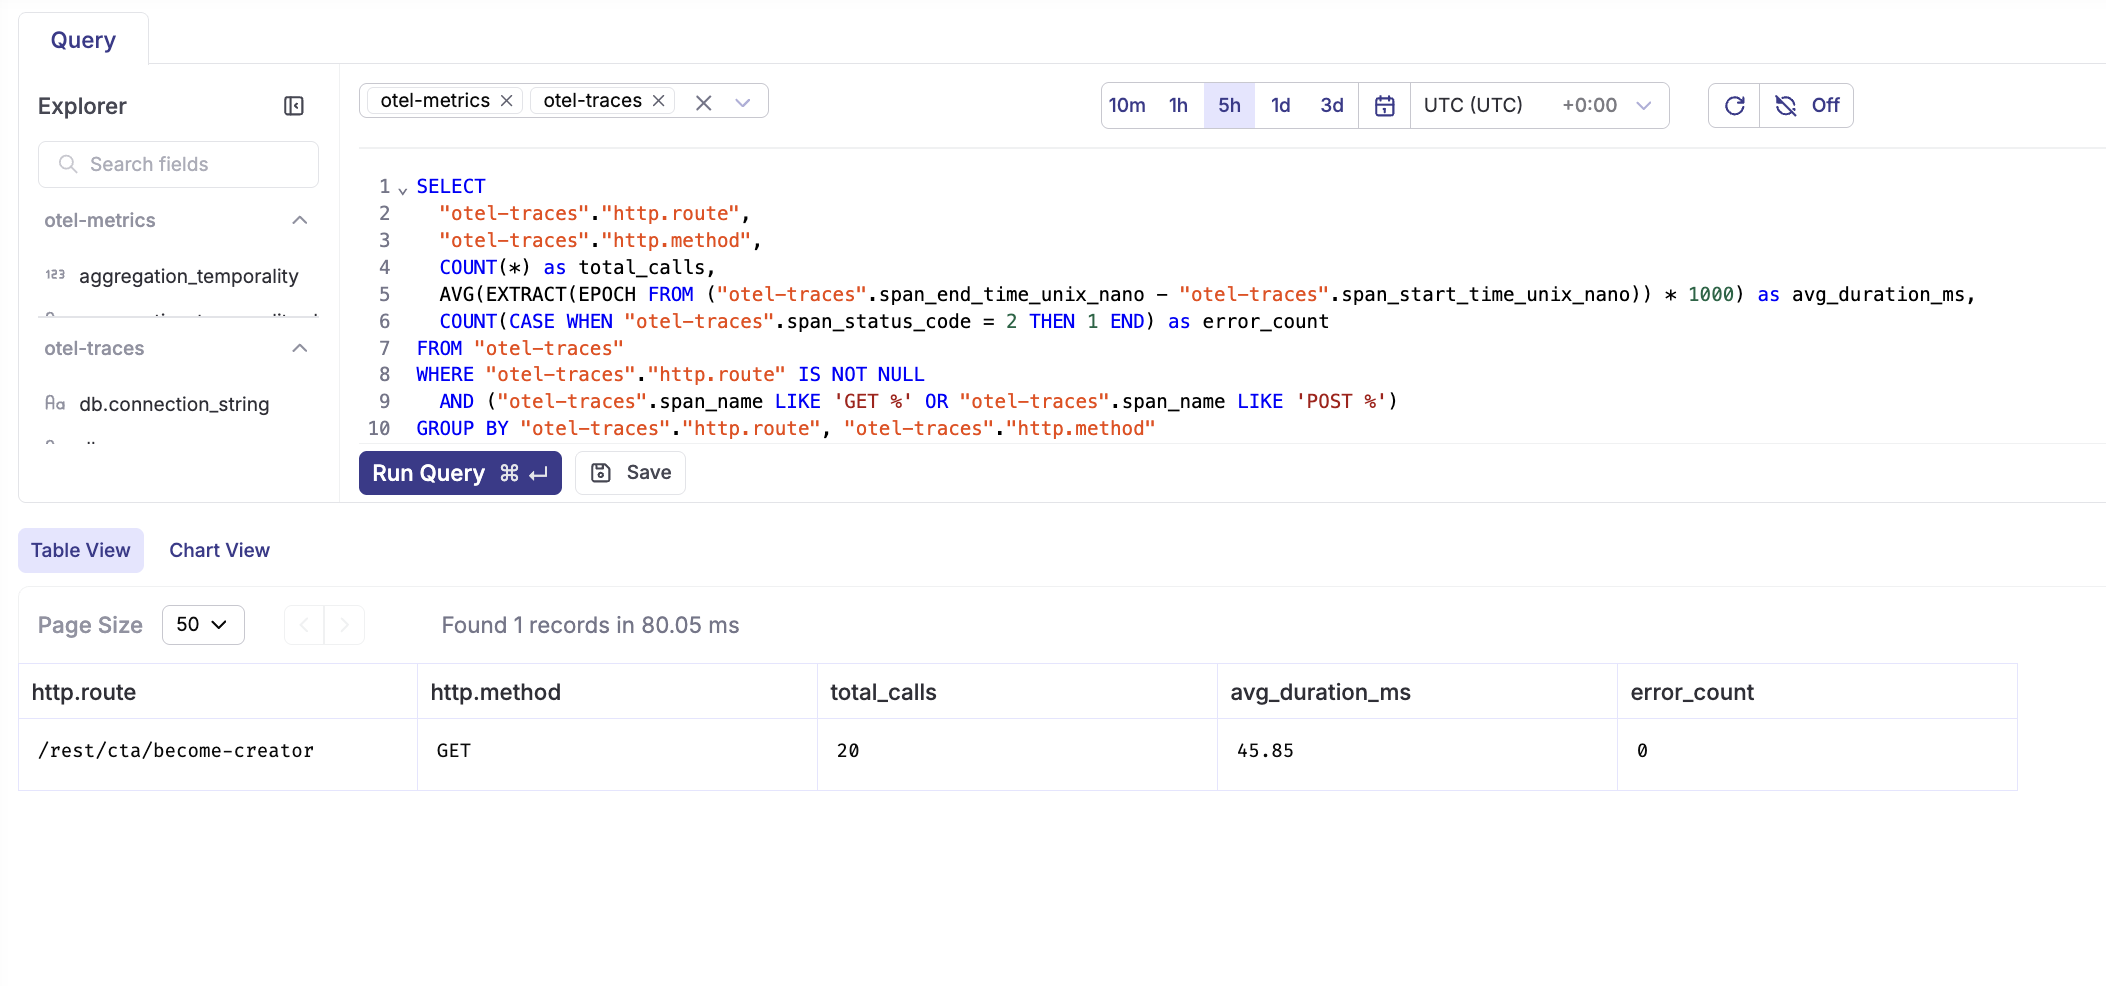
These queries provide the foundation for understanding your n8n workflow performance, identifying bottlenecks, tracking errors, and monitoring LLM usage costs.
Setup alerts
Parseable provides a powerful alerting system that allows you to monitor your n8n workflows proactively. You can create alerts based on metrics, traces, or logs to catch issues before they impact your operations.
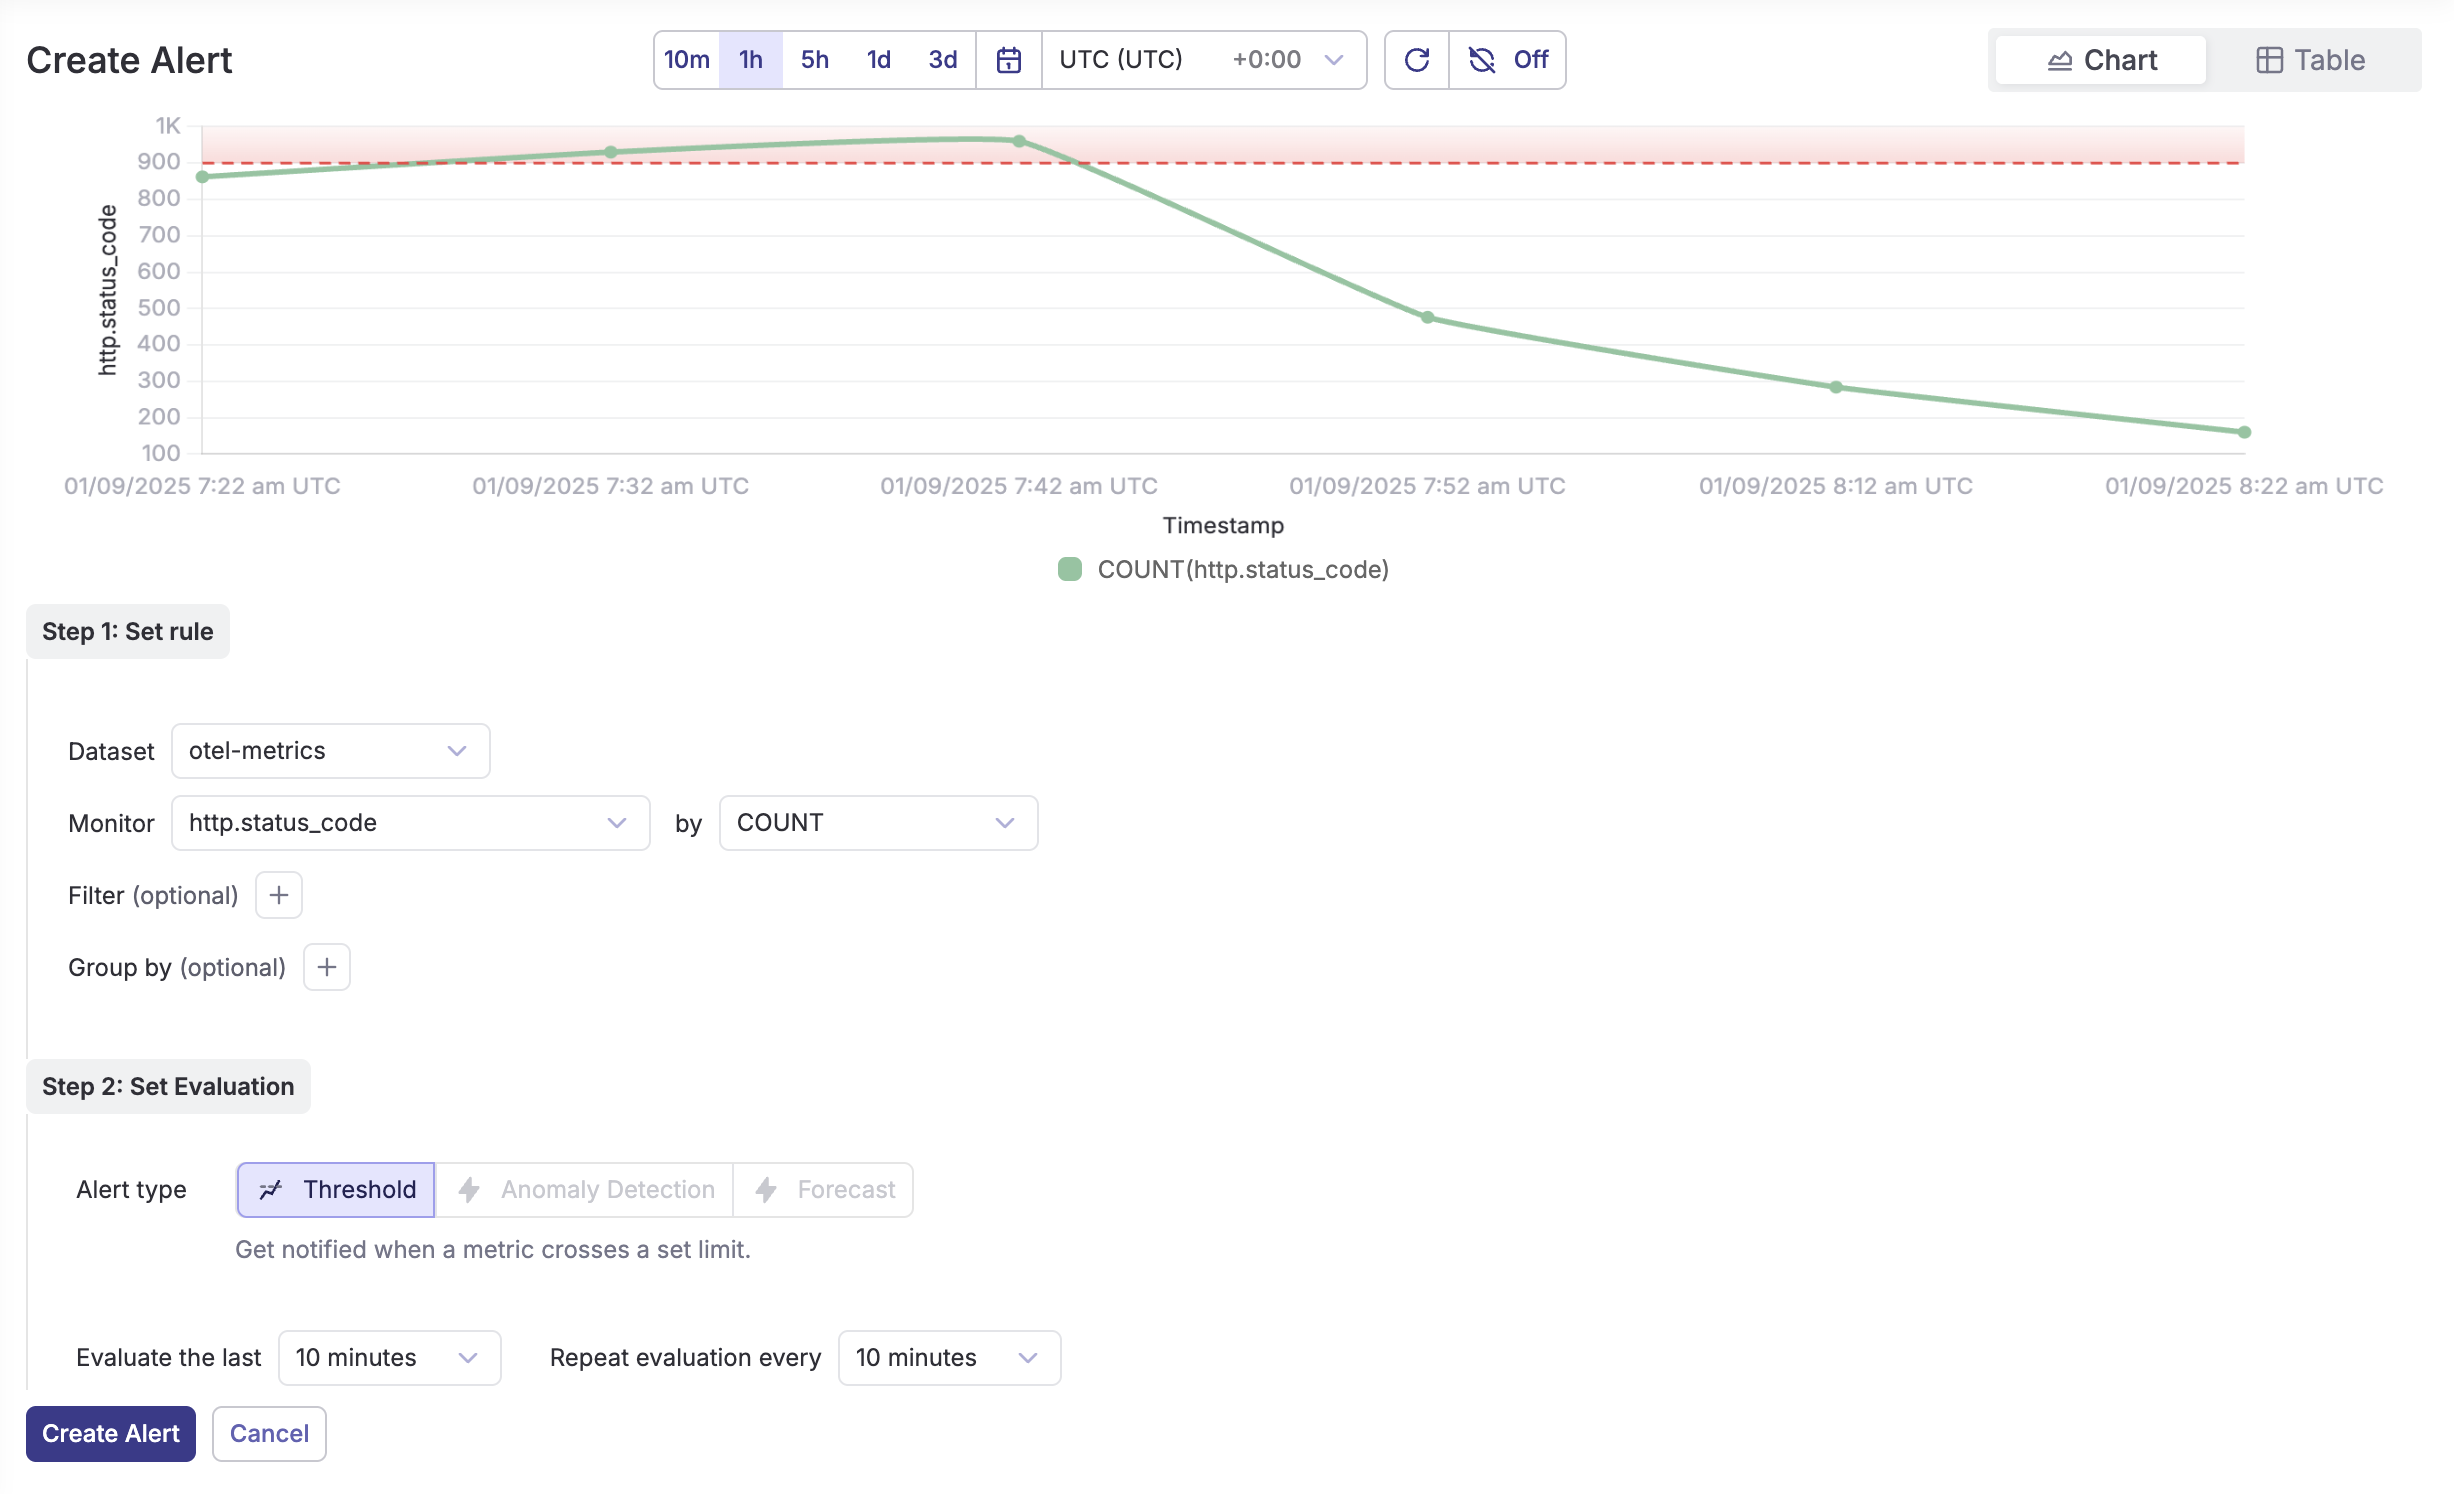
Creating threshold alerts
HTTP Error Rate Alert Monitor when your n8n instance experiences high error rates:
- Dataset:
otel-metrics - Monitor:
http.status_codebyCOUNT - Filter: Add filter for
http.response.status_code >= 400 - Threshold: Set to trigger when error count > 900 in the last 5 minutes
- Evaluation: Every 5 minutes
High Response Time Alert Get notified when API response times exceed acceptable thresholds:
- Dataset:
otel-metrics - Monitor:
data_point_value(for duration metrics) - Filter:
metric_name LIKE '%http%duration%' - Threshold: Trigger when average response time > 2000ms
- Group by:
http.routeto identify specific endpoints
Alert Delivery Options
Parseable supports multiple notification channels:
- Webhook: Send alerts to Slack, Discord, or custom endpoints
- Email: Direct email notifications to your team
- PagerDuty: Integration for critical production alerts
Best Practices for n8n Alerts
- Layered Alerting: Set up multiple severity levels (warning, critical)
- Context-Rich Notifications: Include workflow IDs and execution details
- Alert Fatigue Prevention: Use appropriate thresholds to avoid noise
- Escalation Policies: Define clear escalation paths for different alert types
- Regular Review: Periodically review and adjust alert thresholds based on patterns
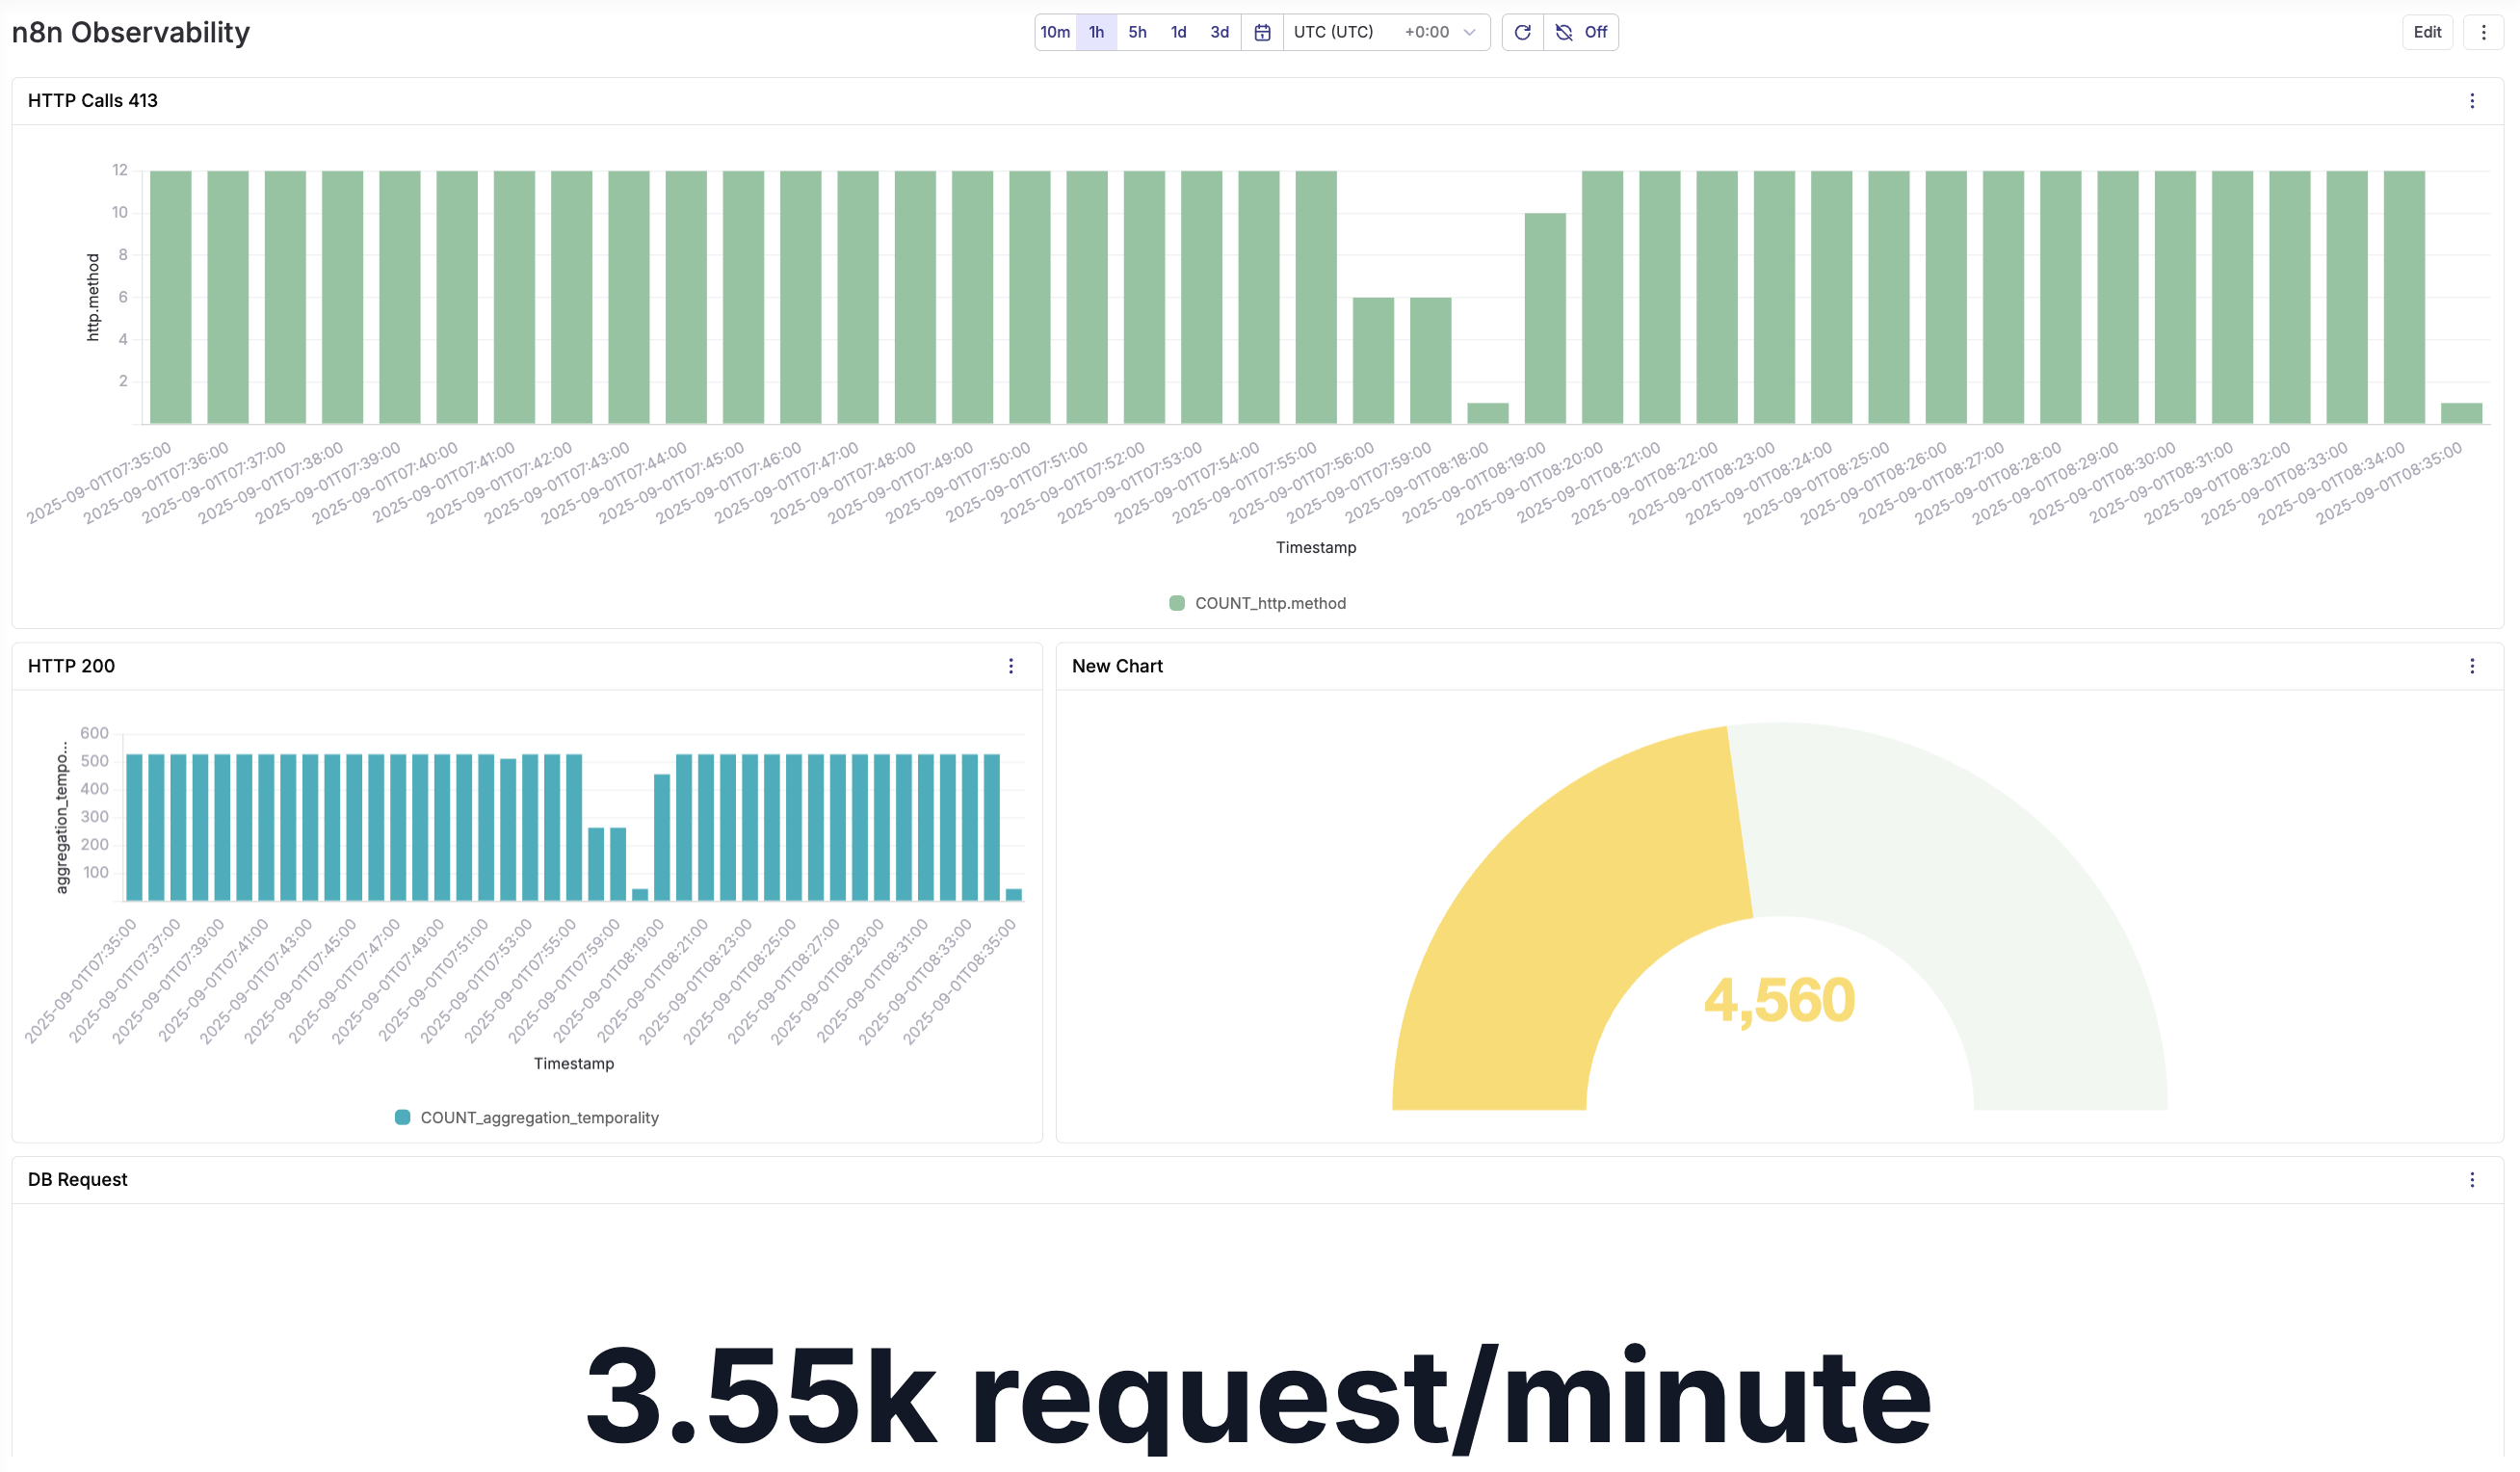
Creating Dashboards
Parseable's dashboard feature allows you to create comprehensive visual monitoring for your n8n workflows. You can combine multiple charts and metrics into a single view for real-time operational insights.
Conclusion
Implementing comprehensive observability for n8n workflows transforms how you monitor, debug, and optimize your automation pipelines. By integrating OpenTelemetry instrumentation with Parseable's powerful analytics platform, you gain unprecedented visibility into every aspect of your workflow executions.
Stay tuned for Part 2 of this series, where we'll dive deep into advanced log analysis based on logs collected from n8n using winston, setting up intelligent alerts for proactive monitoring, creating comprehensive dashboards for real-time n8n workflow visualization, and detailed LLM token cost analysis with forecasting models to optimize AI-powered workflow expenses.
Key Benefits Achieved
Performance Optimization: With detailed traces and metrics, you can identify bottlenecks in workflow execution, optimize slow-running nodes, and ensure your automation scale efficiently as your business grows.
Proactive Error Management: Real-time monitoring of workflow failures, node errors, and LLM API issues enables rapid response to problems before they impact your operations. The structured logging and alerting capabilities help maintain high availability.
Cost Control: Tracking LLM token usage, API call patterns, and resource consumption provides the data needed to optimize costs while maintaining performance. This is especially crucial as AI-powered workflows become more prevalent.
Operational Excellence: The combination of logs, metrics, and traces creates a complete picture of your n8n infrastructure health, enabling data-driven decisions about scaling, resource allocation, and workflow design.

