

Database issues rarely announce themselves. They arrive as gradually rising query latency, steadily climbing connection counts, a cache hit ratio drifting downward, or a table scan that was never a problem at low volume but becomes one as traffic grows. By the time an alert fires or a user reports slowness, the database has often been degrading for minutes or hours.
Proactive database monitoring means catching those signals before they compound. Instead of waiting for a threshold to cross, teams build baselines, watch for deviations, track query-level behavior, and correlate database telemetry with application performance — so they can act before users are affected.
This guide covers what proactive database monitoring involves, which metrics matter, how to set up alerting that detects trends rather than just breaches, and how Parseable's telemetry platform and agentic monitoring workflows support earlier detection.
What is proactive database monitoring?
Proactive vs reactive monitoring
Most database monitoring today is reactive. A metric crosses a fixed threshold, an alert fires, and a team investigates. That model has a fundamental problem: by the time a threshold is crossed, the database has already been degrading. Users may already be experiencing slow page loads, failed transactions, or timeout errors.
Proactive database monitoring shifts the detection point earlier by:
- Tracking trends: is p95 query latency rising over the last 30 minutes, even if it hasn't crossed an alert threshold yet?
- Using baselines: is today's connection count higher than the typical Monday morning pattern?
- Monitoring query-level behavior: which specific queries are consuming the most resources, and is that changing?
- Correlating signals: is application latency rising in step with database read latency, suggesting the database is the bottleneck?
The goal is not to eliminate reactive alerting entirely. It is to add an earlier detection layer that catches weak signals before they become hard failures.
Why availability monitoring is not enough
A database can return a successful health check while still causing poor application performance. Connection pools can be exhausted. Query plans can have degraded without schema changes. Lock contention can be causing serial request queuing. Replication lag can be growing silently.
OS-level server metrics — CPU, memory, disk — can also miss the query-level causes of user-facing issues. A server with 40% CPU utilization can still have one blocking query serializing hundreds of requests. Proactive database health monitoring requires going below the infrastructure layer to query execution, lock state, and workload composition.
Start observing your database with Parseable in minutes. Get started for free
Why proactive database monitoring matters
Preventing cascading failures
Database failures rarely stay isolated. When a production database degrades, connection pools fill, application response times slow, retries increase, and upstream services queue. A single overlooked signal, a table growing past an index threshold, a cache warming after a restart, a query suddenly scanning ten times more rows — can trigger a cascade.
The February 2025 Slack outage is a clear example: a maintenance action triggered database overload, which compounded with caching latency issues. As cache failures caused a surge of direct database queries, nearly 50% of instances became overwhelmed, causing cascading failures. The Slack SRE team resolved it well and published a detailed postmortem, but proactive query latency and cache miss monitoring could have surfaced early warning signals before the cascade started.
Connecting database behavior to user experience
Slow databases produce slow applications. When query latency rises, API response times follow. When connection pools are exhausted, requests fail or queue. When replication lag grows, read replicas return stale data.
Proactive database performance monitoring makes this connection explicit. By tracking query latency, throughput, connection state, and error rates together, teams can see the relationship between database behavior and application performance before users file support tickets.
Supporting capacity planning
Proactive monitoring also surfaces long-term trends. Storage consumption growing 3% per week is not an emergency today, but it becomes one in two months if teams do not plan for it. Connection counts consistently peaking near pool limits suggest a scaling conversation before a hard failure. CPU and I/O trends during peak traffic windows guide infrastructure decisions.
Reducing alert fatigue
Static threshold alerts are brittle. Set them too low and teams get desensitized by constant noise. Set them too high and slow-moving degradation goes unnoticed. Baseline-aware alerting, alerting when current behavior deviates meaningfully from historical normal, produces fewer, more actionable notifications.
Key metrics for proactive database monitoring
Query latency
Query latency is the most direct measure of database performance. Track:
- Read latency — time for SELECT queries to return
- Write latency — time for INSERT, UPDATE, DELETE operations
- p95 and p99 latency — long-tail behavior that average latency hides
- Query duration by service or endpoint — which application paths drive the most latency
- Slow query trends — are slow queries becoming more frequent or slower over time?
Average query latency can look stable while p99 latency is spiking. For user experience, the tail matters more than the mean.
Throughput
Throughput measures the volume of work the database is handling:
- Queries per second — overall workload level
- Transactions per second — for transactional workloads
- Read/write ratio — is the workload shifting more write-heavy?
- Workload spikes — sudden throughput increases often precede resource saturation
Build throughput baselines from several weeks of data. Unusual spikes (a traffic surge, a batch job gone wrong, a misconfigured retry loop) become visible against the baseline before they cause saturation.
Connections and connection pool pressure
Connection exhaustion is one of the most common causes of sudden database unavailability:
- Active connections — how many connections are executing queries right now
- Idle connections — connections held open but not actively executing
- Rejected connections — connections refused because the pool is full
- Connection spikes — sudden increases that may indicate retry storms or application restarts
- Pool utilization — what percentage of the connection pool is in use
A connection count rising steadily toward the pool limit is a proactive signal. A connection count at 95% of the pool limit is an emergency.
Monitor your database with Parseable for free. Get started
Errors and failed queries
Errors expose problems that latency and throughput metrics may not reveal:
- Deadlocks — two transactions blocking each other, forcing one to abort
- Lock wait timeouts — queries waiting too long for a lock and giving up
- Failed transactions — rollbacks and transaction errors
- Replication errors — failures in primary-to-replica data propagation
- Timeout errors — queries that exceed execution time limits
- Permission errors — unexpected access failures that may indicate configuration drift
An error rate that looks small in absolute terms can be significant if it is concentrated in a critical query path. Track error rates by query type and database instance separately.
Resource saturation
Infrastructure-level signals matter alongside query-level signals:
- CPU utilization — sustained high CPU often indicates inefficient queries or workload growth
- Memory pressure — memory-constrained databases spill to disk, causing latency spikes
- Disk I/O — high I/O rates can indicate missing indexes, large scans, or compaction pressure
- Storage growth — rate of storage consumption over time, not just current usage
- Cache hit ratio — what percentage of reads are served from memory vs. disk
- Replication lag — how far behind replicas are from the primary
Performance slows significantly when resources approach saturation limits. Monitoring utilization trends helps teams act before saturation is reached.
Locking, waits, and contention
Lock contention and wait events are leading indicators of throughput degradation:
- Lock wait time — how long queries are waiting to acquire locks
- Deadlock frequency — deadlocks indicate transaction ordering problems
- Wait events — specific waits (I/O wait, lock wait, CPU wait) expose bottleneck type
- Blocking queries — long-running transactions that hold locks and block others
- Transaction duration — unusually long transactions increase contention window
A single long-running transaction holding a lock on a high-traffic table can cause dozens of downstream queries to queue. This type of signal is invisible in throughput and error metrics but visible in lock wait data.
Schema and configuration changes
Non-metric database events can have significant performance consequences:
- DDL events —
CREATE,ALTER,DROPoperations can break query plans or lock tables - Index changes — dropped or modified indexes cause query plan regressions
- Configuration parameter changes — memory, timeout, and connection limit changes affect behavior
Tracking when schema or configuration changes occur alongside performance metrics makes it easier to correlate a performance regression to a specific change.
Start observing your database with Parseable in minutes. Get started for free
Proactive database monitoring best practices
Establish performance baselines
Alerting is meaningless without a clear view of normal. Before setting thresholds, collect baseline measurements for CPU, I/O, throughput, query latency, and connection counts over a representative period — ideally several weeks, including peak and off-peak windows.
Baselines allow you to ask the right question: "Is this unusual compared to the normal pattern for this time of day and day of week?" rather than "Has an absolute number been exceeded?"
Track slow and expensive queries continuously
Slow queries are usually the proximate cause of user-facing database problems. Track:
- Longest-running queries — which individual queries take the most time
- Most frequent slow queries — high-frequency slow queries have disproportionate impact
- Full table scans — queries that scan entire tables because indexes are missing or unused
- High-CPU or high-memory queries — resource-heavy queries that constrain shared capacity
- Query plan stability — are existing queries using optimal execution plans, or have plans degraded?
Start with the most frequently executed queries. A query that runs a million times per day at 5ms each consumes more total database time than a query that runs once and takes 500ms.
Monitor availability and health separately
Availability — whether the database responds to a connection attempt — is a necessary but insufficient signal. A database can be available while:
- Serving queries at 10x normal latency
- Experiencing high deadlock rates
- Running with a degraded replica
- Approaching connection pool exhaustion
Database health monitoring requires tracking query-level and resource-level signals separately from availability checks.
Alert on trends, not only thresholds
Complement fixed-threshold alerts with trend-based alerts:
- p95 latency rising 30% above the baseline for the same time window yesterday
- Connection count increasing steadily for 20 minutes without a corresponding throughput increase
- Storage growing faster than the rolling 30-day average
- Error rate deviating more than 2 standard deviations from the hourly baseline
- Throughput dropping sharply without a known deployment or maintenance window
Trend alerts catch slow-moving degradation. Threshold alerts catch fast-moving failures. Both are needed.
Correlate database metrics with application telemetry
Database monitoring is most useful when query latency is connected to service latency, API error rates, distributed traces, and application logs. A p95 query latency spike that correlates with a p95 API latency spike confirms the database is the bottleneck. The same spike without a corresponding application impact may be noise.
An observability platform that stores logs, traces, and metrics together makes this correlation practical. See OpenTelemetry ingestion for how database telemetry can be routed through OpenTelemetry Collector into a unified backend.
Review and tune monitoring after incidents
Every database incident is an opportunity to improve monitoring coverage. After each significant event, ask:
- Was there a signal in the data before the incident that no alert caught?
- Did an alert fire too late or not at all?
- Did a threshold that seemed reasonable turn out to be wrong?
- What query, metric, or log pattern would have provided earlier warning?
Monitoring rules that are not reviewed after incidents grow stale. The goal is continuous improvement, not a one-time setup.
Where traditional database monitoring falls short
Static dashboards show symptoms, not causes
Dashboard panels showing CPU at 80% and p95 latency at 3 seconds confirm that something is wrong. They do not explain whether the cause is a new query pattern, a missing index, a lock contention event, a connection pool issue, or a hardware problem. Static dashboards show the effect; investigation tools find the cause.
Threshold alerts miss slow-moving degradation
A query that was 50ms in January and is 450ms in April may never trigger an alert if the threshold is set at 500ms. A connection count climbing from 50 to 190 out of a pool of 200 over three weeks may never trigger a single alert. Static thresholds are blind to gradual drift.
Query-level signals are disconnected from application telemetry
Most database monitoring tools track infrastructure metrics well. They rarely connect individual slow queries to the specific API endpoints, microservices, or user actions that triggered them. Without that connection, database investigations start over from scratch every time.
Alert fatigue makes teams ignore early warnings
When low-signal or noisy alerts fire constantly, teams learn to dismiss them. Important early warnings get lost in the noise. The consequence is that proactive monitoring becomes reactive in practice, because teams only investigate alerts that have already caused visible problems.
How Parseable supports proactive database monitoring
Unified database telemetry
Parseable stores database logs, metrics, query events, and application telemetry together in a single backend. Teams can bring in data from OpenTelemetry Collector alongside standard agents like FluentBit or Vector. Once ingested, Parseable stores the data efficiently — with up to 90% compression on S3 — while keeping it queryable at low latency.
For database observability use cases, this means query latency, connection metrics, error logs, and application traces land in the same system, making correlation queries straightforward.
SQL-based investigation
All telemetry in Parseable is queryable with standard SQL. For database monitoring investigations, this enables:
-- Slow queries by service in the last hour
SELECT service_name, query_text, avg(duration_ms) AS avg_ms,
       percentile_cont(0.99) WITHIN GROUP (ORDER BY duration_ms) AS p99_ms,
       count(*) AS executions
FROM db_query_events
WHERE p_timestamp >= now() - interval '1 hour'
GROUP BY service_name, query_text
ORDER BY p99_ms DESC
LIMIT 20;

-- Connection count trend over the last 30 minutes
SELECT date_trunc('minute', p_timestamp) AS minute,
       avg(active_connections) AS avg_connections,
       max(active_connections) AS peak_connections
FROM db_metrics
WHERE p_timestamp >= now() - interval '30 minutes'
GROUP BY 1
ORDER BY 1;

-- Error rate by database instance
SELECT db_instance, error_type, count(*) AS error_count
FROM db_error_logs
WHERE p_timestamp >= now() - interval '1 hour'
GROUP BY db_instance, error_type
ORDER BY error_count DESC;
See dashboarding tools for how these queries can be turned into live dashboard panels and alert rules.
Alerts and anomaly detection
Parseable's alerting layer supports both threshold-based and query-driven alerts. For proactive database alerting, teams can configure:
- Rising p95 latency deviation from the same window in prior periods
- Connection count exceeding a percentage of the pool limit
- Storage growth rate exceeding a rolling average
- Error rate deviation from the baseline
- Zero-throughput windows that may indicate a stopped replica
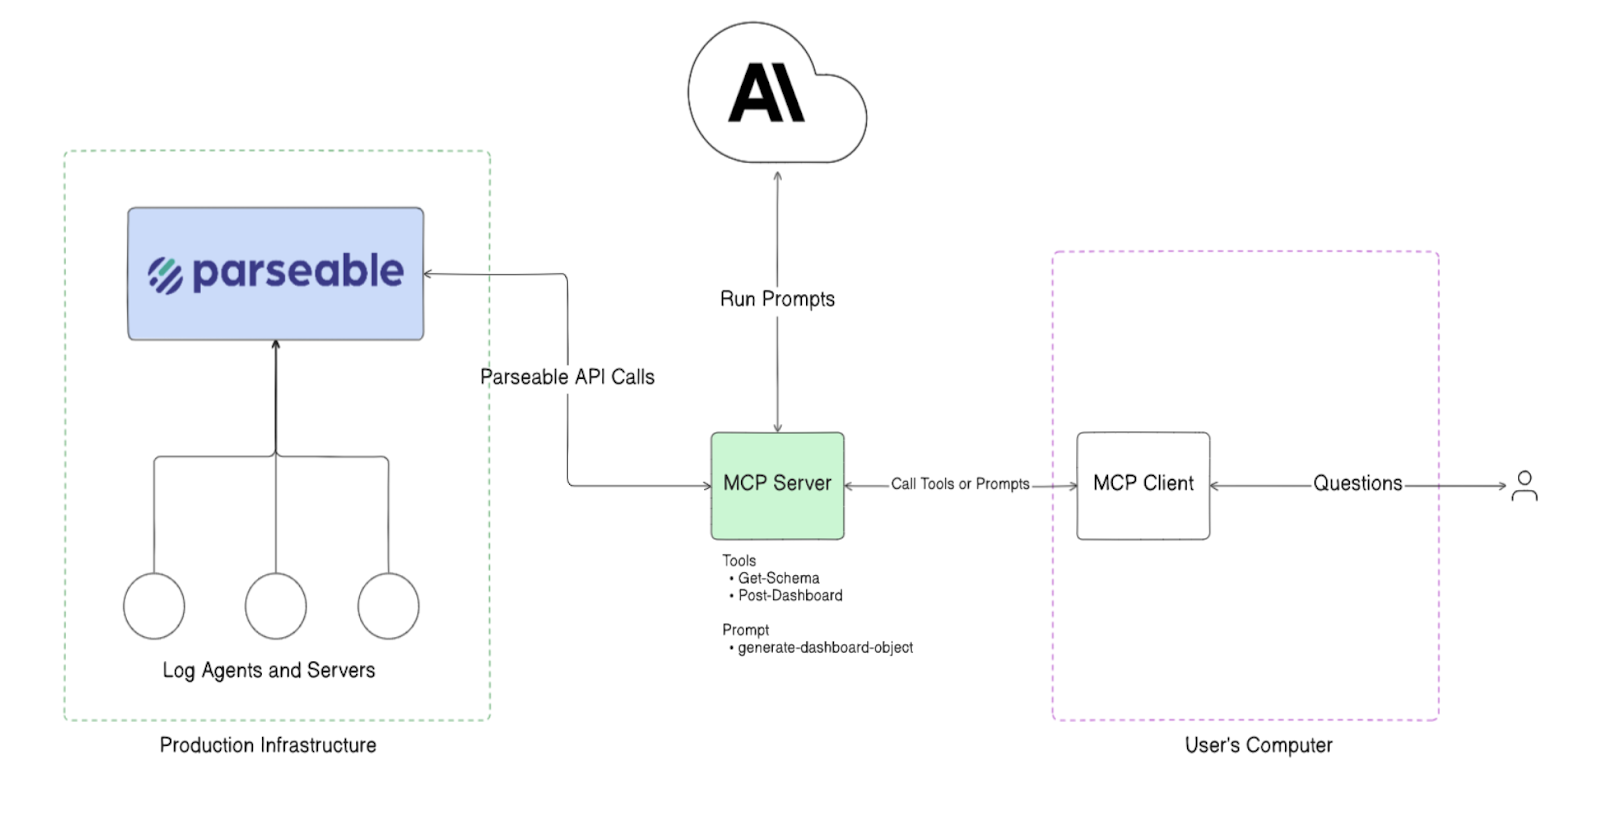
Agentic database monitoring with MCP
Parseable's agentic monitoring layer uses the Model Context Protocol (MCP) to establish intelligent, autonomous monitoring workflows that go beyond static dashboards and threshold alerts.
The agent acts as a persistent observer of database performance characteristics, active load, and behavior patterns — continuously monitoring real-time signals. Instead of waiting for a team member to notice a dashboard or an alert to fire, the MCP-based agent queries Parseable with a combination of pre-defined monitoring queries and dynamically generated queries based on what earlier results surface.

Rather than relying solely on threshold-based alerts — which produce false positives and miss slow-moving degradation — the MCP server processes incoming telemetry and detects subtle deviations indicative of emerging issues. By continuously analyzing structured telemetry, this approach enables earlier detection of performance degradation, reducing the window between a problem starting and a team acting.
What the agent monitors
The MCP agent watches the full set of signals that matter for database health:
- Query latency trends across read and write paths
- Transaction throughput and workload changes
- Connection count trajectory and pool pressure
- Resource saturation: CPU, memory, disk I/O, storage growth
- Error rates and anomalous query patterns
- Cache hit ratio changes
- Lock contention and wait event frequency
When a signal moves in the wrong direction, the agent surfaces the finding before an alert threshold is crossed.
Accelerated root cause analysis
Alongside proactive monitoring, Parseable's pb CLI includes autonomous root cause analysis that accelerates incident response when issues do occur:
- Automatically analyzes structured logs to pinpoint exact failure points
- Integrates with incident management tools (OpsGenie, PagerDuty, Rootly) to generate postmortem reports
- Provides mitigation steps based on identified root causes
- Generates stakeholder-ready incident summaries
Example: detecting database issues before they become incidents
Scenario 1: query latency starts rising
A background deployment adds a new query that lacks an appropriate index. The query runs correctly but takes 30× longer than similar queries. Because it runs infrequently at first, average latency barely moves.
Proactive monitoring surfaces this through:
- p99 latency for the affected service beginning to rise
- The specific slow query appearing in the top-10 by duration
- The Parseable agent flagging that a query pattern not seen in the last 7 days is now running regularly and consuming disproportionate resources
The team catches it before p95 latency rises enough to affect the application SLO.
Scenario 2: connection spikes before saturation
An application rollout introduces a connection leak — connections are opened but not reliably closed. Active connections begin climbing steadily. Pool utilization moves from 40% to 70% to 85% over 45 minutes.
Proactive monitoring surfaces this through:
- Connection count trend alerting (growing steadily without a corresponding throughput increase)
- The Parseable agent noticing that idle connections are accumulating faster than they are being released
- A dashboard panel showing the trajectory toward pool exhaustion
The team investigates and patches the leak before the pool fills and connections start being rejected.
Scenario 3: slow storage growth becomes a capacity event
A logging table that was never pruned has been growing for eight months. Storage consumption has been increasing by 4% per week. Today it crosses 80% of available disk.
Proactive monitoring surfaces this through:
- A storage growth rate alert configured against the rolling 30-day average
- A capacity planning query showing time-to-full at the current growth rate
- An agent-generated observation that the storage growth rate has been accelerating over the last 30 days
The team adds a retention policy before reaching the capacity limit that would trigger a write-failure incident.
Proactive database monitoring checklist
Use this as a setup audit for any database environment:
- Monitor database availability and database health as separate signals
- Track p95 and p99 query latency, not just average latency
- Monitor query throughput and build weekly baselines
- Track active connection count and pool utilization continuously
- Monitor deadlocks, lock waits, and blocking query frequency
- Set up slow query logging and review top slow queries weekly
- Track disk I/O, CPU, memory, and storage growth rate
- Monitor cache hit ratio and flag significant drops
- Monitor replication lag on read replicas
- Build performance baselines for each environment and time-of-week pattern
- Alert on trend deviations, not only static threshold breaches
- Correlate database telemetry with application logs and traces
- Track DDL and configuration changes alongside performance metrics
- Review and update alert rules after every significant incident
- Use agentic or automated workflows to surface early warnings without manual triage
Common mistakes in proactive database monitoring
Monitoring only CPU and memory
Server-level metrics confirm that infrastructure is stressed. They rarely explain why. A database running at 30% CPU can still have one blocking query serializing 200 requests. Missing query-level visibility means finding the cause of user-facing issues takes longer.
Alerting only after thresholds are crossed
Fixed thresholds catch acute failures. They miss gradual drift. A query that was 80ms and is now 380ms may never trigger a 500ms threshold alert — but users experience a 4× slowdown. Trend-based detection catches degradation that static thresholds miss.
Ignoring slow queries until users complain
Slow queries are predictable. They do not usually appear suddenly — they appear after a deployment, a data volume change, or an index change. Continuous slow query monitoring means teams find them before users do.
Keeping database telemetry separate from application telemetry
Database investigations that start with infrastructure metrics and have no path to application traces, service logs, or request context force teams to manually connect signals. A unified observability platform that stores all signals together makes root cause analysis faster.
Not revisiting alert rules after incidents
Alert rules written once and never reviewed become stale. After every significant database incident, check whether the monitoring and alerting configuration would have provided earlier warning, and update it if not.
Treating dashboards as a substitute for automated detection
Dashboards require someone to be watching them at the right time. Proactive monitoring requires detection that works continuously, without human attention. Automated alerts and agentic workflows fill the gap between dashboard checks.
Conclusion
Database problems are rarely instantaneous. They build — in query plans, in connection pools, in cache behavior, in storage growth, in lock contention — until something fails visibly. Proactive database monitoring means building the detection layer that catches those signals in the early stages, not the late ones.
The foundation is metric coverage: query latency, throughput, connections, errors, resource saturation, locking, and slow queries. On top of that, baselines and trend-aware alerting catch gradual degradation that fixed thresholds miss. Correlating database signals with application telemetry makes root cause analysis faster. And automated or agentic monitoring workflows — like those Parseable provides through its MCP-based agent — surface early warnings without requiring continuous human attention.
The goal is not to prevent every database incident. It is to reduce the gap between a problem starting and a team acting on it, while it is still small.
Try Parseable Pro free for 14 days and see how unified database telemetry, SQL-based investigation, and agentic monitoring workflows change how early your team detects database issues. See Parseable pricing for details.

