

PostgreSQL generates a continuous stream of logs and metrics that describe exactly how your database is performing — slow queries, connection pressure, lock waits, checkpoint activity, errors, and more. The problem is not that the signals do not exist. It is that without a centralized pipeline, they stay scattered across the database node, inaccessible for cross-service analysis or long-term trending.
This guide builds a complete PostgreSQL observability pipeline on Kubernetes. Fluent Bit collects and parses PostgreSQL logs. PostgreSQL Prometheus exporter exposes database metrics. OpenTelemetry Collector scrapes and forwards those metrics to Parseable. Parseable stores everything in one place for SQL queries, dashboards, and alerts.
What you'll build
Two parallel pipelines feed a single Parseable backend:
PostgreSQL (structured logs)
  → Fluent Bit
  → Parseable  [postgres-logs stream]

PostgreSQL Prometheus exporter (:9187/metrics)
  → OpenTelemetry Collector (Prometheus receiver)
  → Parseable  [pg-metrics stream]
By the end of this guide:
- PostgreSQL is running on Kubernetes with structured log output enabled
- Fluent Bit is tailing and parsing PostgreSQL logs into Parseable
- PostgreSQL Prometheus exporter is exposing database metrics on port
9187 - OpenTelemetry Collector is scraping those metrics every 10 seconds and forwarding them to Parseable
- Both the
postgres-logsandpg-metricsstreams are queryable in the Parseable console
Architecture overview: PostgreSQL observability pipeline
Logs pipeline
PostgreSQL writes structured logs to stderr (stdout in containers). Fluent Bit tails the container log output, applies a regex parser to extract fields like severity, PID, user, database, and statement, and ships parsed log records to Parseable via the Parseable output plugin.
Metrics pipeline
PostgreSQL Prometheus exporter connects to the PostgreSQL database, collects internal statistics from pg_stat_* views, and exposes them as Prometheus-format metrics on :9187/metrics. OpenTelemetry Collector uses its Prometheus receiver to scrape that endpoint and its otlphttp exporter to forward metrics to Parseable.
Parseable as the observability backend
Parseable stores both streams on object storage using Apache Parquet for efficient compression and column-oriented querying. From the Parseable console, teams can write SQL across both streams, build dashboards from query results, and configure alerts on PostgreSQL health signals. For teams evaluating collection approaches, see OpenTelemetry Collector vs Fluent Bit, this guide uses both because they serve different signal types.
Understanding the components
PostgreSQL
One of the most widely deployed OLTP databases. PostgreSQL generates both structured logs and internal statistics through pg_stat_* system views. Monitoring both is necessary for proactive database monitoring — logs capture what happened, metrics capture how the system is performing over time.
Fluent Bit
A lightweight, open-source log collection agent. In this setup, Fluent Bit tails PostgreSQL's container log output, applies a regex parser to extract structured fields, and forwards parsed log records to Parseable through the Parseable output plugin. For more context on centralized log collection, see log aggregation tools. Fluent Bit's official Parseable integration uses X-P-Stream and X-P-Log-Source headers to route telemetry into named streams.
OpenTelemetry Collector
A vendor-neutral telemetry collection agent. In this setup, it uses the Prometheus receiver to scrape PostgreSQL exporter metrics and the otlphttp exporter to send them to Parseable. OpenTelemetry ingestion in Parseable accepts OTLP-formatted metrics through the same endpoint and stream-header pattern used for logs and traces.
Parseable
An open-source observability platform built in Rust. Parseable uses Apache Arrow and Parquet for efficient data storage and stores data in object storage with a hot-tier cache in distributed mode. It offers direct SQL querying on both hot and cold storage tiers, supports dashboarding tools for visualization, and can alert on query-defined conditions. For pricing and retention considerations as telemetry volume grows, see Parseable pricing.
PostgreSQL signals to collect
Before setup, it helps to know what signals matter most. This shapes how you configure logging verbosity and which metrics to watch after the pipeline is running.
Query performance signals
- Slow query duration and frequency
- Full table scan count
- Index hit rate vs sequential scan rate
- Lock wait time and deadlock count
- Query error rate and types
Resource utilization signals
- Active and idle connection count
- CPU and memory utilization
- Disk I/O read/write rates
- Table and index size over time
- Buffer cache hit ratio
- Temporary file usage (spills)
Database health signals
- Transaction commit and rollback rates
- Replication lag on standby replicas
- Checkpoint frequency and write duration
- Autovacuum runs and dead row counts
- Connection rejection rate
- WAL generation rate
These signal categories map to what PostgreSQL logs (query statements, errors, lock waits, connections, checkpoints) and what PostgreSQL exporter exposes from pg_stat_* views. The pipeline built in this guide collects both.
Prerequisites
- Kubernetes cluster with
kubectlconfigured - Helm 3
- AWS S3 bucket (or compatible object storage) with access credentials — used for Parseable distributed mode
- PostgreSQL Helm chart (Bitnami) access
- PostgreSQL Prometheus exporter Helm chart (Prometheus Community) access
- OpenTelemetry Collector Helm chart access
- Parseable Helm chart access
- Access to create Kubernetes namespaces, secrets, and config maps
If you are using a managed Kubernetes service (EKS, GKE, DigitalOcean, etc.), make sure the default storage class matches your cluster's provisioner before running the Parseable Helm install.
Step 1: Install PostgreSQL on Kubernetes
Use the Bitnami PostgreSQL Helm chart with a values override that enables structured logging.
Configure PostgreSQL structured logging
Create a values.yaml override file. The configuration below disables the logging collector (so PostgreSQL writes directly to stderr, which Fluent Bit can tail), enables useful log prefixes, and turns on logging for statements, durations, connections, disconnections, checkpoints, and lock waits.
primary:
  configuration: |-
    # listen address
    listen_addresses = '*'

    # Enable logging to stdout
    logging_collector = off               # Write to stderr (stdout in containers)
    log_destination = 'stderr'

    # Log format and verbosity
    log_line_prefix = '%m [%p] %q%u@%d '  # Timestamp, PID, user, database
    log_min_messages = info
    log_min_error_statement = error

    # Additional log settings
    log_statement = 'all'                 # Log all SQL statements
    log_duration = on                     # Log query execution time
    log_checkpoints = on
    log_connections = on
    log_disconnections = on
    log_lock_waits = on
    log_statement_stats = off
Note on
log_statement = 'all': This logs every SQL statement and is useful for development and initial observability setup. In high-throughput production environments, consider'ddl'or'mod'to reduce log volume and I/O overhead. See logging best practices for guidance on balancing visibility and log noise.
Install PostgreSQL
helm repo add bitnami https://charts.bitnami.com/bitnami
helm repo update
helm upgrade --install postgres bitnami/postgresql -f values.yaml
Verify PostgreSQL is running
kubectl get pods
# Expected: postgres-postgresql-0   Running
kubectl logs postgres-postgresql-0 | head -20
# Expected: structured log lines with timestamp, PID, user@database prefix
Step 2: Install Parseable with Fluent Bit
The Parseable Helm chart includes Fluent Bit as part of the install. Fluent Bit is configured via a Kubernetes secret, which Parseable mounts during startup.
Create the configuration secret
cat << EOF > parseable-env-secret
s3.url=https://s3.${REGION}.amazonaws.com
s3.access.key=${ACCESS_KEY}
s3.secret.key=${SECRET_KEY}
s3.region=${REGION}
s3.bucket=${BUCKET_NAME}
addr=0.0.0.0:8000
staging.dir=./staging
fs.dir=./data
username=admin
password=admin
EOF
Production note: The default
admin/admincredentials are for initial setup only. Rotate them before any shared or external access. Use Kubernetes secrets for all sensitive values rather than embedding them in plain files.
Create the secret in Kubernetes:
kubectl create ns parseable
kubectl create secret generic parseable-env-secret --from-env-file=parseable-env-secret -n parseable
Install Parseable
Confirm your storage class matches your cluster's provisioner before running this command.
helm repo add parseable https://charts.parseable.com
wget https://gist.githubusercontent.com/AdheipSingh/b266f9d96e7b42b1e27bca70e636c0e6/raw -O parseable-values.yaml
helm upgrade --install parseable parseable/parseable -n parseable -f parseable-values.yaml
Verify Fluent Bit is forwarding PostgreSQL logs
Port-forward the Parseable query service to access the console:
kubectl port-forward svc/parseable-query-service 8000:80 -n parseableOpen the Parseable console at http://localhost:8000. You should see a stream called postgres-logs already created, populated with parsed PostgreSQL log entries.
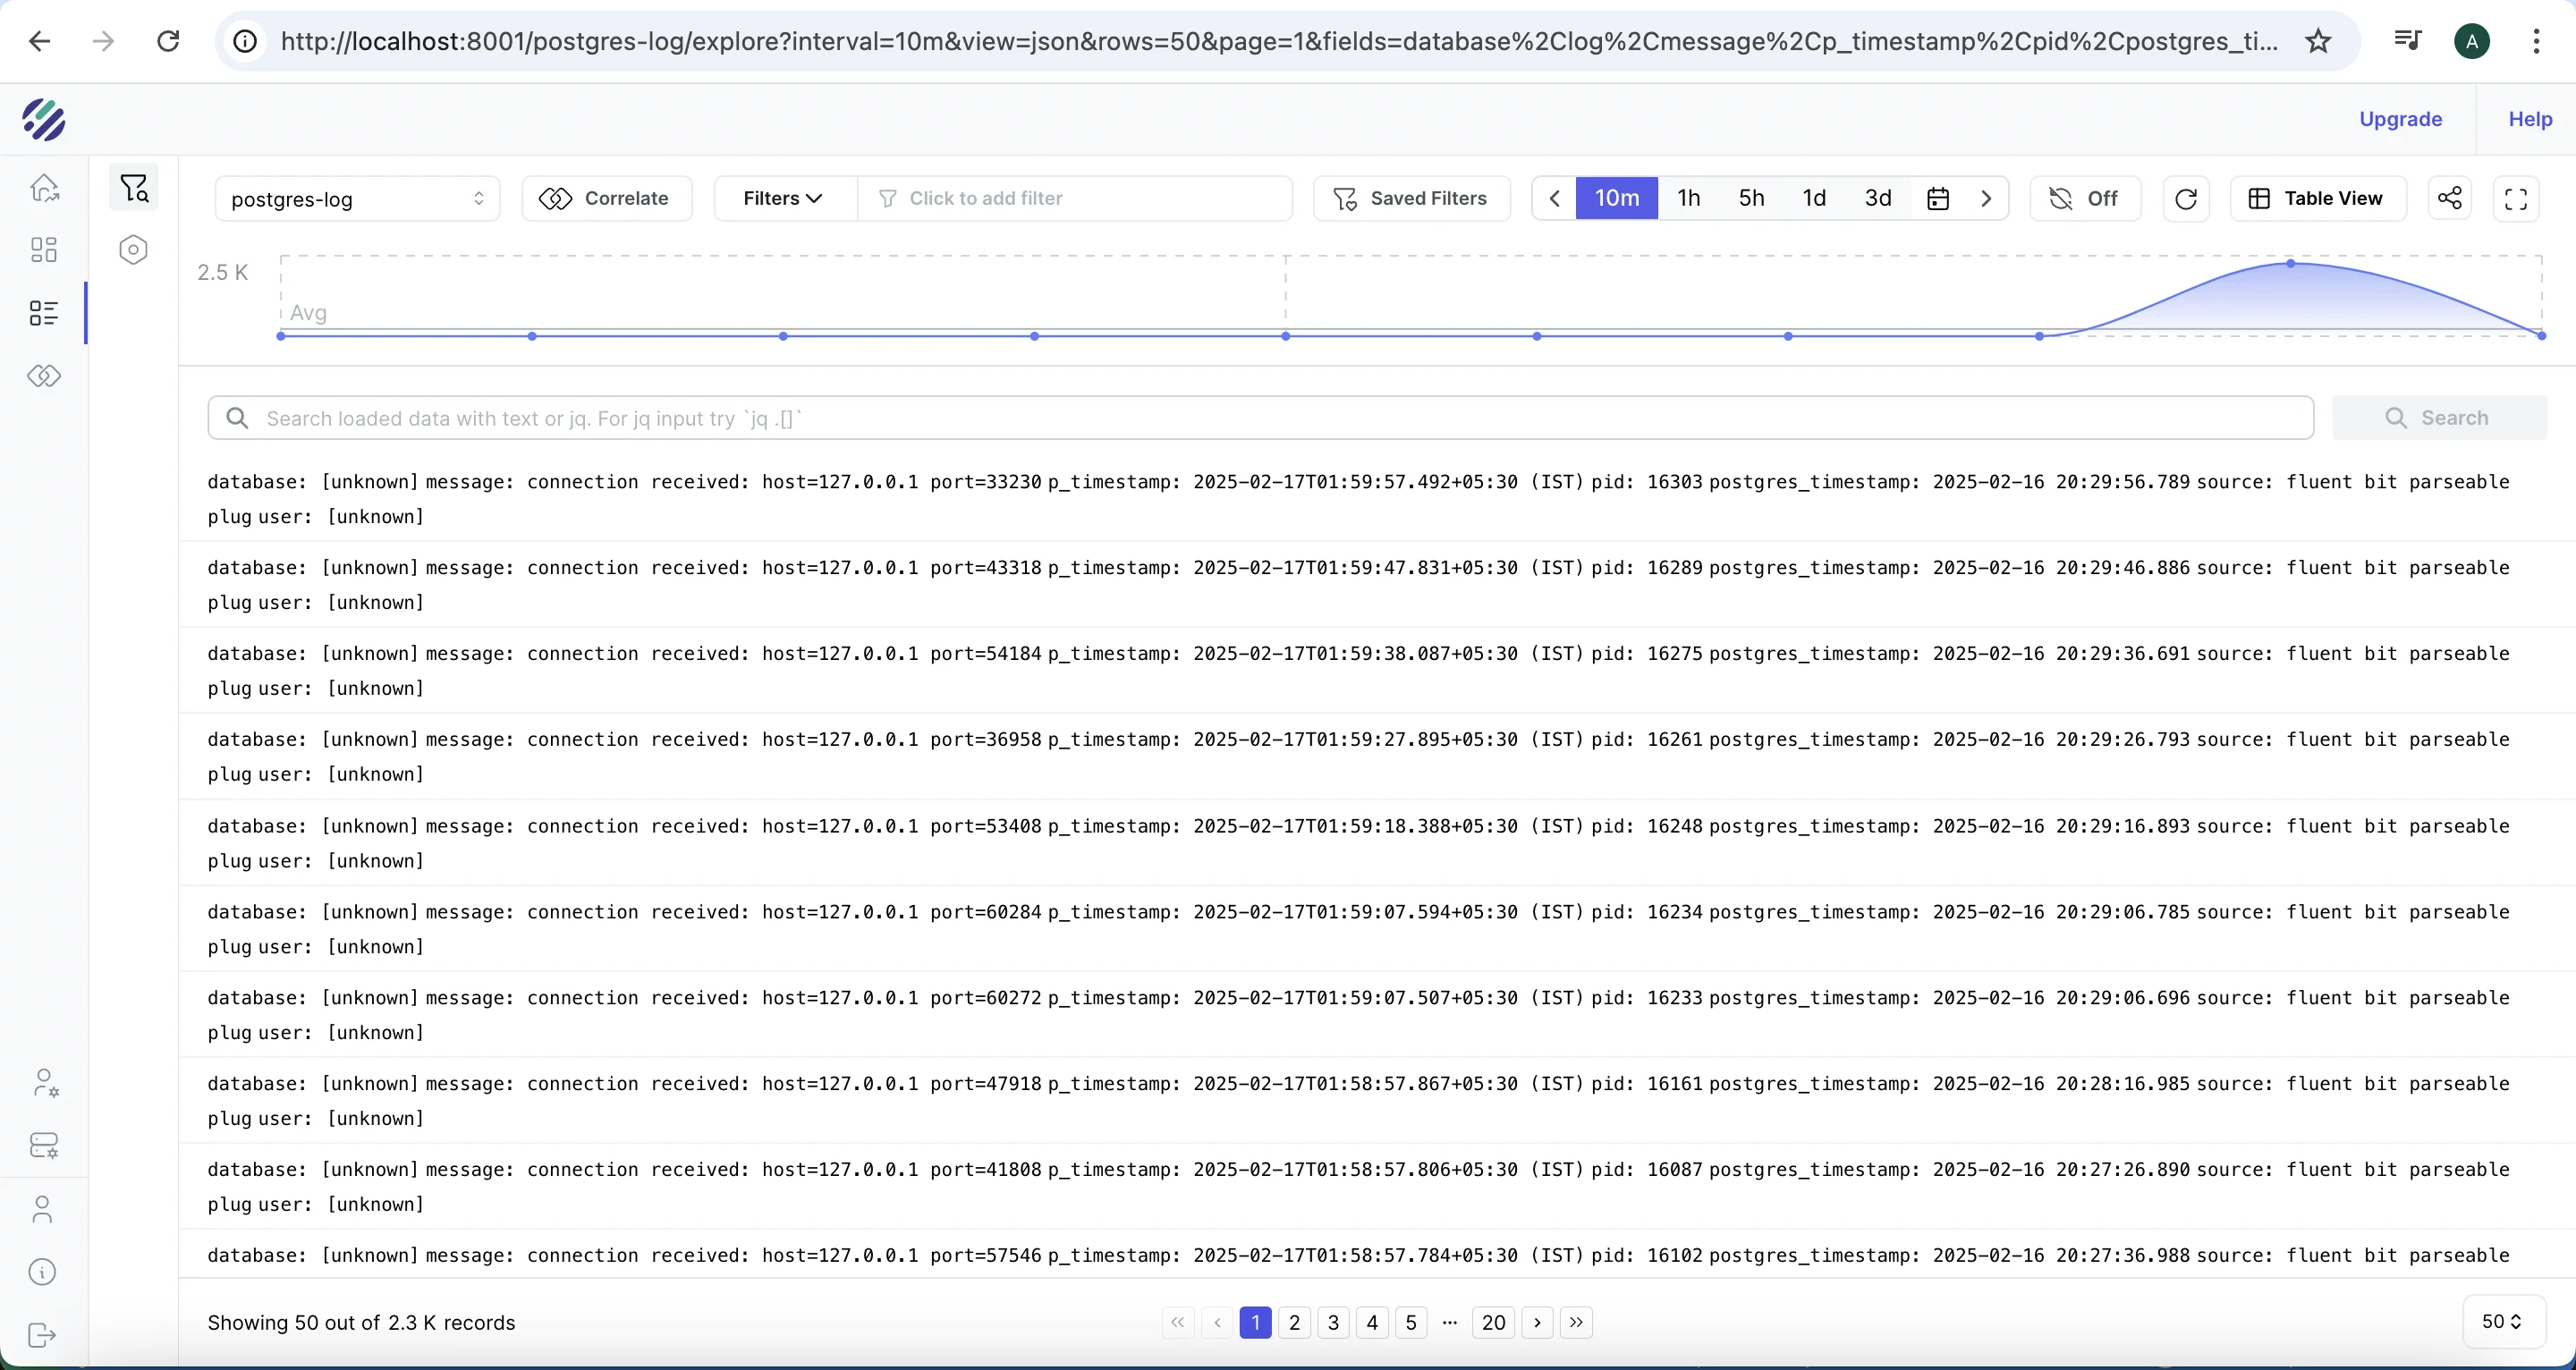
Run a quick verification query in the Parseable console:
SELECT p_timestamp, severity, user_name, database_name, statement
FROM "postgres-logs"
ORDER BY p_timestamp DESC
LIMIT 10
If you see structured rows with timestamps, usernames, and statement fields, Fluent Bit is correctly parsing and forwarding logs. If the stream is empty, see the troubleshooting section below.
Step 3: Install PostgreSQL Prometheus exporter
PostgreSQL exporter connects to the database and exposes internal statistics from pg_stat_* views as Prometheus-format metrics on port 9187.
Create the exporter values file
# postgres-values.yaml
config:
  datasource:
    host: "postgresql.default.svc.cluster.local"
    port: "5432"
    database: "postgres"
    user: "postgres_exporter"
    password: "your-password"
    sslmode: "disable"
Security note: Use a least-privilege PostgreSQL user for the exporter — grant only
SELECTonpg_stat_*views andpg_catalog. Do not use the superuser account. Store the password in a Kubernetes secret rather than in plain YAML when deploying to shared environments.
Install the exporter
helm repo add prometheus-community https://prometheus-community.github.io/helm-charts
helm repo update prometheus-community
helm upgrade --install postgres-exporter prometheus-community/prometheus-postgres-exporter -f postgres-values.yaml
Verify the exporter is exposing metrics
kubectl get pods
# Expected: postgres-exporter-... Running

# Port-forward to check the metrics endpoint
kubectl port-forward svc/postgres-exporter-prometheus-postgres-exporter 9187:80

curl http://localhost:9187/metrics | grep pg_stat_database
# Expected: lines like pg_stat_database_numbackends{datname="postgres",...} 3
If the metrics endpoint returns an empty response or connection errors, confirm the host and user values in postgres-values.yaml match the running PostgreSQL service.
Step 4: Configure OpenTelemetry Collector for PostgreSQL metrics
The OpenTelemetry Collector scrapes the PostgreSQL exporter every 10 seconds and exports metrics to Parseable's pg-metrics stream via OTLP HTTP.
Create the Collector values file
# otel-values.yaml
mode: deployment

image:
  repository: otel/opentelemetry-collector-k8s

replicaCount: 1

config:
  extensions:
    health_check: {}
    basicauth/otlp:
      client_auth:
        username: admin
        password: admin

  receivers:
    prometheus:
      config:
        scrape_configs:
          - job_name: 'postgres'
            scrape_interval: 10s
            metrics_path: "/metrics"
            static_configs:
              - targets:
                - 'postgres-exporter.default.svc.cluster.local:9187'
    otlp:
      protocols:
        http:
          endpoint: 0.0.0.0:4318

  exporters:
    debug: {}
    otlphttp/parseablemetrics:
      auth:
        authenticator: basicauth/otlp
      headers:
        X-P-Log-Source: otel-metrics
        X-P-Stream: pg-metrics
        Content-Type: application/json
      encoding: json
      tls:
        insecure: true
      endpoint: http://parseable-ingestor-service.parseable.svc.cluster.local:80

  processors:
    batch:
      send_batch_max_size: 100
      send_batch_size: 10

  service:
    extensions:
      - basicauth/otlp
      - health_check
    pipelines:
      metrics:
        receivers:
          - prometheus
        processors:
          - batch
        exporters:
          - otlphttp/parseablemetrics
Deploy the Collector
helm repo add open-telemetry https://open-telemetry.github.io/opentelemetry-helm-charts
helm upgrade --install my-opentelemetry-collector open-telemetry/opentelemetry-collector -f otel-values.yaml
Verify metrics are flowing to Parseable
Check the Collector pod logs for scrape and export activity:
kubectl logs -l app.kubernetes.io/name=opentelemetry-collector --tail=50
# Expected: lines showing metrics received from prometheus receiver and exported via otlphttp
Open the Parseable console and confirm the pg-metrics stream has been created and is receiving data:
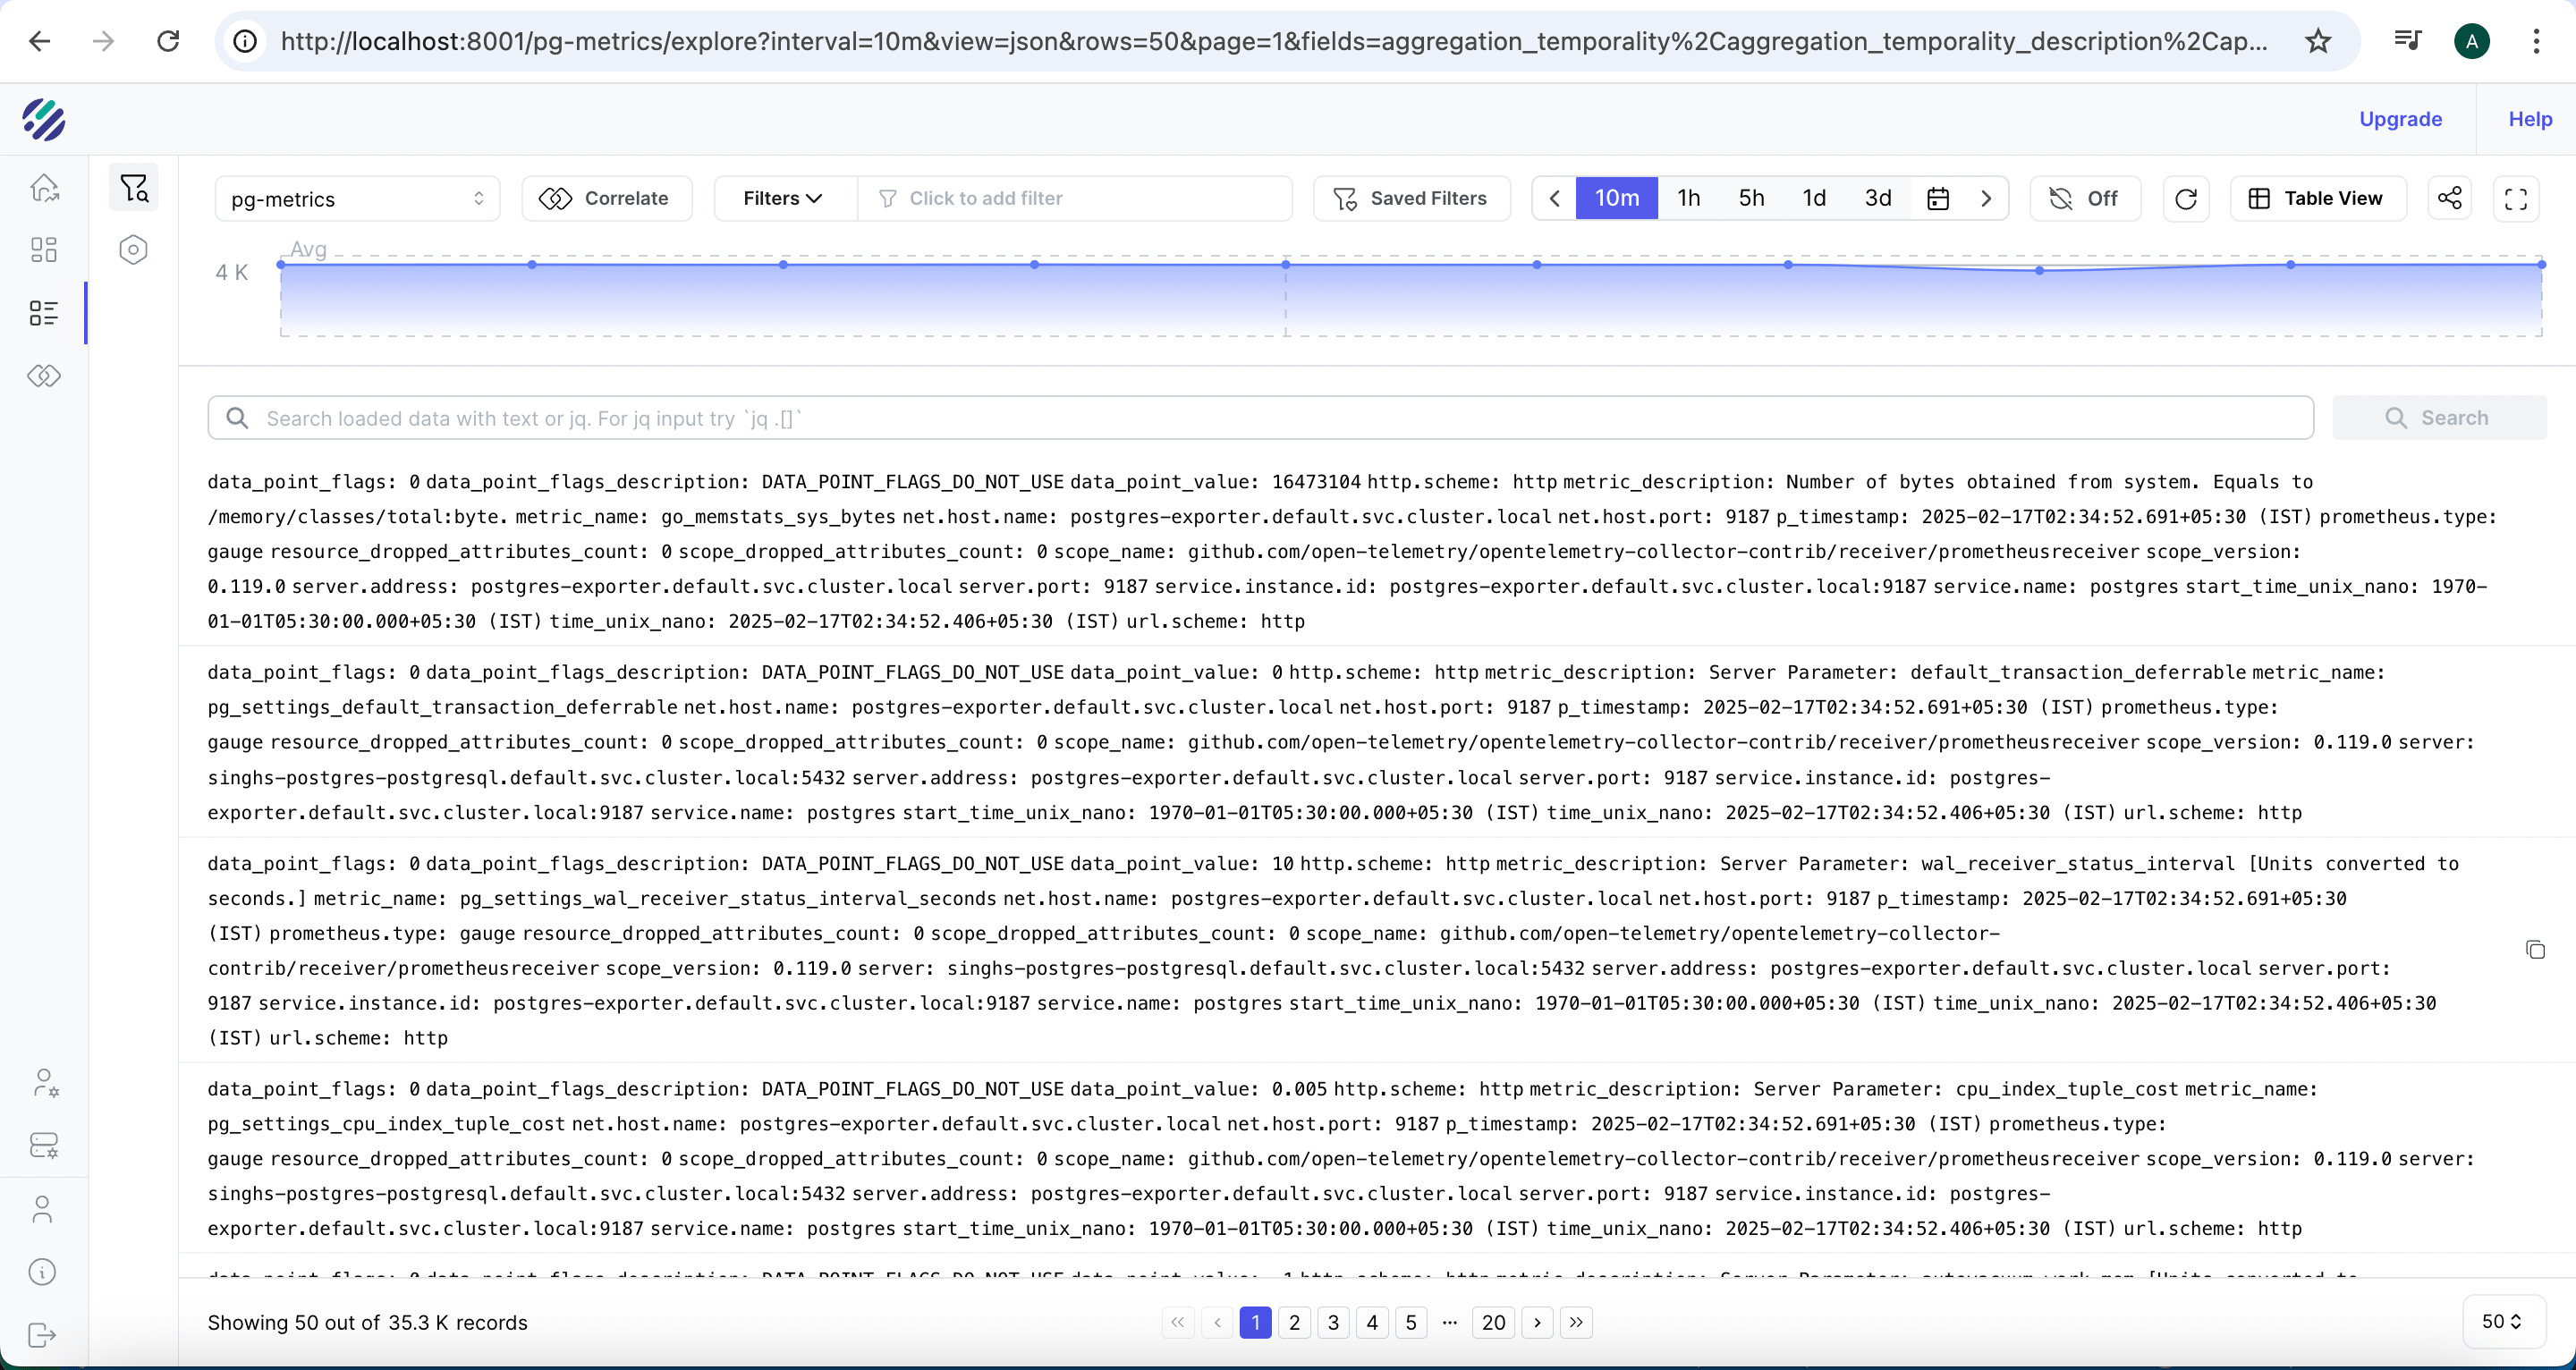
Run a verification query:
SELECT p_timestamp, name, value
FROM "pg-metrics"
ORDER BY p_timestamp DESC
LIMIT 10
You should see metric rows with names like pg_stat_database_numbackends, pg_stat_bgwriter_checkpoints_timed, and pg_stat_database_xact_commit. If the stream is empty, check Collector logs for export errors.
Step 5: Generate test data and analyze PostgreSQL logs
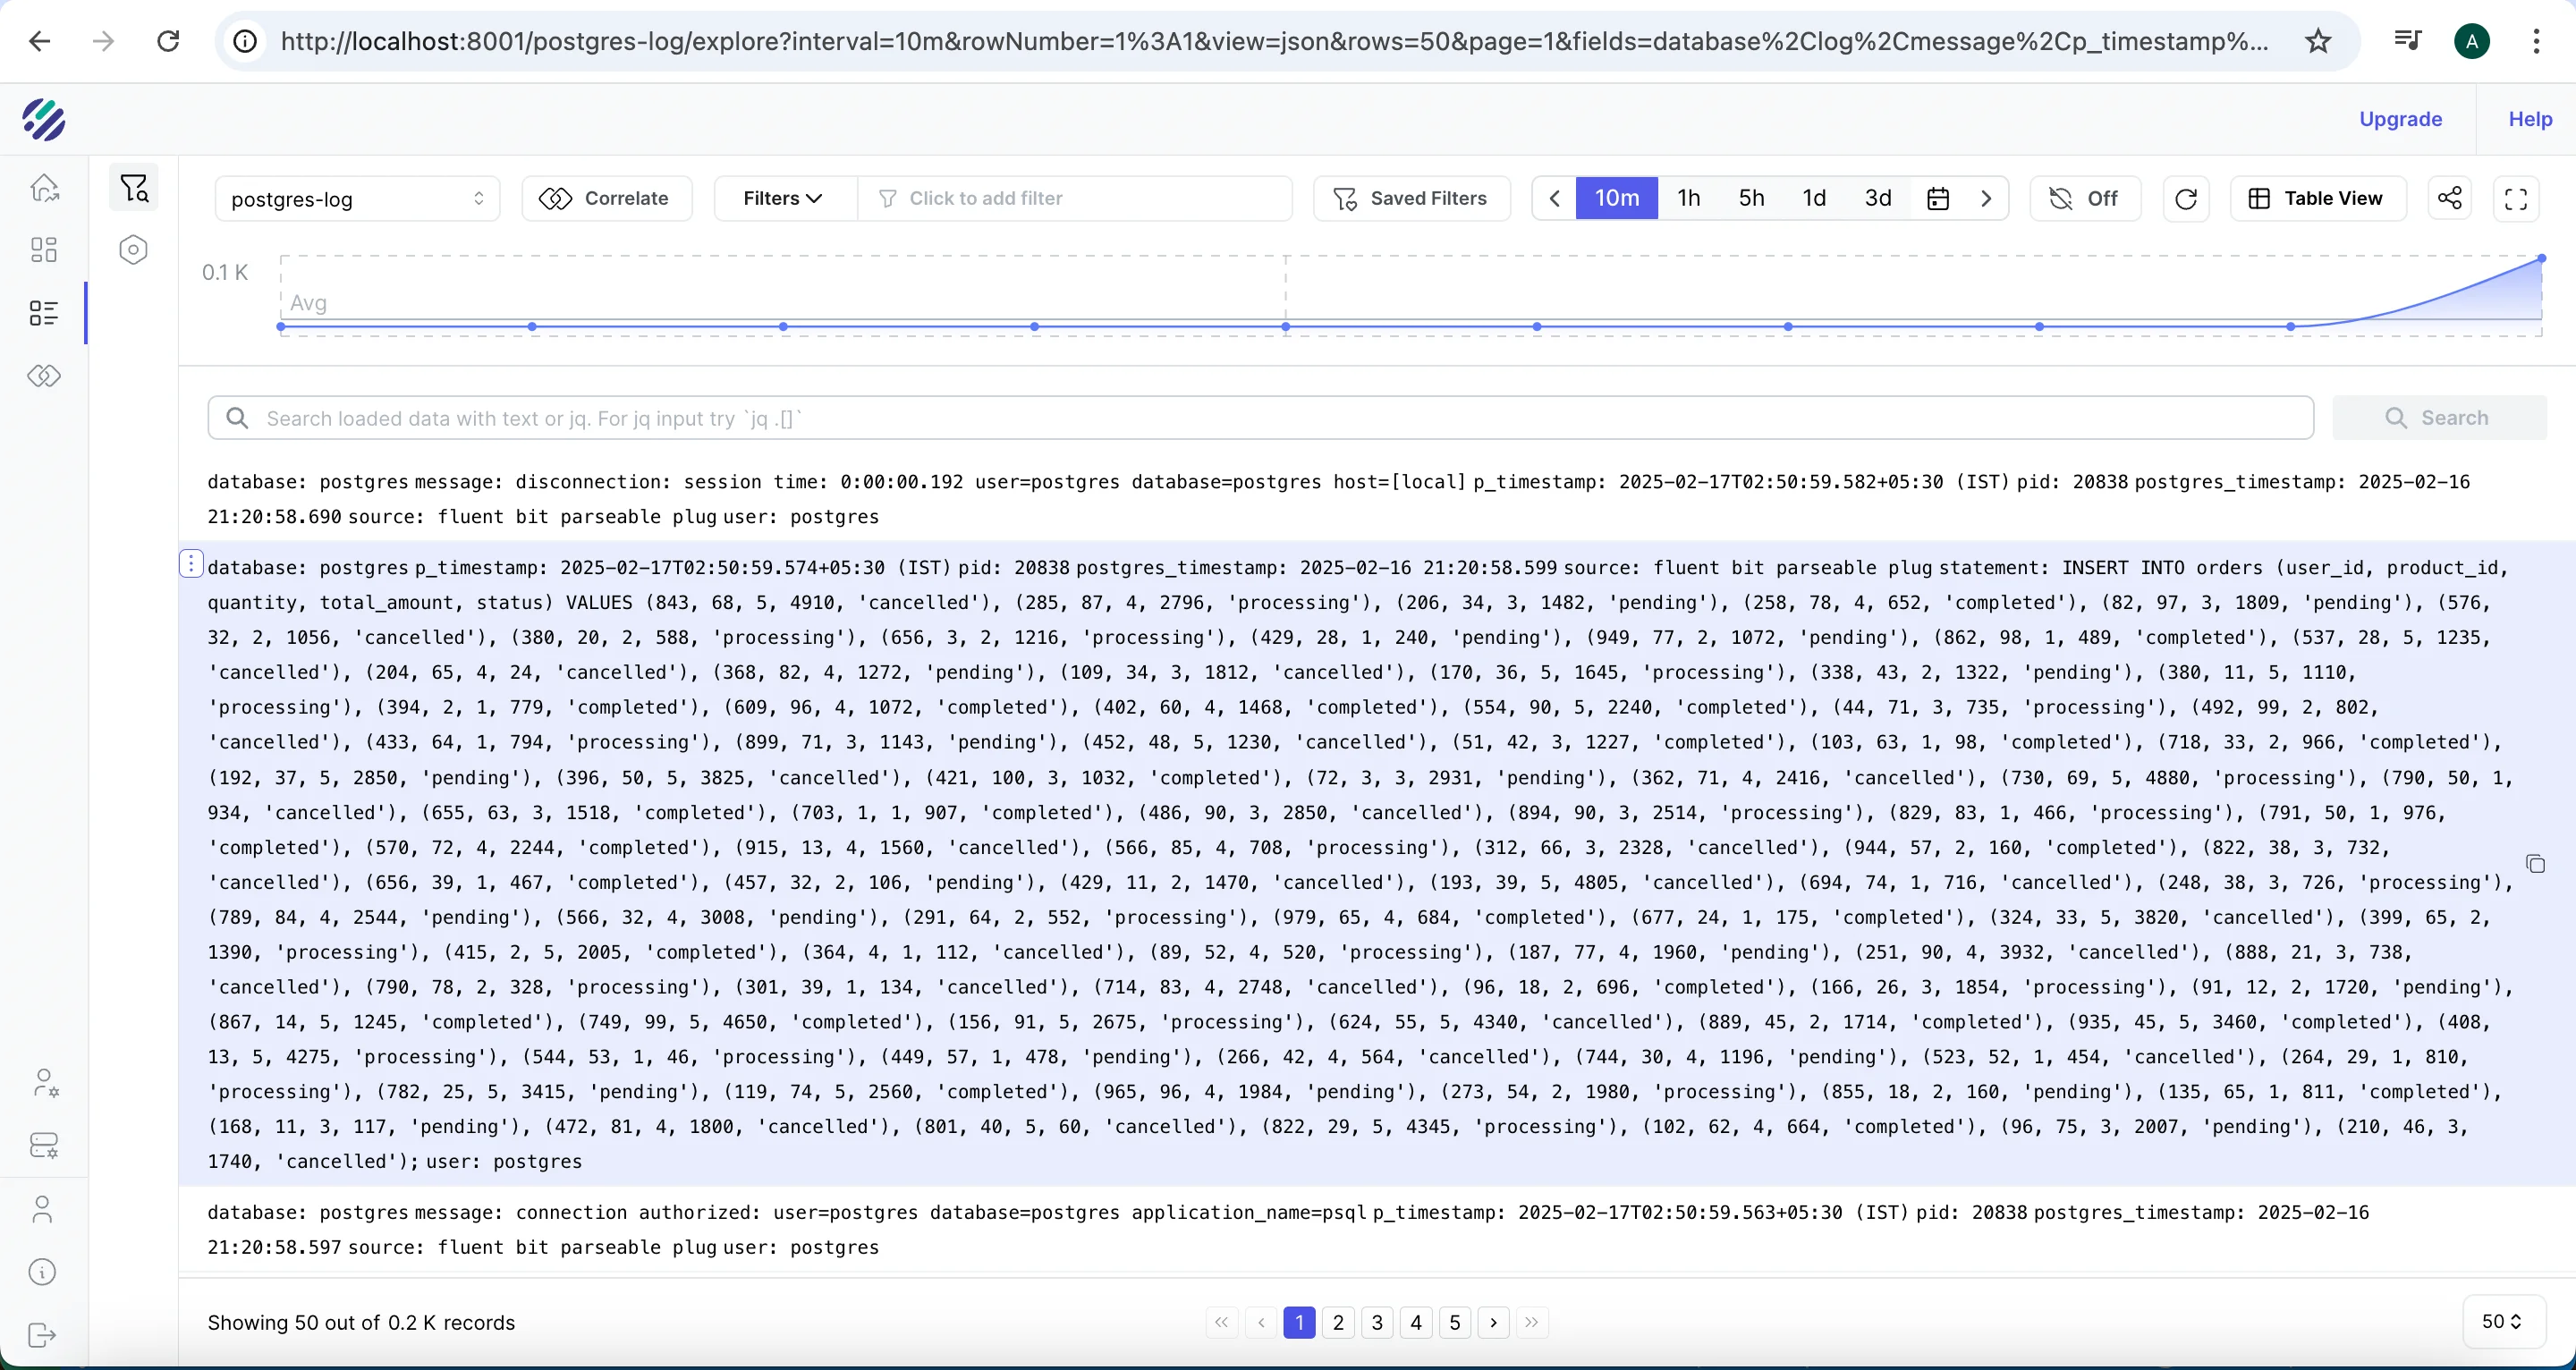
At this point both pipelines are running. Generate some database activity to confirm end-to-end flow:
wget https://gist.githubusercontent.com/AdheipSingh/db17c6c9affef7556a56523e780459c6/raw/d913245b4234f01a2f76a2ef4ac9274e003fec20 -O write-postgres.sh
chmod +x write-postgres.sh
./write-postgres.sh
After a minute or two, the Parseable console should show an ingestion spike in the postgres-logs stream as INSERT statements arrive:
Step 6: Analyze PostgreSQL logs in Parseable
Select SQL from the query mode dropdown in the Parseable console. Before running the queries below, inspect the stream schema first to confirm field names match your parser output:
SELECT * FROM "postgres-logs" LIMIT 3Use the returned column names in all subsequent queries.
Find all INSERT statements
SELECT * FROM "postgres-logs"
WHERE statement LIKE '%INSERT%'
LIMIT 1000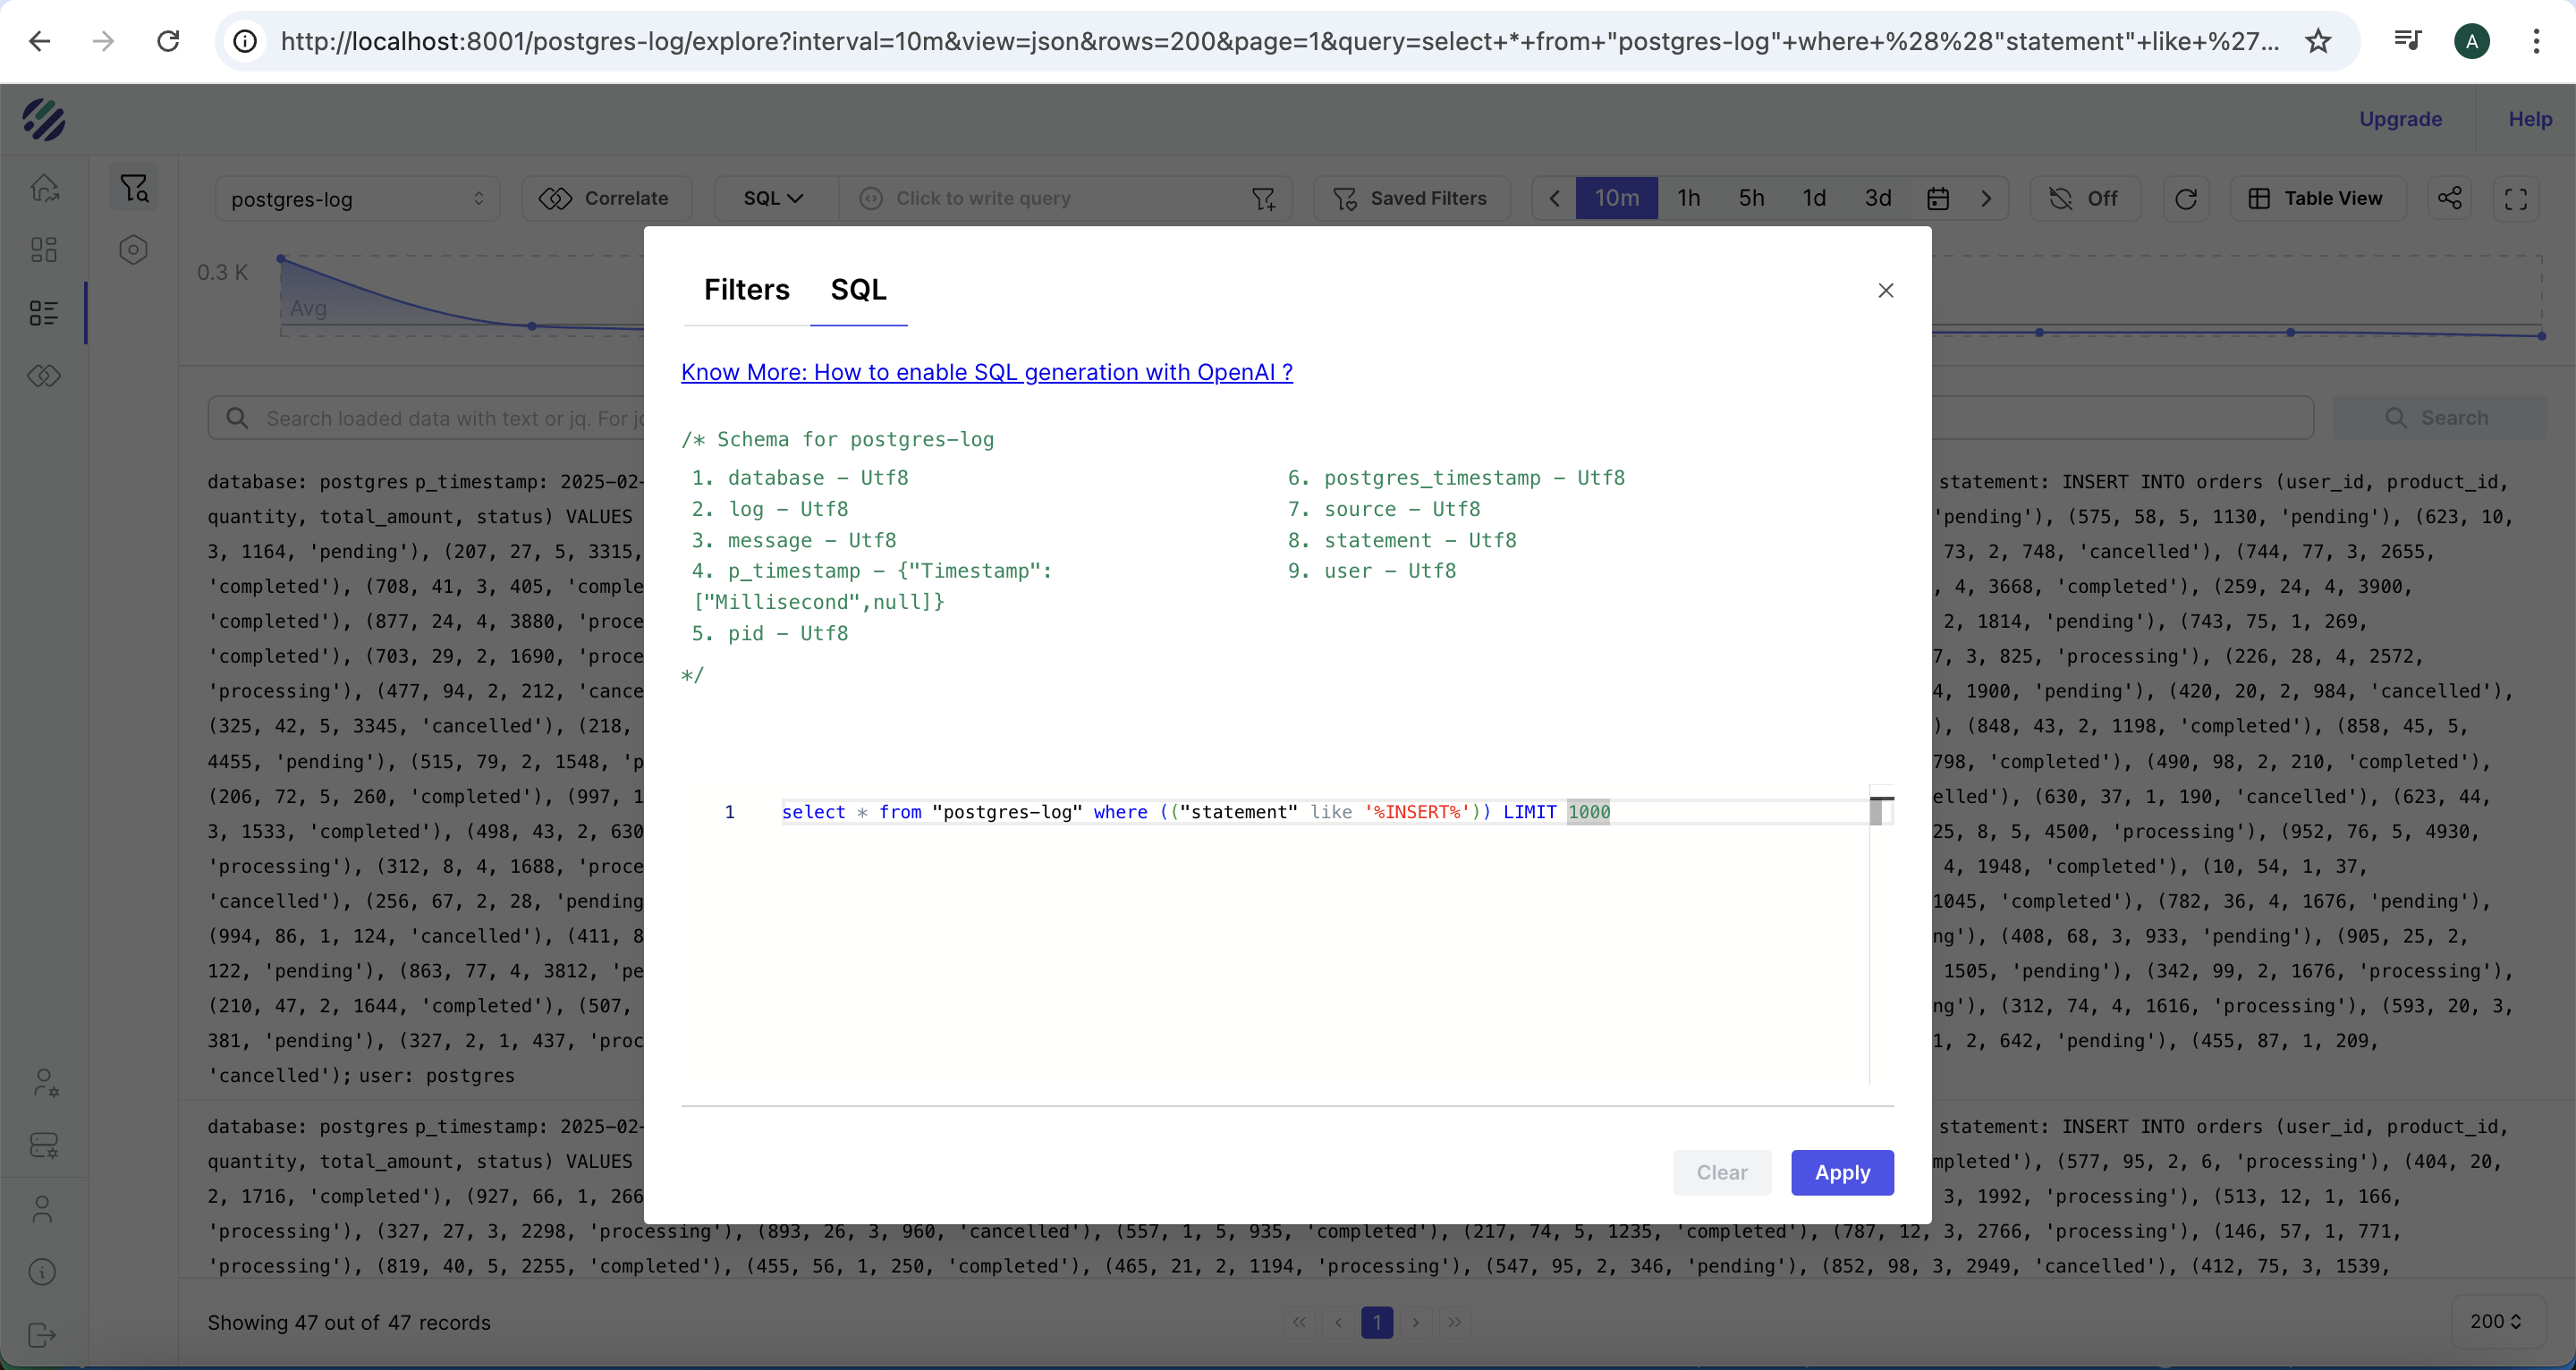
Find PostgreSQL errors
SELECT p_timestamp, severity, user_name, database_name, statement, message
FROM "postgres-logs"
WHERE severity IN ('ERROR', 'FATAL', 'PANIC')
  AND p_timestamp >= now() - interval '1 hour'
ORDER BY p_timestamp DESC
Find slow queries
PostgreSQL logs query duration when log_duration = on. Look for log lines where duration appears in the statement field:
SELECT p_timestamp, user_name, database_name, statement, duration_ms
FROM "postgres-logs"
WHERE duration_ms IS NOT NULL
  AND duration_ms > 100
ORDER BY duration_ms DESC
LIMIT 50
If
duration_msis not a separate field in your stream, check whether duration is embedded in thestatementormessagefield and adjust the query accordingly.
Find connection events
SELECT p_timestamp, severity, user_name, database_name, message
FROM "postgres-logs"
WHERE message LIKE '%connection%'
   OR message LIKE '%disconnection%'
ORDER BY p_timestamp DESC
LIMIT 100
Group errors by database
SELECT database_name, severity, count(*) AS event_count
FROM "postgres-logs"
WHERE severity IN ('ERROR', 'FATAL')
  AND p_timestamp >= now() - interval '24 hours'
GROUP BY database_name, severity
ORDER BY event_count DESC
Step 7: Analyze PostgreSQL metrics in Parseable
The pg-metrics stream contains Prometheus-format metrics from PostgreSQL exporter. Metric names follow the pg_stat_* naming convention. Inspect the stream first to confirm available metric names:
SELECT DISTINCT name FROM "pg-metrics" LIMIT 50Adjust all queries below to match the metric names present in your stream.
Connection count trends
SELECT
  date_trunc('minute', p_timestamp) AS minute,
  avg(value) AS avg_connections
FROM "pg-metrics"
WHERE name = 'pg_stat_database_numbackends'
  AND p_timestamp >= now() - interval '1 hour'
GROUP BY 1
ORDER BY 1
Transaction commit and rollback rates
SELECT
  date_trunc('minute', p_timestamp) AS minute,
  sum(CASE WHEN name = 'pg_stat_database_xact_commit' THEN value ELSE 0 END) AS commits,
  sum(CASE WHEN name = 'pg_stat_database_xact_rollback' THEN value ELSE 0 END) AS rollbacks
FROM "pg-metrics"
WHERE p_timestamp >= now() - interval '1 hour'
GROUP BY 1
ORDER BY 1
Cache hit ratio
SELECT
  date_trunc('minute', p_timestamp) AS minute,
  avg(value) AS cache_hit_ratio
FROM "pg-metrics"
WHERE name = 'pg_stat_database_blks_hit_ratio'
  AND p_timestamp >= now() - interval '1 hour'
GROUP BY 1
ORDER BY 1
Deadlock count over time
SELECT
  date_trunc('hour', p_timestamp) AS hour,
  sum(value) AS deadlocks
FROM "pg-metrics"
WHERE name = 'pg_stat_database_deadlocks'
  AND p_timestamp >= now() - interval '24 hours'
GROUP BY 1
ORDER BY 1
Checkpoint activity
SELECT
  date_trunc('hour', p_timestamp) AS hour,
  sum(CASE WHEN name = 'pg_stat_bgwriter_checkpoints_timed' THEN value ELSE 0 END) AS timed_checkpoints,
  sum(CASE WHEN name = 'pg_stat_bgwriter_checkpoints_req' THEN value ELSE 0 END) AS requested_checkpoints
FROM "pg-metrics"
WHERE p_timestamp >= now() - interval '24 hours'
GROUP BY 1
ORDER BY 1
Step 8: Build PostgreSQL observability dashboards in Parseable
In the Parseable console, create a new dashboard and add panels from the SQL queries above.
Recommended panels for a PostgreSQL observability dashboard:
| Panel | Metric or log source | Visualization |
|---|---|---|
| Active connections | pg_stat_database_numbackends | Time series |
| Commits per minute | pg_stat_database_xact_commit | Time series |
| Rollback rate | pg_stat_database_xact_rollback | Time series |
| Cache hit ratio | pg_stat_database_blks_hit_ratio | Gauge + time series |
| Deadlocks | pg_stat_database_deadlocks | Time series |
| Errors over time | postgres-logs WHERE severity = ERROR | Time series |
| Slow queries | postgres-logs WHERE duration_ms > threshold | Table |
| Table size | pg_stat_user_tables_n_live_tup | Bar chart |
| Checkpoint frequency | pg_stat_bgwriter_checkpoints_timed | Time series |
Keep the dashboard focused on the signals that matter most for your workload. A dashboard with 20 panels is harder to read than one with 8 focused ones.
Step 9: Set up alerts for PostgreSQL health
Use Parseable's alerting layer to fire notifications when PostgreSQL signals deviate. Suggested alerts:
High connection count — alert when connections approach pool limits:
SELECT avg(value) FROM "pg-metrics"
WHERE name = 'pg_stat_database_numbackends'
  AND p_timestamp >= now() - interval '5 minutes'
HAVING avg(value) > 80
High deadlock rate — alert when deadlocks spike:
SELECT sum(value) FROM "pg-metrics"
WHERE name = 'pg_stat_database_deadlocks'
  AND p_timestamp >= now() - interval '15 minutes'
HAVING sum(value) > 5
Low cache hit ratio — alert when buffer cache efficiency drops:
SELECT avg(value) FROM "pg-metrics"
WHERE name = 'pg_stat_database_blks_hit_ratio'
  AND p_timestamp >= now() - interval '10 minutes'
HAVING avg(value) < 0.90
Error spike in logs — alert on sudden error rate increase:
SELECT count(*) FROM "postgres-logs"
WHERE severity IN ('ERROR', 'FATAL')
  AND p_timestamp >= now() - interval '5 minutes'
HAVING count(*) > 20
Troubleshooting PostgreSQL observability setup
Fluent Bit is not sending logs
Check the Fluent Bit pod logs:
kubectl logs -l app.kubernetes.io/name=fluent-bit -n parseable --tail=50Look for output errors pointing to Parseable. Common causes: wrong Parseable endpoint URL, incorrect X-P-Stream header, authentication failure (wrong base64-encoded credentials).
PostgreSQL logs are not structured
If logs appear in Parseable but all content lands in a single field (no separate severity, user, or statement columns), the Fluent Bit regex parser is not matching the log prefix format. Confirm that log_line_prefix = '%m [%p] %q%u@%d ' in the PostgreSQL config matches the parser regex in the Fluent Bit config.
PostgreSQL exporter cannot connect
kubectl logs -l app.kubernetes.io/name=prometheus-postgres-exporter --tail=30Common causes: wrong host value in postgres-values.yaml (use the Kubernetes service FQDN, not localhost), wrong user or password, or the PostgreSQL user lacks the necessary pg_stat_* read permissions.
OpenTelemetry Collector has scrape errors
kubectl logs -l app.kubernetes.io/name=opentelemetry-collector --tail=50Look for scrape failed errors pointing to the exporter target. Confirm postgres-exporter.default.svc.cluster.local:9187 is the correct service address — use kubectl get svc to confirm the service name and namespace.
Parseable stream is empty
- Confirm the Parseable ingestor pod is running:
kubectl get pods -n parseable - Check the ingestor logs:
kubectl logs -l app.kubernetes.io/component=ingestor -n parseable - Re-run the Collector scrape check above
- Confirm the
X-P-Streamheader inotel-values.yamlis exactlypg-metrics(no spaces)
Field names do not match SQL queries
Run SELECT * FROM "postgres-logs" LIMIT 3 and SELECT * FROM "pg-metrics" LIMIT 3 to inspect the actual column names in your streams. The field names depend on the Fluent Bit parser regex and how the OTel Collector flattens Prometheus labels into the OTLP export. Adapt all queries to the column names you see.
Metrics appear but database labels are missing
PostgreSQL exporter attaches datname and server labels to most metrics. If those labels are not present in the Parseable stream, check whether the OTel Collector's OTLP JSON export is including metric attributes. Enable debug: {} in the Collector exporters section to inspect what the Collector is emitting.
Production hardening
Secure credentials with Kubernetes secrets
Never embed database passwords or S3 credentials in plain YAML files. Use Kubernetes secrets and reference them via secretKeyRef in manifests:
kubectl create secret generic postgres-exporter-credentials \
  --from-literal=password=your-secure-password \
  -n default
Use least-privilege database users
The PostgreSQL exporter user needs only SELECT access on pg_stat_* views. Avoid using the postgres superuser for the exporter connection.
Control log volume
log_statement = 'all' can generate significant log volume on busy databases. After initial setup, consider log_statement = 'mod' (only data-modifying statements) or log_statement = 'ddl' (only schema changes) to reduce noise. Adjust log_min_duration_statement to only log slow queries above a millisecond threshold:
log_min_duration_statement = 250 # Log queries taking longer than 250msTune scrape intervals
A 10-second scrape interval is suitable for initial setup. For production, consider 30 or 60 seconds for most metrics to reduce Collector and exporter overhead. Keep shorter intervals only for high-priority signals like connection count and error rates.
Keep stream names consistent
Use consistent, lowercase stream names throughout (postgres-logs, pg-metrics). Inconsistent casing or spacing in X-P-Stream headers causes data to land in wrong or duplicate streams.
Validate retention requirements
For observability pricing purposes, log verbosity and scrape frequency directly affect ingest volume and therefore storage cost. Set retention policies in Parseable that match your operational and compliance requirements — high-verbosity logs from development do not need the same retention as production metrics.
Common mistakes
Collecting logs but not metrics
PostgreSQL logs expose what happened (slow queries, errors, connections). PostgreSQL metrics expose how the system is performing (cache hit ratio, transaction rate, deadlock count). Both are needed for useful PostgreSQL performance monitoring. A setup with only logs lacks trend visibility; a setup with only metrics lacks query-level context.
Using log_statement = 'all' in production without a duration filter
Logging all statements generates high log volume and can increase I/O on busy databases. Use log_min_duration_statement to limit captured statements to those exceeding a useful latency threshold.
Hardcoding credentials in Helm values files
Helm values files often end up in version control. Use Kubernetes secrets and avoid plaintext credentials in postgres-values.yaml or parseable-env-secret.
Not validating field names before writing queries
The field names in Parseable depend on the Fluent Bit parser configuration and how the OTel Collector flattens metric labels. Always inspect the stream schema with a SELECT * LIMIT 3 query before writing production SQL.
Treating PostgreSQL availability as full observability
A database that passes a health check can still have exhausted connection pools, high deadlock rates, or degraded query plans. PostgreSQL observability requires logs and metrics, not just an uptime check.
Ignoring the exporter user's permissions
The PostgreSQL exporter will return empty or error metrics if the database user lacks read access to pg_stat_* views. Grant the minimum required permissions and test the exporter connection independently before deploying the full pipeline.
Conclusion
A working PostgreSQL observability pipeline should collect both logs and metrics, route them through a centralized backend, and give teams a practical interface for SQL queries, dashboards, and alerts. This guide builds that pipeline on Kubernetes: Fluent Bit handles structured log collection, PostgreSQL exporter exposes database statistics, OpenTelemetry Collector standardizes metric collection and export, and Parseable stores everything in a single queryable backend.
With both the postgres-logs and pg-metrics streams running, teams can investigate slow queries in the log stream, correlate them with cache hit ratio trends in the metrics stream, build dashboards for database health signals, and alert on connection pressure, deadlocks, or error spikes — without leaving the Parseable console.
In the next guide, we build interactive dashboards for PostgreSQL logs and metrics using Parseable's visualization layer.

