

Open-source observability platforms are tools or stacks that help engineering teams collect, store, query, visualize, and alert on telemetry data—logs, metrics, traces, and more—without depending entirely on closed vendor products. Unlike SaaS-only tools, open-source observability platforms can be self-hosted, extended, and integrated into your own infrastructure.
Teams choose open-source observability platforms for several reasons: lower vendor lock-in, full control over telemetry data, better cost predictability at scale, and compatibility with OpenTelemetry—the vendor-neutral standard for generating, collecting, and exporting traces, metrics, and logs. As data volumes grow, the economics of self-hosted open-source observability become increasingly compelling compared to per-seat or per-GB SaaS pricing.
This guide compares the best open-source observability platforms in 2026 by telemetry coverage, deployment model, query experience, storage architecture, pricing, pros, and cons—structured as a practical buyer's guide, not an architecture catalog.
What open-source observability platforms actually do
Open-source observability platforms help teams collect and correlate telemetry across logs, metrics, traces, events, and sometimes profiles or session replay. The goal is to give engineers enough context to investigate unknown issues—not just monitor known failure modes.
OpenTelemetry plays a central role here. It is a vendor-neutral framework that standardizes how applications generate, collect, and export traces, metrics, and logs. Most modern open-source observability platforms support OpenTelemetry Protocol (OTLP), which means teams can switch backends without re-instrumenting applications.
Open-source observability platforms vs monitoring tools
These two categories are often confused:
- Monitoring tools track predefined health metrics and fire alerts when thresholds are crossed.
- Observability platforms help teams investigate unknown or unpredictable failures using correlated telemetry.
- Open-source observability platforms add self-hosted deployment, data ownership, and freedom from proprietary lock-in.
Monitoring is about knowing what is wrong. Observability is about understanding why.
Open-source observability platform vs open-source observability stack
This guide includes both unified products and composed stacks. The distinction matters:
- A platform is more productized and ships as a cohesive unit with one install path.
- A stack combines multiple components—collectors, storage, dashboards, alerting—assembled by the team.
Grafana LGTM is a stack because it combines Loki for logs, Grafana for visualization, Tempo for traces, and Mimir for metrics. Parseable and SigNoz are closer to platforms because they ship as unified products with a single ingestion, storage, and query layer.
What to look for in open-source observability platforms
-
Logs, metrics, and traces in one workflow: A strong open-source observability platform should cover the three core telemetry signals—or integrate cleanly with tools that do—so teams can correlate a spike in error logs with a latency trace without switching contexts.
-
OpenTelemetry support: Prioritize open-source observability platforms that accept OTLP natively and work with the OpenTelemetry Collector. This protects instrumentation investments and avoids vendor-specific SDKs that create lock-in even in open-source deployments.
-
Query experience: Different open-source observability platforms use different query models: SQL, PromQL, LogQL, Lucene-style search, and TraceQL. Choose the model that fits your team's existing skills and data shape. SQL-first platforms tend to be easier to adopt for teams already familiar with structured data querying.
-
Storage architecture: Storage determines cost, performance, and operational burden. Options across open-source observability platforms include object storage (S3-compatible), ClickHouse columnar storage, Elasticsearch/OpenSearch inverted indexes, local disk, and hybrid setups. Object-storage-first architectures tend to offer the best cost profile for long-term telemetry retention.
-
Deployment flexibility: Check whether the open-source observability platform supports self-hosted, Kubernetes, Docker, managed cloud, and bring-your-own-cloud (BYOC) options. The best options offer flexibility across development, staging, and production environments without forcing a different architecture at each stage.
-
Cost and retention control: One of the primary reasons teams evaluate open-source observability platforms is cost. Compare ingestion pricing, storage costs, retention limits, and whether long-term storage is practical on the free tier or only possible at enterprise pricing.
-
Day-2 operations: Easy installation is table stakes. The real test of any open-source observability platform is whether it handles upgrades, scaling, multi-tenancy, RBAC, backup, and alerting without requiring a dedicated platform team to maintain it.
Best open-source observability platforms at a glance
| Platform | Best for | Signals | License | Deployment | Query model | Key limitation |
|---|---|---|---|---|---|---|
| Parseable | Cost-efficient unified telemetry | Logs, metrics, traces | Apache 2.0 | Self-hosted, managed, BYOC | SQL | Smaller community than Grafana or Elastic |
| Grafana LGTM | Composable teams | Logs, metrics, traces | AGPL/Apache | Self-hosted, Grafana Cloud | LogQL, PromQL, TraceQL | Multiple components, multiple query languages |
| SigNoz | OpenTelemetry-first APM | Logs, metrics, traces, errors | MIT | Self-hosted, cloud | SQL + custom | ClickHouse expertise helpful at scale |
| OpenObserve | Low-cost long-term storage | Logs, metrics, traces | AGPL | Self-hosted, cloud | SQL | Smaller ecosystem |
| ClickStack | ClickHouse-native observability | Logs, metrics, traces, session replay | Apache 2.0 | Self-hosted, ClickHouse Cloud | SQL, Lucene | HyperDX UI dependency |
| HyperDX | Production debugging | Logs, traces, metrics, errors, session replay | MIT | Self-hosted, managed | Lucene-style + SQL | Still maturing community |
| OpenSearch Observability | Teams already using OpenSearch | Logs, traces | Apache 2.0 | Self-hosted, managed | Lucene / DQL | JVM ops, shard management |
| Apache SkyWalking | Distributed tracing and topology | Metrics, traces, logs | Apache 2.0 | Self-hosted | Custom + SQL | Steep onboarding |
| VictoriaMetrics Stack | Metrics-heavy workloads | Metrics, logs | Apache 2.0 | Self-hosted, VM Cloud | MetricsQL | Tracing requires external tool |
| Uptrace | Tracing-led OpenTelemetry teams | Traces, metrics, logs | Source-available | Self-hosted, cloud | OpenTelemetry-native | License nuances in recent versions |
Top 10 open-source observability platforms in 2026
1. Parseable: Best open-source observability platform for cost-efficient unified telemetry
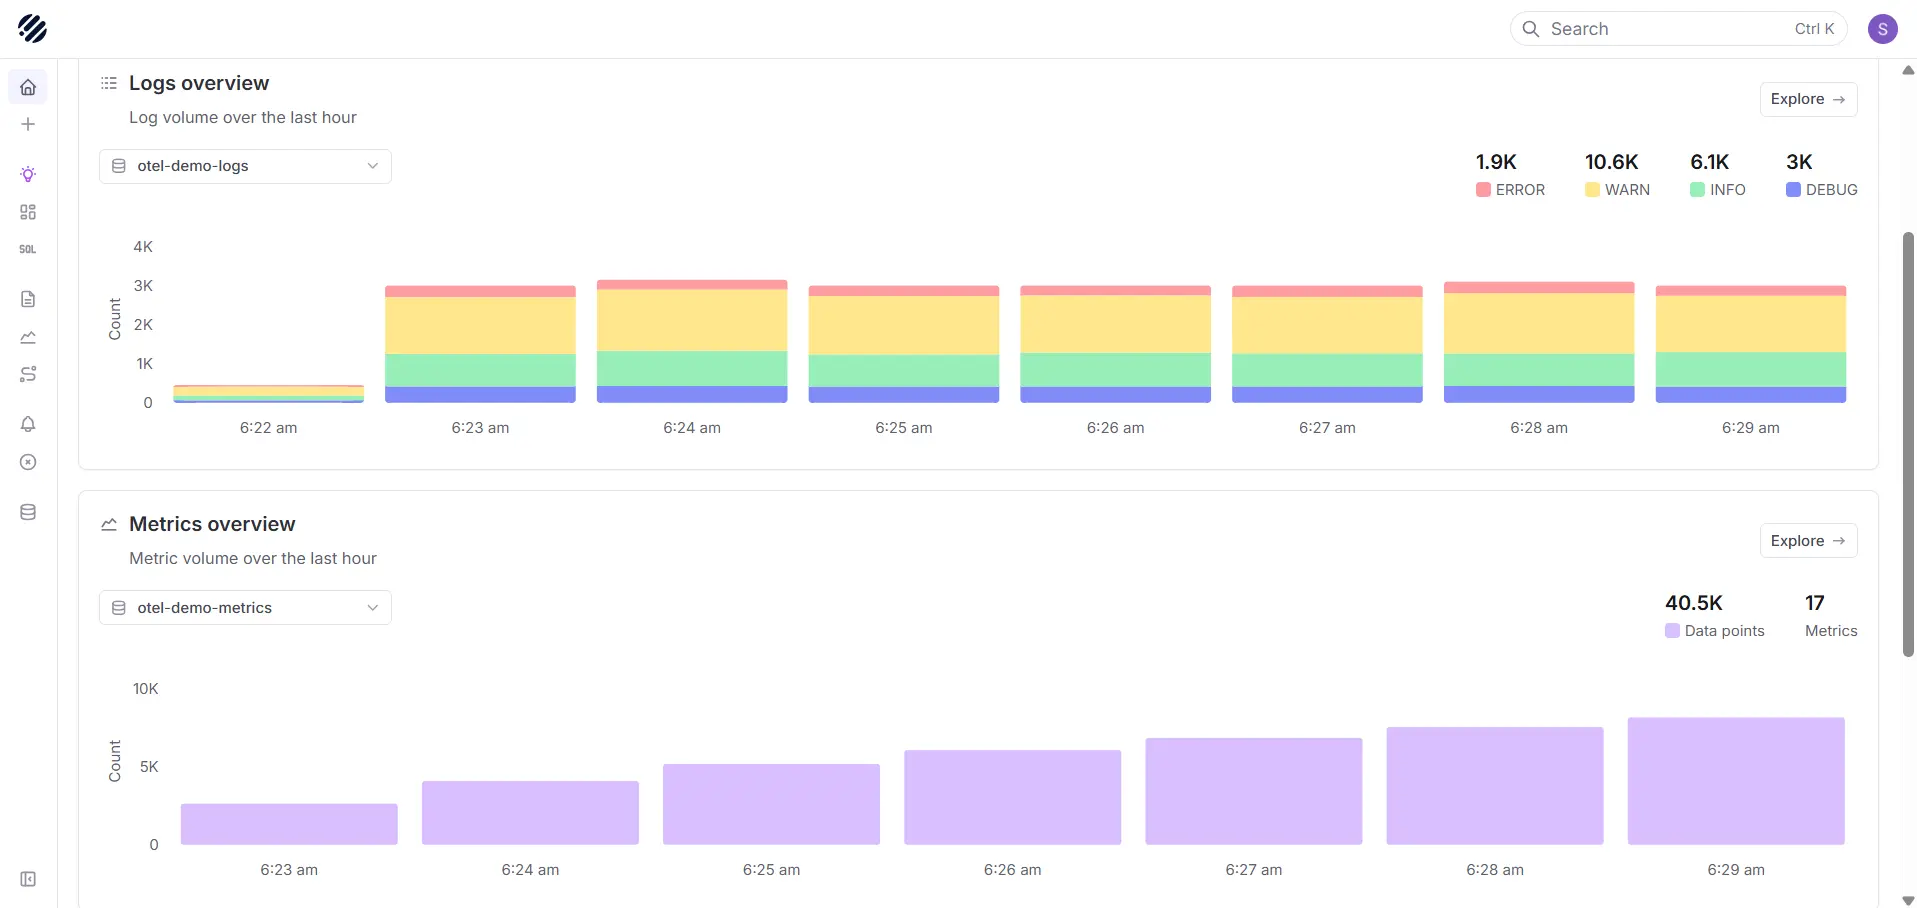
Parseable is an open-source observability platform designed for teams that want unified logs, metrics, and traces without the cost and operational overhead of managing a fragmented stack. Built on Apache Parquet and object-compatible storage, Parseable is an open-source observability platform that stores telemetry data as columnar files on S3-compatible storage—keeping query performance high while keeping long-term retention costs predictable.
Unlike traditional open-source observability platforms that rely on inverted indexes or time-series databases tuned for a single signal type, Parseable uses a SQL-first query interface across all three telemetry signals. Teams that already work with SQL can start querying logs, metrics, and traces immediately without learning PromQL, LogQL, or TraceQL. For teams evaluating open-source observability platforms on both architecture and economics, Parseable's combination of object-storage-first design, Apache Parquet columnar format, and OpenTelemetry compatibility addresses the most common pain points: storage cost, query fragmentation, and vendor dependency.
Parseable is also one of the few open-source observability platforms with a practical path from a self-hosted free tier through managed Pro and on-prem Enterprise—without forcing a full platform migration as requirements grow.
Key features
- Unified logs, metrics, and traces in one platform
- SQL-first querying across all telemetry signals
- Object-storage-first architecture (S3-compatible)
- Apache Parquet columnar storage for cost-efficient retention
- Native OpenTelemetry (OTLP) compatibility
- Built-in dashboards, alerting, and API access
- Self-hosted, managed cloud, BYOC, and enterprise deployment paths
- Cost-efficient long-term retention for high-volume telemetry
Pricing
- Self-hosted: Cost depends on the team's own infrastructure and object storage expenses
- Pro: $0.39/GB ingested, 365-day retention, 14-day free trial
- Enterprise: Includes BYOC and self-hosted deployment options, dedicated support, and enterprise governance features. Book a discovery call to know price.
Pros
- Strong cost profile for high-volume telemetry compared to SaaS and Elastic-based open-source observability platforms
- Full data ownership with no telemetry leaving your infrastructure unless you choose managed
- SQL across logs, metrics, and traces reduces tooling fragmentation
- Good alternative to building a DIY open-source observability stack from multiple components
- Flexible deployment from single-node Docker to enterprise Kubernetes clusters
Evaluating open-source observability for your own infrastructure? Deploy Parseable self-hosted, connect OpenTelemetry, and store logs, metrics, and traces in your own object storage with SQL-based investigation.
2. Grafana LGTM Stack: Best open-source observability stack for composable teams
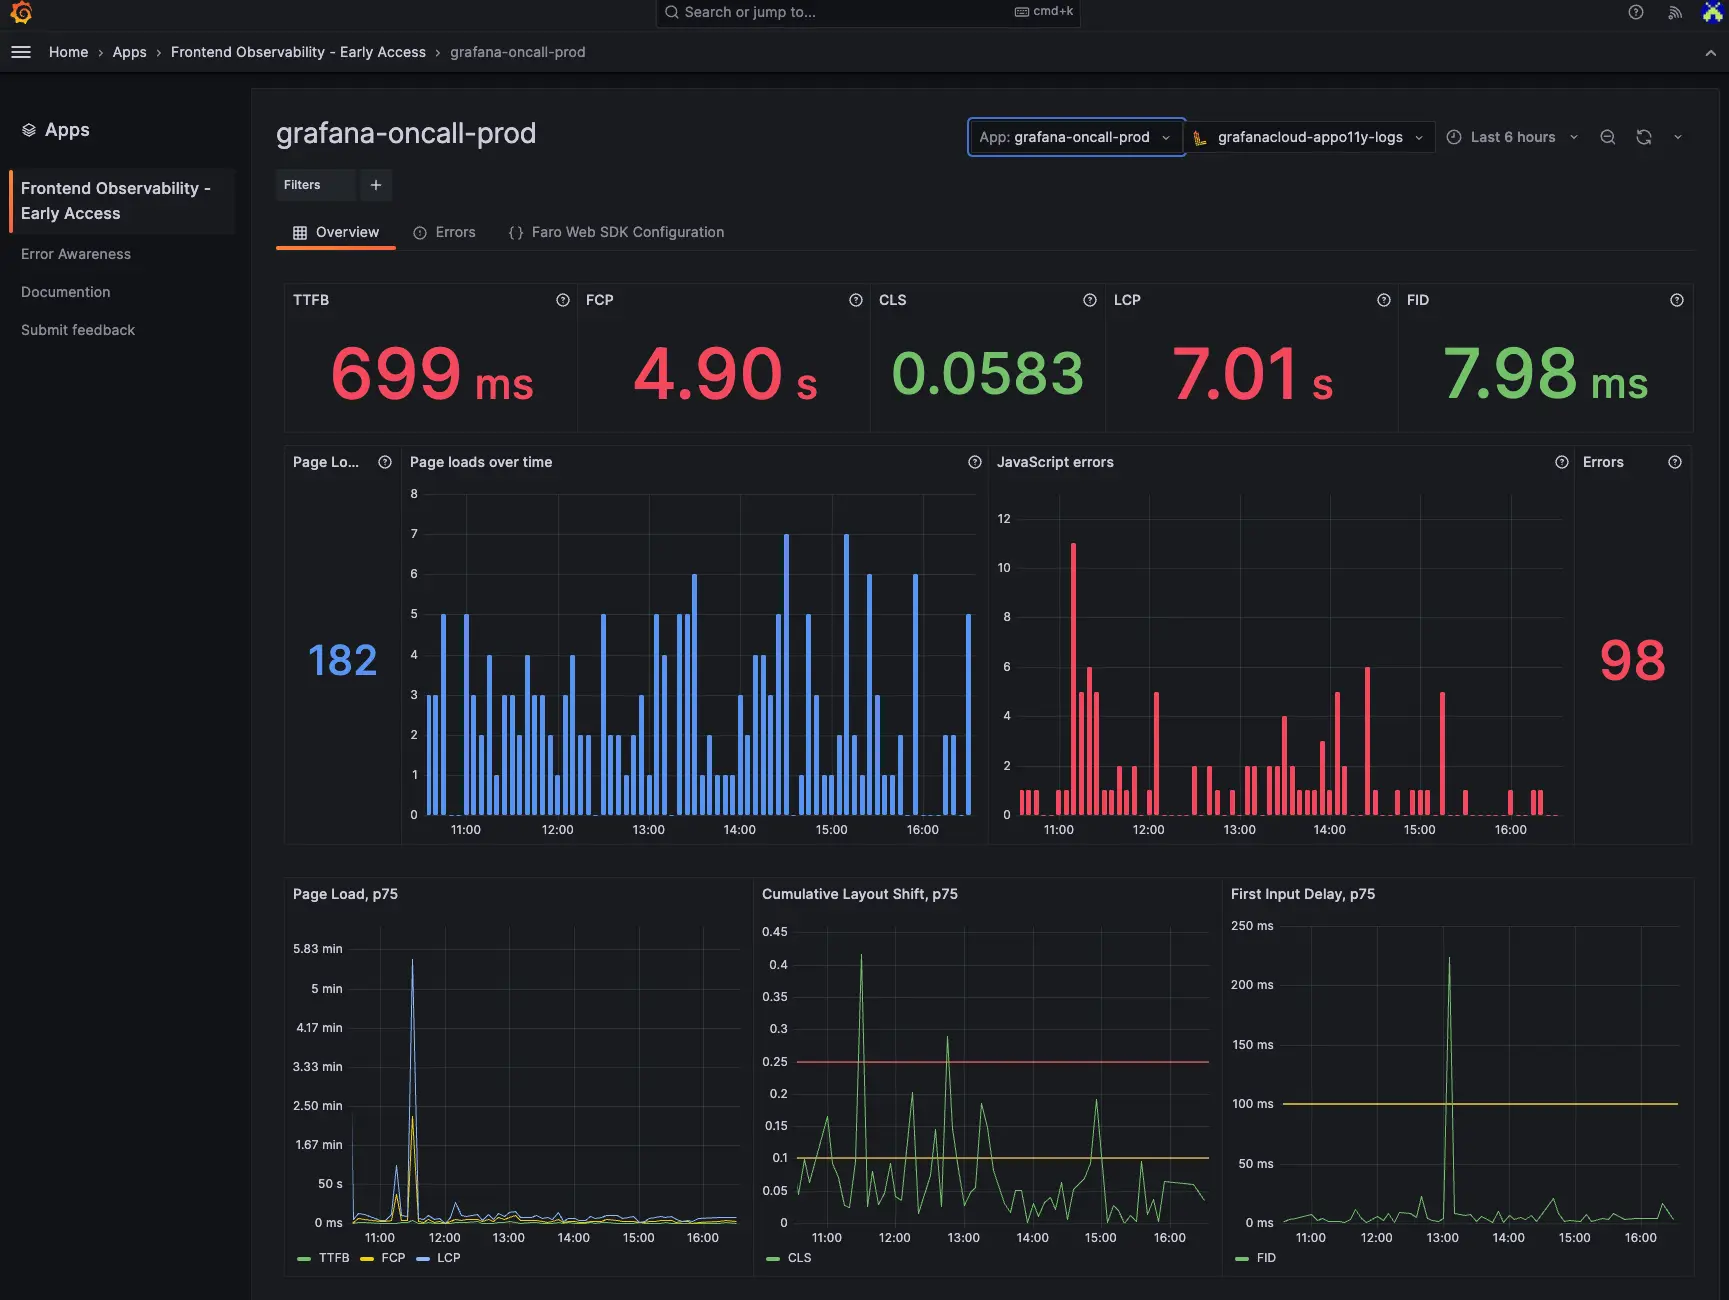
The Grafana LGTM Stack is one of the most widely deployed open-source observability solutions in production. It combines Loki for logs, Grafana for visualization, Tempo for traces, and Mimir for metrics into a composable open-source observability stack. Each component can be deployed independently, which makes Grafana LGTM a strong option for teams that already have parts of the stack in place and want to extend rather than replace.
As an open-source observability stack, Grafana LGTM is technically a composition of separate projects rather than a unified platform—each component has its own storage backend, query language, and scaling model. Teams that want Grafana's dashboards and plugin ecosystem but prefer a simpler deployment increasingly look at unified open-source observability platforms like Parseable or SigNoz as an alternative. Grafana LGTM's strength is breadth and flexibility; its tradeoff is operational complexity.
Key features
- Grafana for unified dashboards and visualization
- Loki for log aggregation (LogQL)
- Tempo for distributed tracing (TraceQL)
- Mimir for scalable Prometheus-compatible metrics (PromQL)
- Large plugin and integration ecosystem
- Grafana Alerting for centralized rule management across the stack
Pricing
- OSS: Free, self-hosted under AGPL and Apache 2.0 licenses per component
- Grafana Cloud: Managed path with a generous free tier and usage-based pricing beyond it
Pros
- Largest open-source observability ecosystem with thousands of community dashboards and integrations
- Modular—teams can adopt one component at a time
- Strong Kubernetes-native deployment via Grafana Operator and Helm charts
- Grafana OnCall and IRM for alert-to-incident workflows
Cons
- Managing four separate backends adds significant operational complexity compared to unified open-source observability platforms
- Three different query languages (LogQL, PromQL, TraceQL) create a learning curve across the team
- Signal correlation requires Grafana's trace-to-logs linking, which needs careful configuration to work reliably
- Self-hosted at scale is resource-intensive
3. SigNoz: Best open-source observability platform for OpenTelemetry-first teams
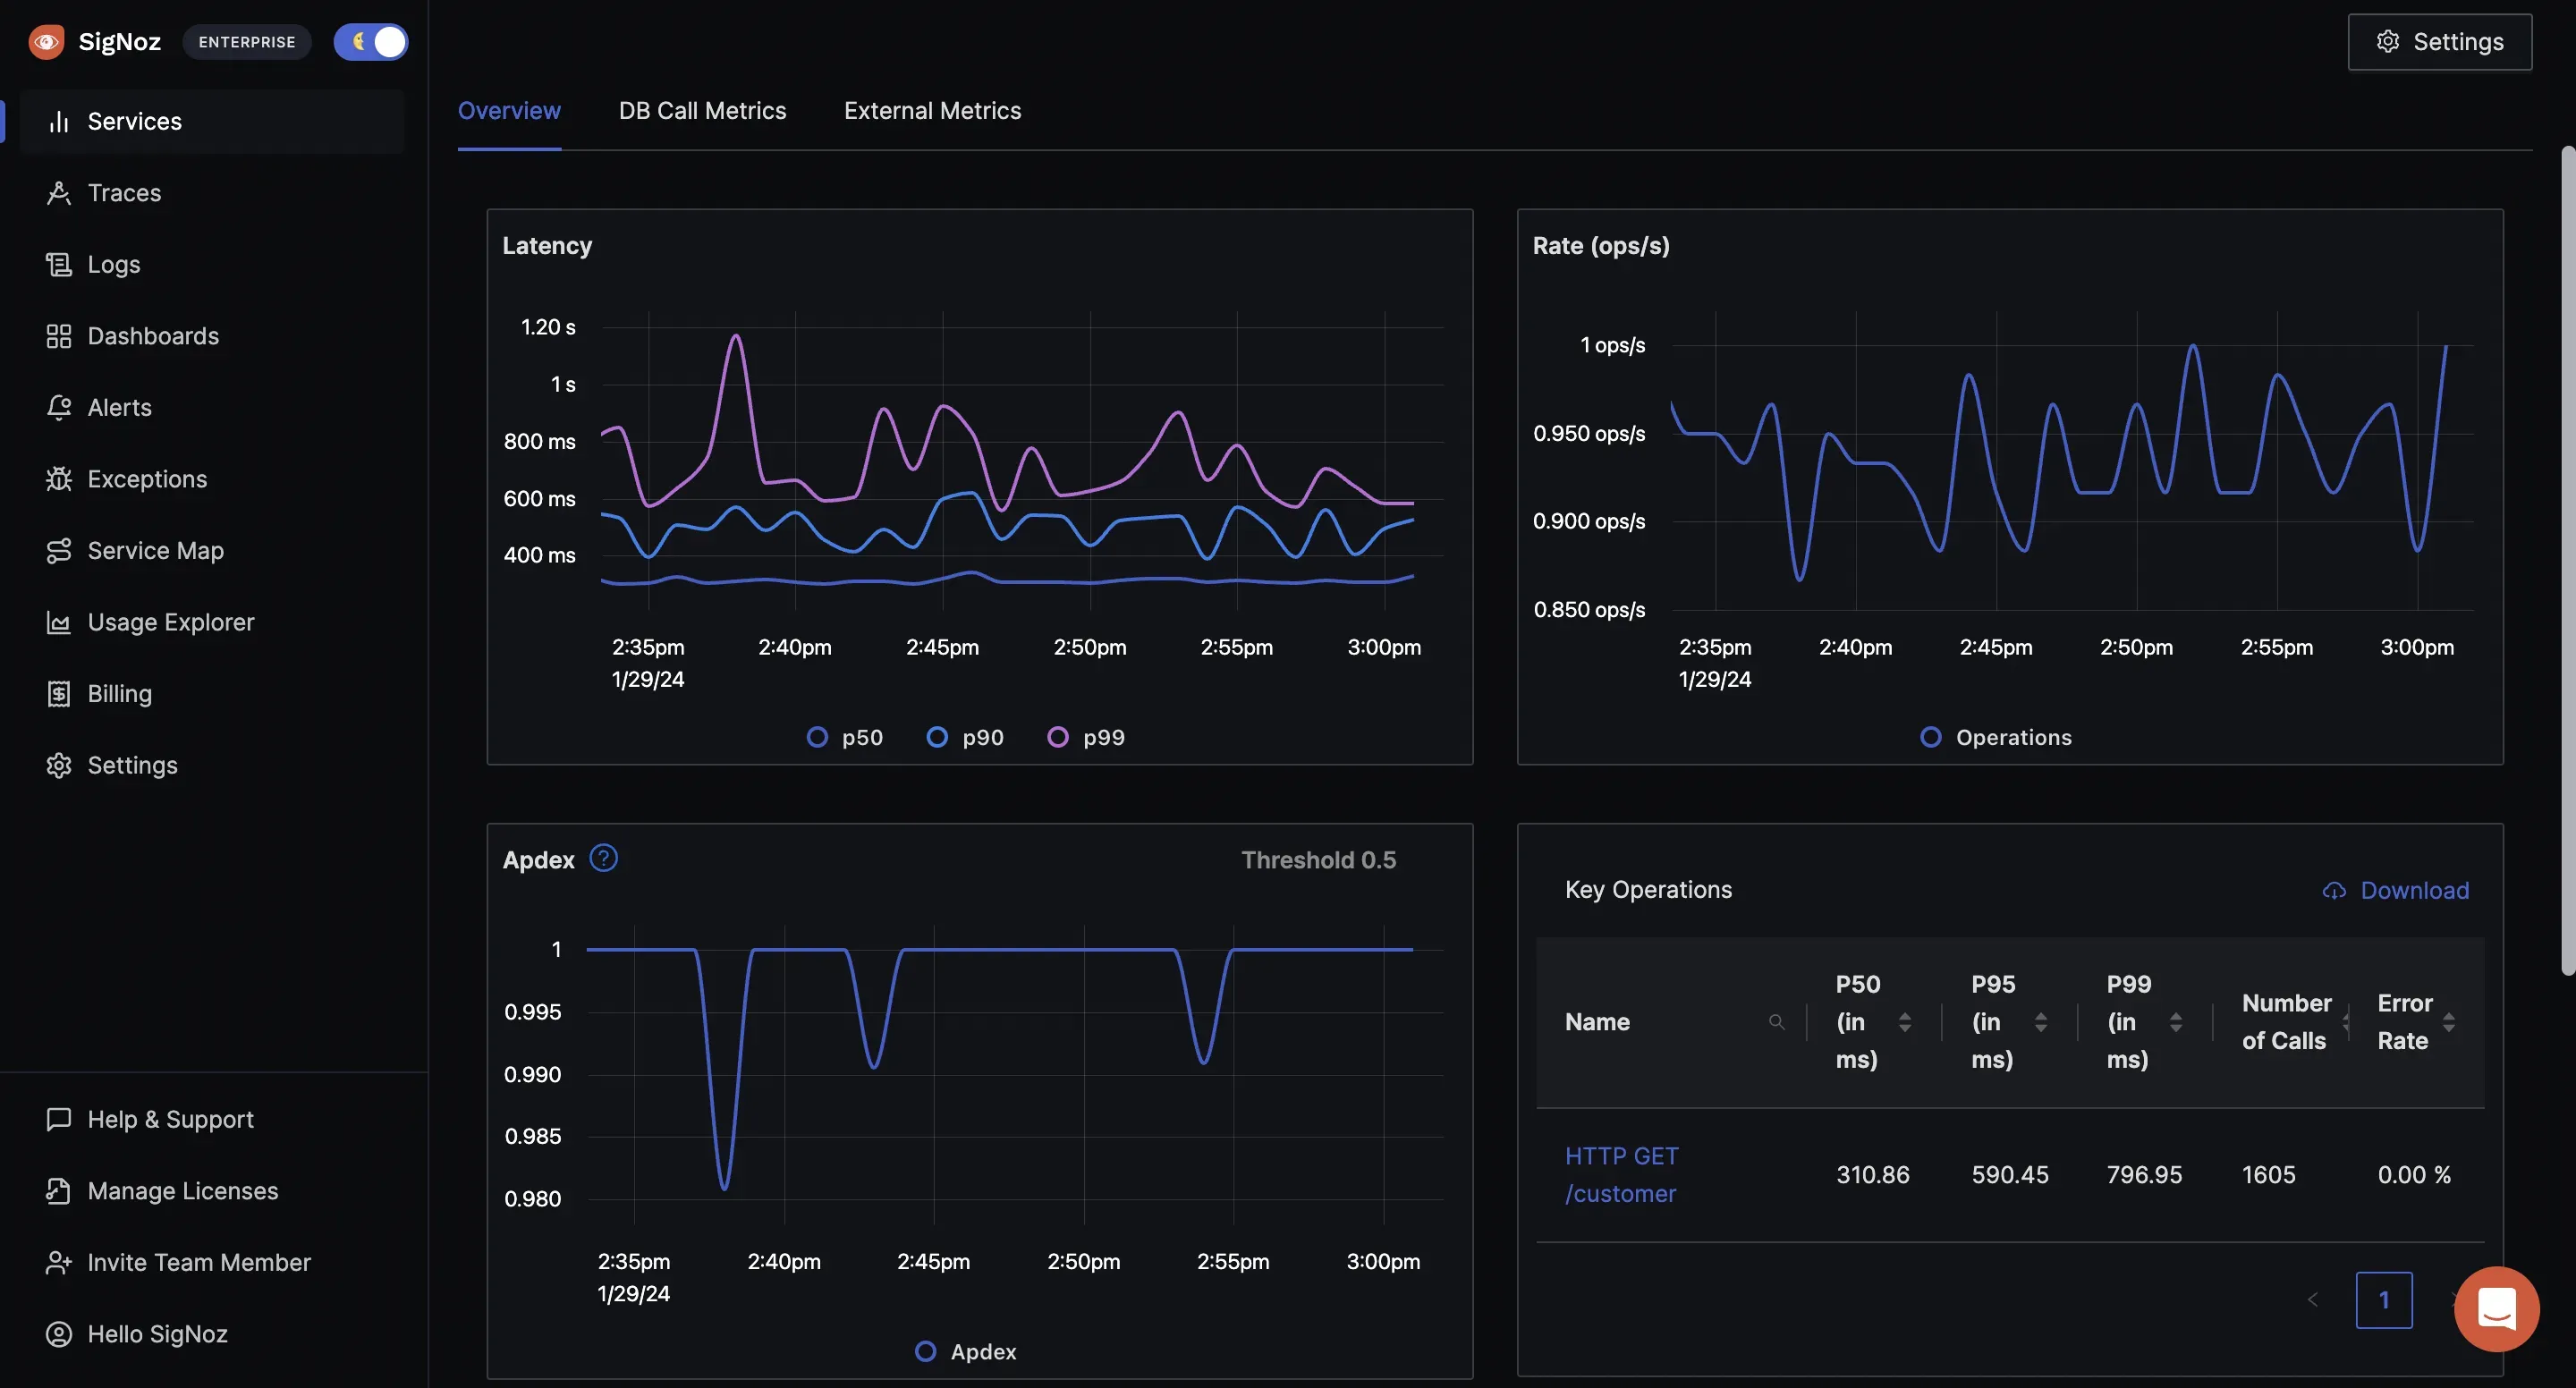
SigNoz is an open-source observability platform that positions itself as a direct alternative to Datadog and New Relic for teams that want logs, metrics, traces, dashboards, and alerts in a single product. It is one of the most actively developed open-source observability platforms available today and is built natively on OpenTelemetry from the ground up—which means instrumentation is portable and not tied to SigNoz-specific SDKs.
As an open-source observability platform backed by ClickHouse, SigNoz delivers fast query performance on large telemetry volumes without the storage costs associated with Elasticsearch-based platforms. It covers APM, exception tracking, infrastructure metrics, log pipelines, and LLM/AI observability—making it one of the more complete open-source observability platforms for teams running modern application stacks. For teams that have evaluated closed SaaS tools and found them too expensive or too locked-in, SigNoz is typically the first open-source observability platform to reach feature parity on APM workflows.
Key features
- OpenTelemetry-native ingestion (no proprietary agents required)
- Logs, metrics, traces, dashboards, and alerts in one product
- ClickHouse columnar storage for fast, cost-efficient queries
- APM with service maps, error tracking, and latency histograms
- Exception monitoring and log pipeline management
- LLM/AI observability for teams building on language models
- Self-hosted and SigNoz Cloud deployment options
Pricing
- Open-source (Community): Free, self-hosted under MIT license
- SigNoz Cloud: Usage-based pricing; free tier available
- Enterprise: Custom pricing for advanced RBAC, SSO, and support
Pros
- One of the most OpenTelemetry-complete open-source observability platforms available
- Active community and fast development velocity
- Unified UI reduces the context-switching common in stack-based approaches
- ClickHouse backend handles high-cardinality telemetry efficiently
Cons
- Requires ClickHouse familiarity for tuning at scale
- Self-hosted resource requirements are non-trivial for large deployments
- Some enterprise features (SSO, advanced RBAC) require the paid tier
4. OpenObserve
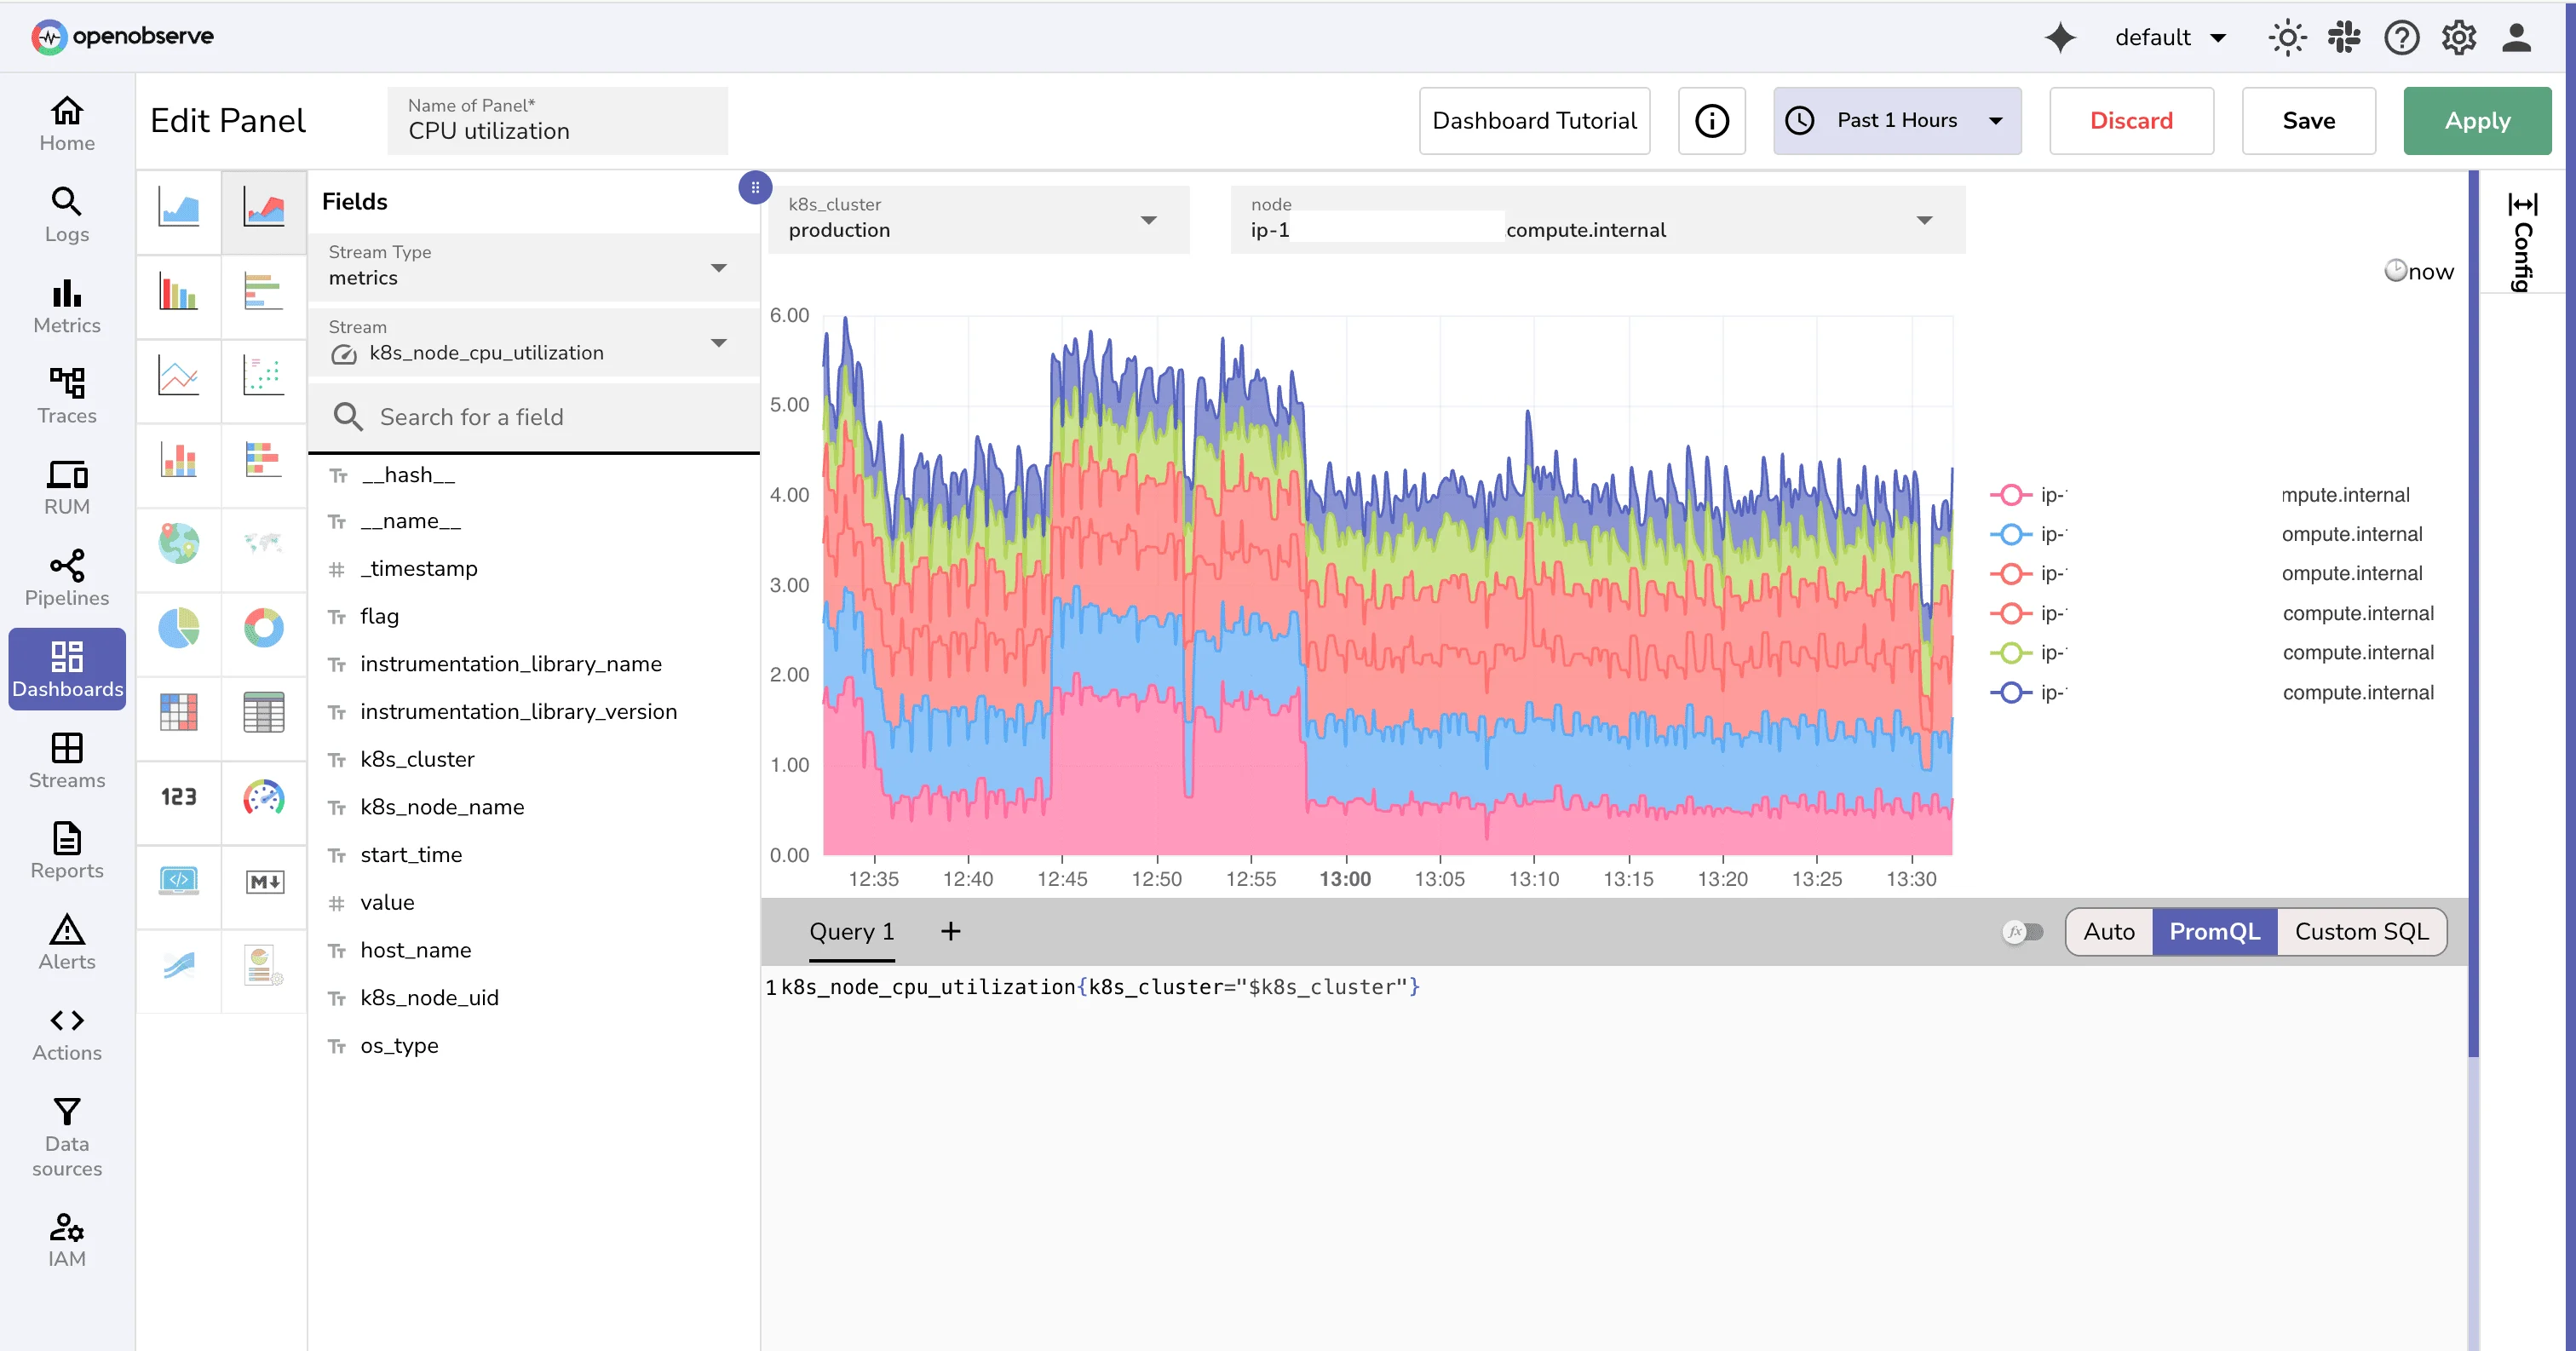
OpenObserve is an open-source observability platform built for teams that want logs, metrics, and traces at significantly lower storage costs than Elasticsearch-based open-source observability platforms. Written in Rust, OpenObserve is designed for a low memory footprint and fast ingestion, and it stores telemetry data on object storage—making it one of the most cost-efficient open-source observability platforms for long-term data retention.
OpenObserve supports OpenTelemetry natively, offers SQL-style querying across all signals, and ships with built-in dashboards and alerting. For teams evaluating open-source observability platforms primarily on cost-per-GB and operational simplicity, OpenObserve is a strong contender. Its architecture is most favorable at mid-scale where the economics of self-hosted object storage reduce storage costs by 10–140x compared to Elasticsearch, according to OpenObserve's published benchmarks. Teams that have outgrown Elasticsearch but are not yet ready for a managed SaaS platform often use OpenObserve as the bridge.
Key features
- Logs, metrics, and traces in one open-source observability platform
- OpenTelemetry (OTLP) compatibility
- Object-storage backend (S3, GCS, Azure Blob)
- SQL-style querying across all signal types
- Built-in dashboards and alerting
- Low memory footprint (Rust-based)
- Functions and pipelines for log enrichment
Pricing
- Open-source: Free, self-hosted under AGPL license
- OpenObserve Cloud: Usage-based, with a free tier for smaller workloads
- Enterprise: Custom pricing for SSO, advanced RBAC, and support
Pros
- Very low storage costs compared to Elasticsearch or ClickHouse-backed open-source observability platforms
- Low operational overhead for smaller teams
- Fast ingestion with minimal infrastructure
- OpenTelemetry support makes it straightforward to point existing pipelines at
Cons
- Smaller ecosystem and community compared to Grafana or Elastic-based open-source observability platforms
- Dashboard capabilities are less mature than Grafana
- AGPL license may require legal review for teams embedding it in commercial products
Try Parseable, the leading open-source observability platform for free. Get started
5. ClickStack: Best ClickHouse-powered open-source observability stack
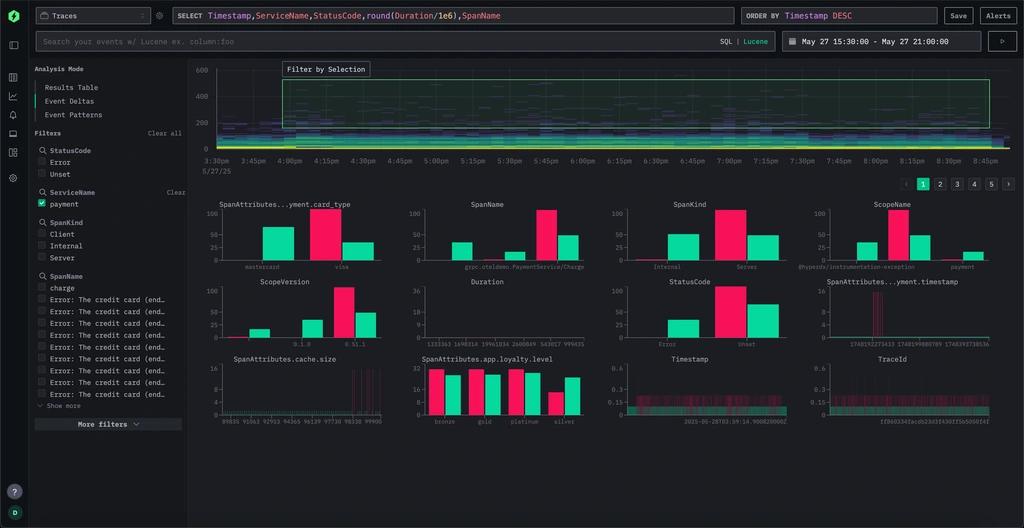
ClickStack is an open-source observability stack that combines the HyperDX user interface with ClickHouse as the storage and query backend. It is purpose-built for teams that want high-performance open-source observability on logs, metrics, traces, and session replay, with SQL access and Lucene-style search available across all signal types.
ClickHouse positions ClickStack as a unified open-source observability stack for engineering teams that want fast query response on large telemetry volumes without building a multi-component stack from scratch. It is available as an open-source, self-managed deployment and as a managed option through ClickHouse Cloud—making it one of the more flexible open-source observability stacks for teams at different deployment maturity stages. Teams evaluating open-source observability platforms that include session replay alongside standard telemetry signals will find ClickStack one of the few options that covers all four in a single stack.
Key features
- ClickHouse columnar storage backend
- HyperDX UI for unified observability
- Logs, metrics, traces, and session replay
- SQL access and Lucene-style search
- OpenTelemetry Collector pipeline support
- Managed option through ClickHouse Cloud
Pricing
- ClickStack Open Source: Free, self-managed
- Managed ClickStack: Available through ClickHouse Cloud with usage-based pricing
Pros
- Fast query performance on high-volume telemetry due to ClickHouse's columnar architecture
- Session replay alongside logs, metrics, and traces is rare among open-source observability platforms
- SQL-first approach lowers the query learning curve
- Clear upgrade path to managed hosting
Cons
- HyperDX UI dependency means the stack is less modular than Grafana LGTM
- ClickHouse requires operational knowledge and tuning at scale
- Smaller community than Elastic or Grafana-based open-source observability platforms
Comparing object-storage-first observability platforms? Parseable gives teams open-source telemetry storage with Apache Parquet, SQL querying, OpenTelemetry ingestion, dashboards, alerts, and a path from self-hosted to BYOC.
6. HyperDX
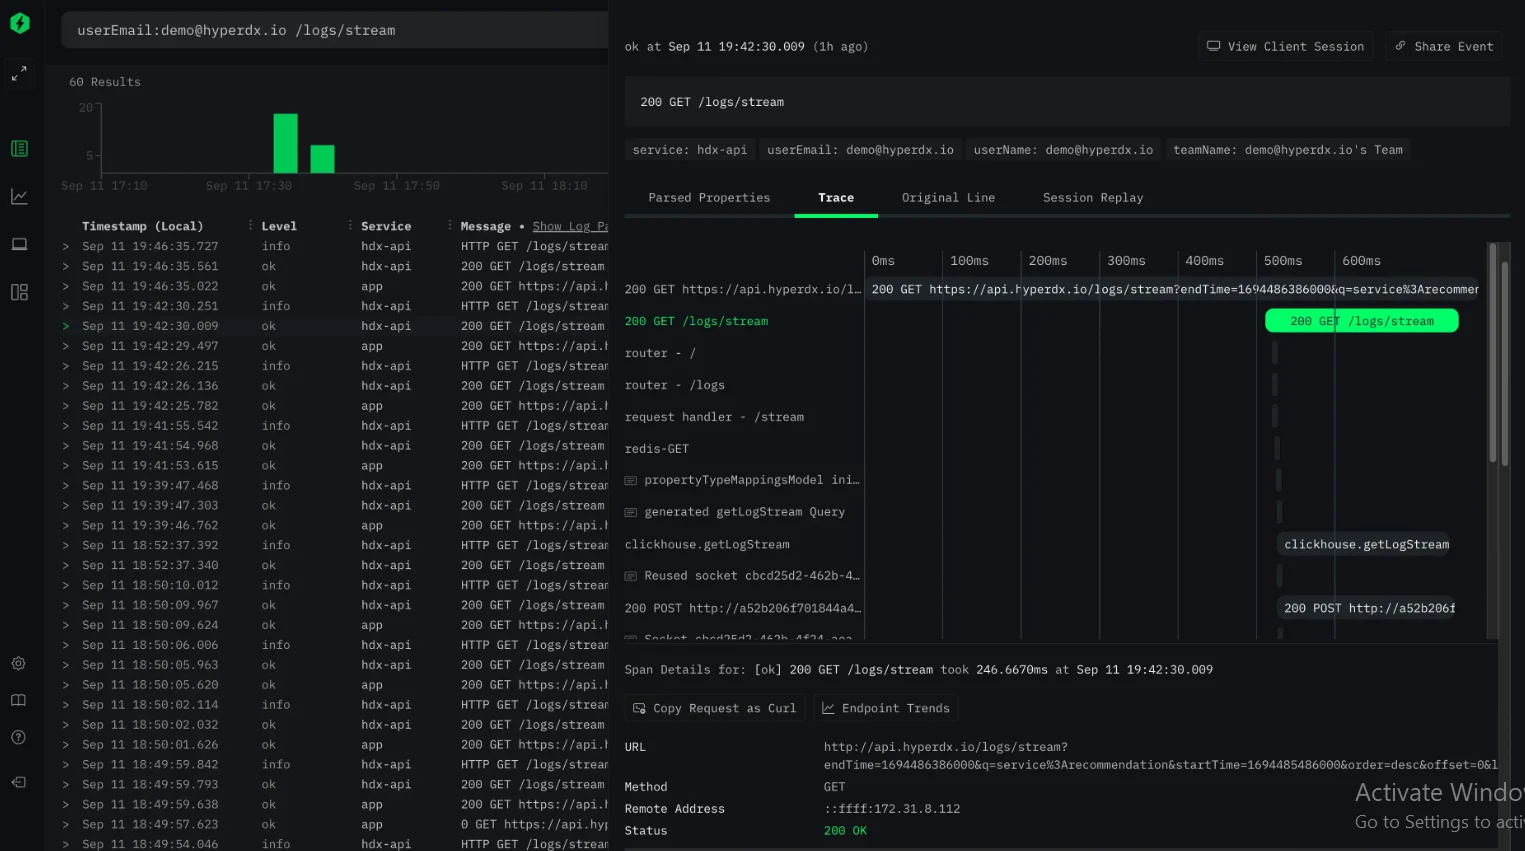
HyperDX is an open-source observability platform built for engineering teams that want fast, correlated debugging across logs, traces, metrics, errors, and session replay in a single interface. It positions itself as an affordable alternative to Datadog and Honeycomb, with a developer-first workflow that links traces to log lines to session replays without requiring a separate APM tool.
As an open-source observability platform, HyperDX runs on ClickHouse and uses OpenTelemetry for instrumentation, which means teams can point existing OTel pipelines at HyperDX without re-instrumenting applications. The session replay capability distinguishes it from most other open-source observability platforms in this list and makes it particularly relevant for teams running customer-facing web applications where front-end context is as important as back-end trace data. Teams that have evaluated ClickStack and HyperDX should note the overlap: ClickStack uses the HyperDX UI on top of ClickHouse, while HyperDX is the upstream open-source project.
Key features
- Logs, traces, metrics, errors, and session replay in one open-source observability platform
- ClickHouse-powered storage and query backend
- Full OpenTelemetry support
- Correlated log-to-trace navigation
- Fast search across structured and unstructured log data
- Self-hosted and managed deployment options
Pricing
- Open-source: Free, self-hosted under MIT license
- HyperDX Cloud: Usage-based managed option
Pros
- Session replay combined with traces and logs is a rare capability among open-source observability platforms
- Developer-friendly UI reduces time-to-root-cause for production incidents
- MIT license is permissive with no usage restrictions
- OpenTelemetry-native ingestion
Cons
- Community is smaller and development is faster-moving than established open-source observability platforms
- Overlap with ClickStack can create confusion about which project to use for self-hosted deployments
- Self-hosted ClickHouse management adds operational overhead
7. OpenSearch Observability: Best for teams already running OpenSearch
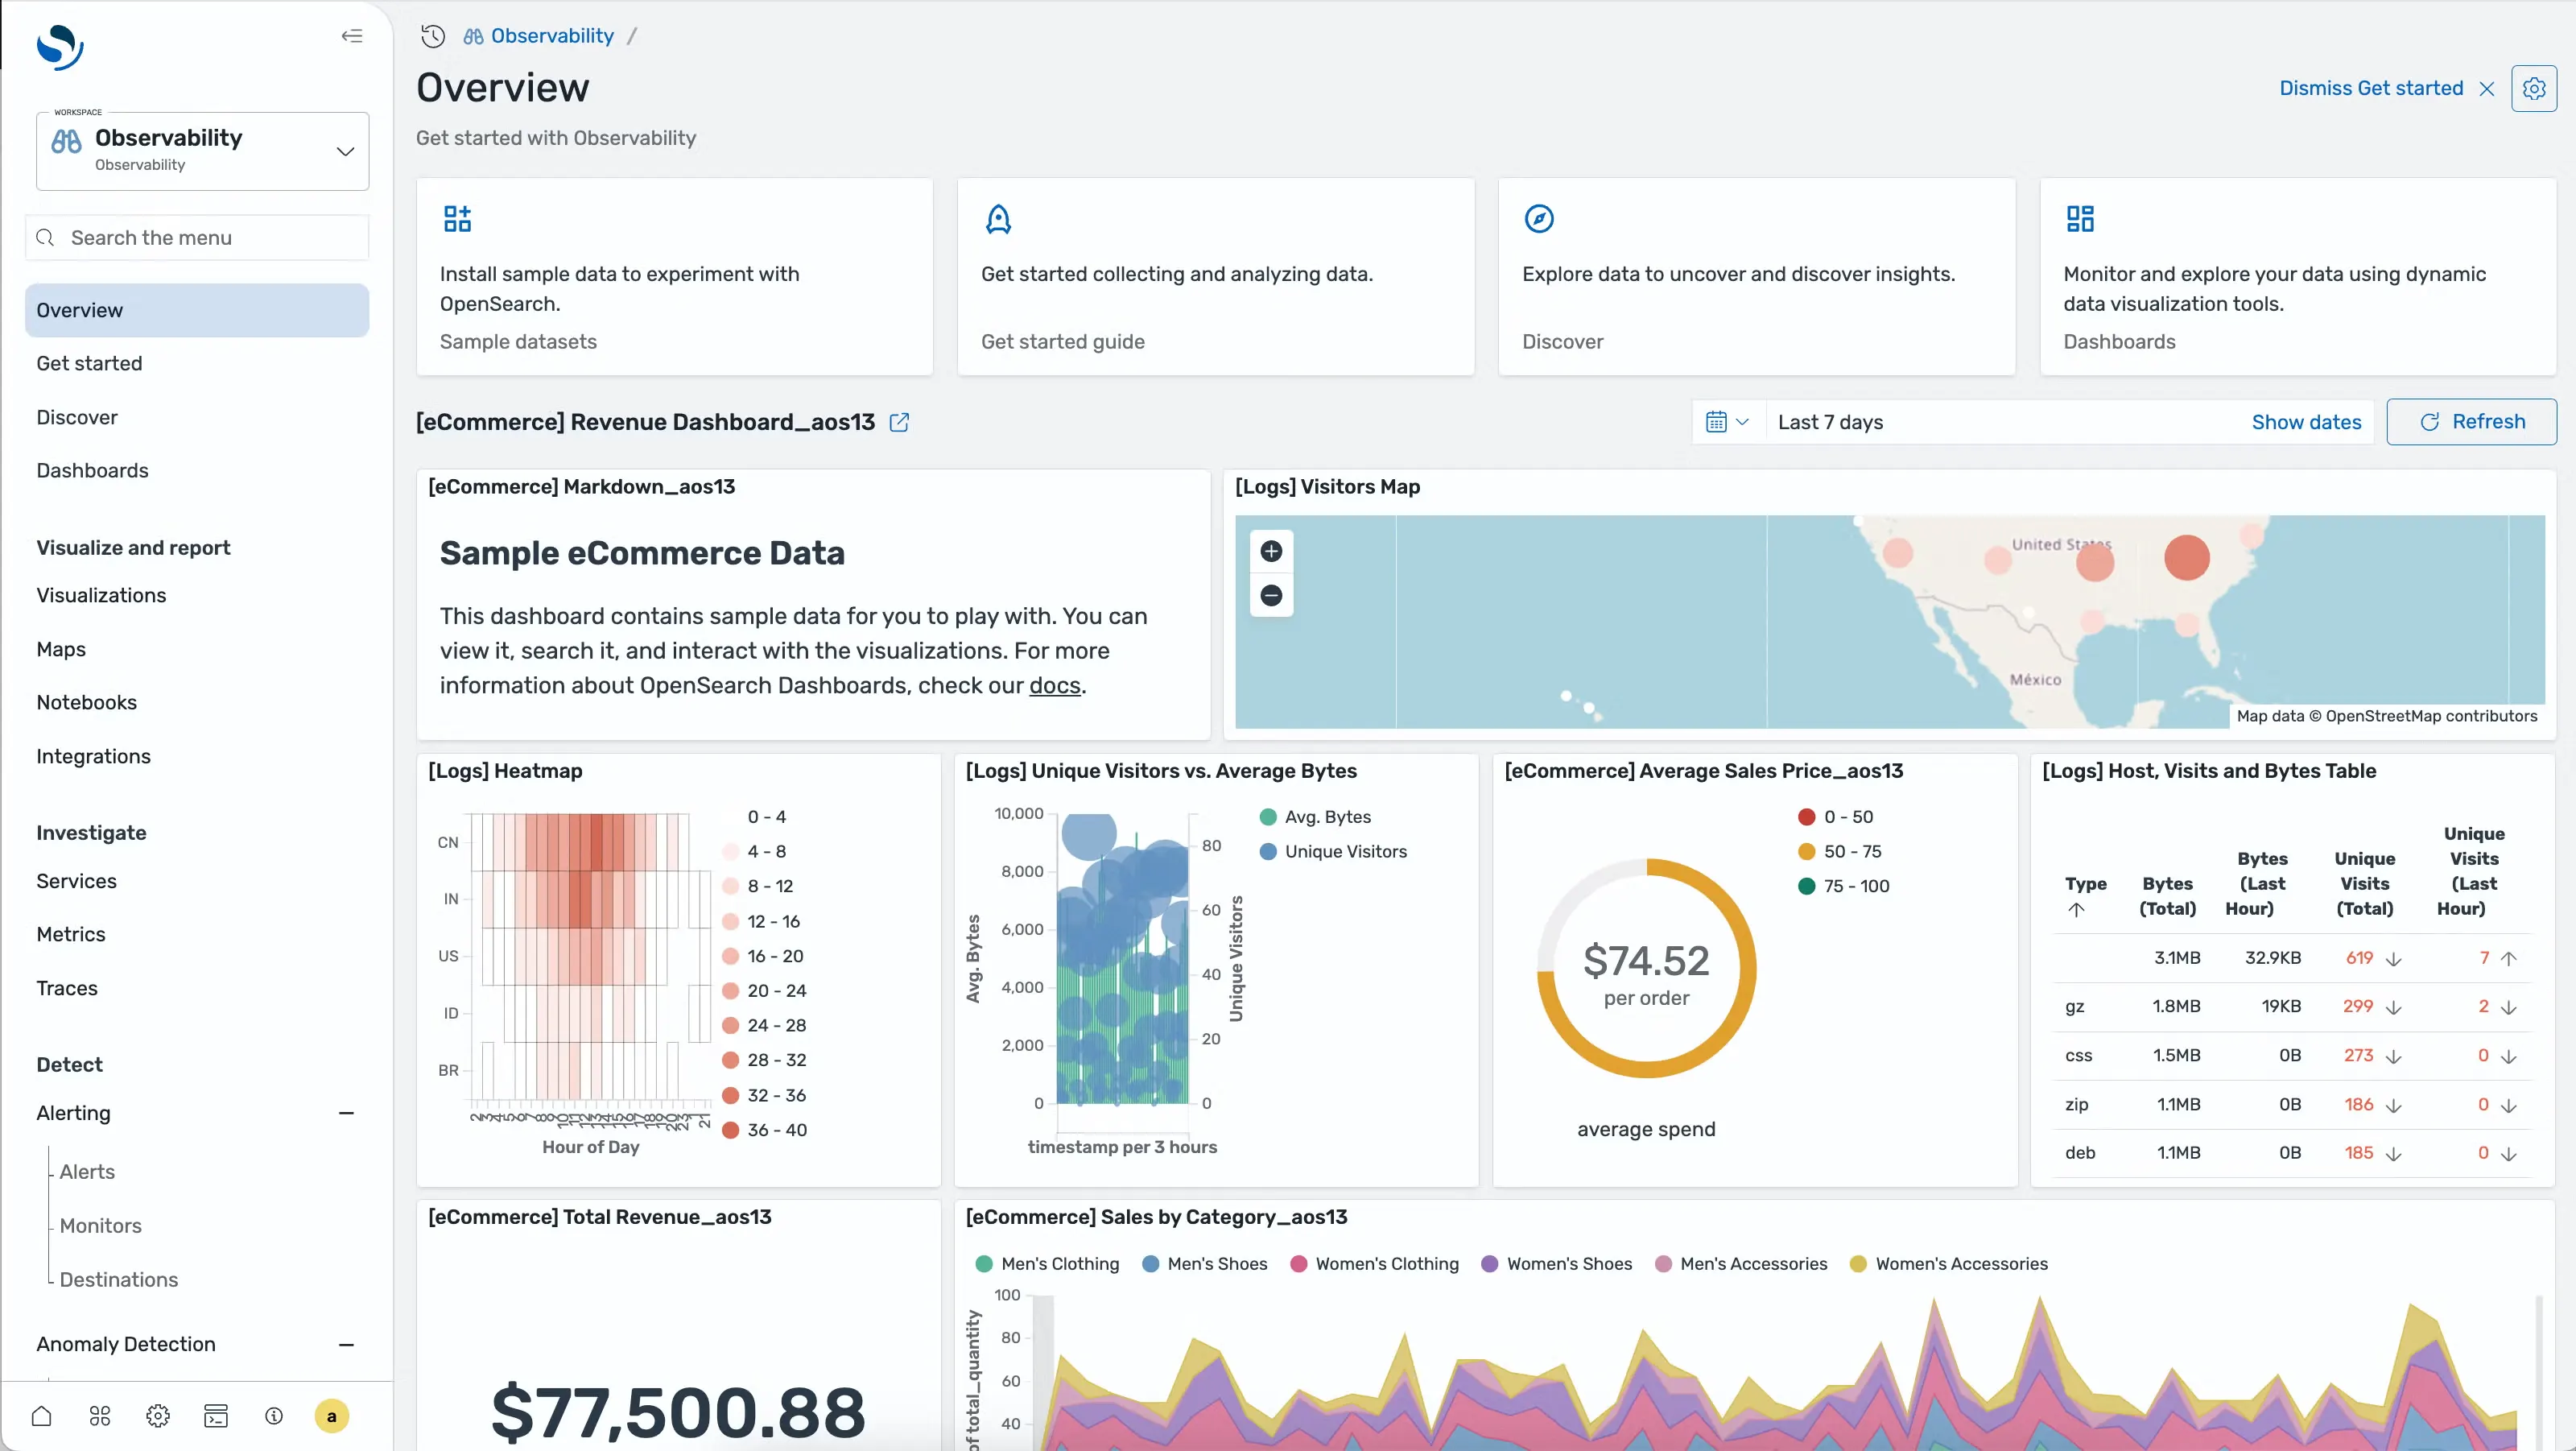
OpenSearch Observability is an open-source observability solution built on OpenSearch and OpenSearch Dashboards. It is not a standalone open-source observability platform in the same sense as Parseable or SigNoz—it is an extension of the OpenSearch ecosystem, adding trace analytics, log aggregation, and observability dashboards on top of an existing OpenSearch deployment.
For teams already running OpenSearch for search or log management, OpenSearch Observability avoids introducing a new backend to manage. It uses familiar Lucene-style query syntax, integrates with OpenSearch's index lifecycle management for retention control, and supports the OpenTelemetry data model for traces. Teams evaluating open-source observability platforms who are deeply committed to the OpenSearch or Elasticsearch ecosystem will find this the most natural path to adding observability workflows without a full platform migration.
Key features
- OpenSearch Dashboards for visualization
- Trace analytics with OpenTelemetry support
- Log aggregation and full-text search
- Index lifecycle management for retention
- Lucene-style querying (DQL)
- Integrations with Fluent Bit, Data Prepper, and other pipeline tools
Pricing
- Open-source: Free, self-hosted under Apache 2.0 license
- Amazon OpenSearch Service: Managed AWS offering with usage-based pricing
Pros
- Natural extension for teams already invested in the OpenSearch or Elasticsearch ecosystem
- Apache 2.0 license with no usage restrictions
- Strong indexing and full-text search performance on log data
- AWS managed service removes operational burden for cloud-hosted teams
Cons
- Not a full open-source observability platform for metrics—Prometheus or VictoriaMetrics still needed for metrics coverage
- JVM-based architecture adds memory overhead compared to Rust- or Go-based open-source observability platforms
- Shard and index management becomes complex at scale
- Index storage growth can become expensive without careful ILM tuning
8. Apache SkyWalking
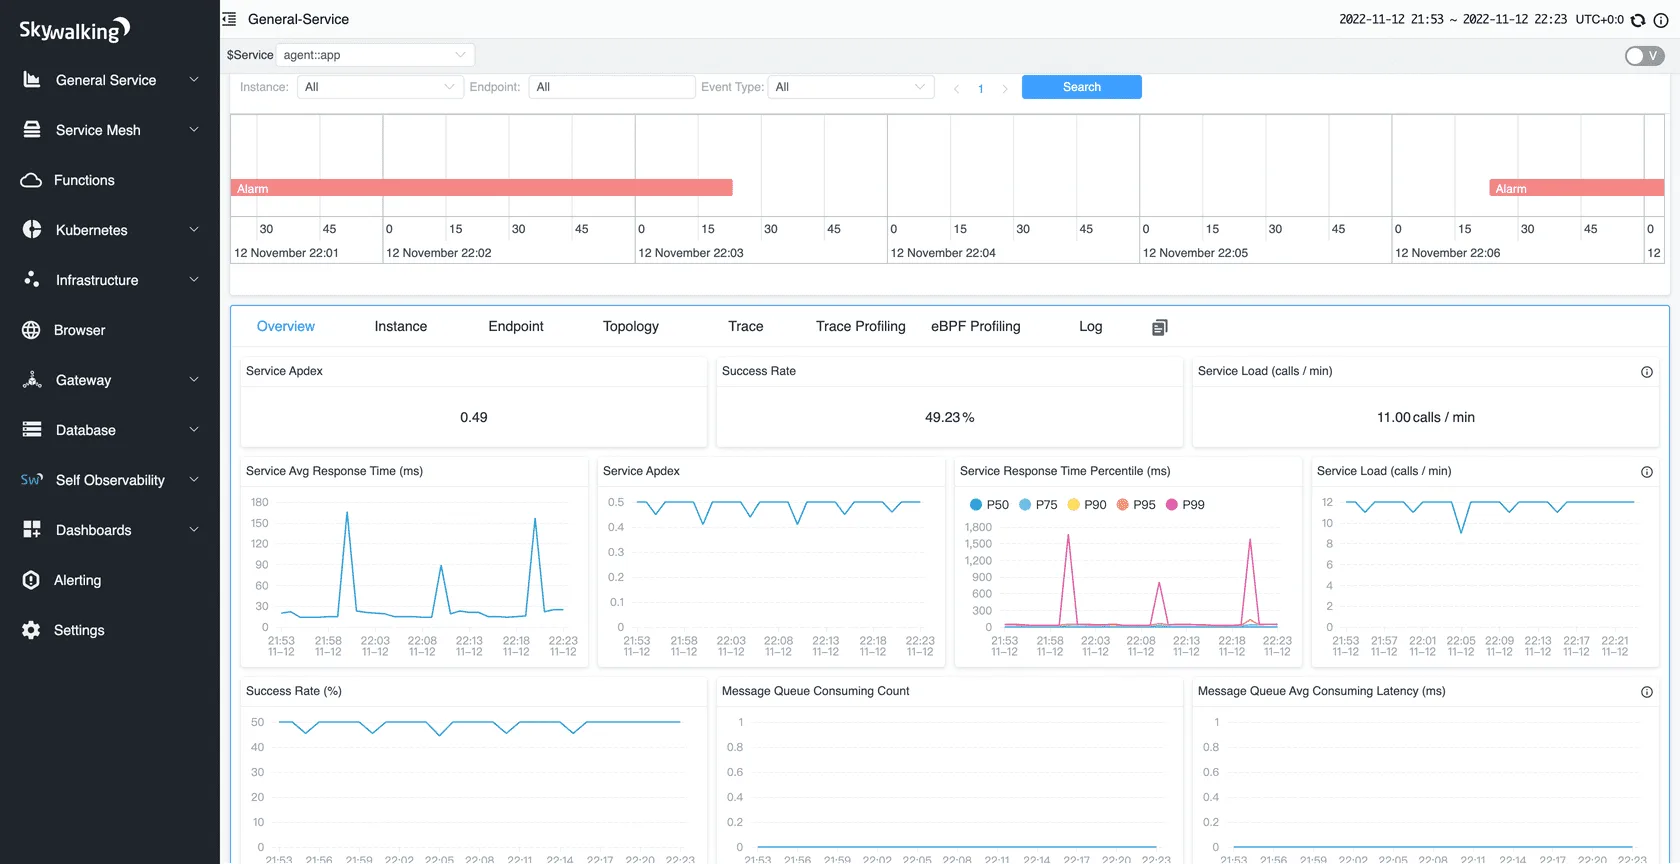
Apache SkyWalking is an open-source observability platform designed for distributed systems, microservices, and service mesh environments. It collects metrics, traces, and logs from a wide range of ecosystems including OpenTelemetry, Zipkin, Prometheus, Zabbix, and Fluentd—making it one of the most protocol-flexible open-source observability platforms in this guide.
SkyWalking's strongest differentiation as an open-source observability platform is its service topology and dependency mapping, which gives teams a visual understanding of how services interact, where latency originates, and which upstream or downstream dependencies are contributing to degradation. It uses BanyanDB as its native observability database, developed specifically for the data access patterns of an open-source observability platform at scale. Teams in Java-heavy microservices environments or running service meshes like Istio will find SkyWalking's instrumentation coverage and topology visualization more mature than most other open-source observability platforms.
Key features
- Distributed tracing across microservices and service meshes
- Service topology and dependency mapping
- Metrics, traces, and logs with multi-protocol ingestion
- OpenTelemetry, Zipkin, and Prometheus ecosystem support
- BanyanDB observability database
- UI for service health scoring and SLA tracking
Pricing
- Open-source: Free, self-hosted under Apache 2.0 license
Pros
- Best-in-class service topology maps among open-source observability platforms
- Broad protocol support reduces migration effort from Zipkin or Prometheus stacks
- Java-ecosystem integrations are particularly mature
- Apache project with stable governance
Cons
- Steeper onboarding curve than more developer-friendly open-source observability platforms
- UI is less polished than SigNoz, HyperDX, or Parseable
- Log analysis capabilities are less advanced compared to log-first open-source observability platforms
- BanyanDB is relatively new and less battle-tested than ClickHouse or Elasticsearch
9. VictoriaMetrics Stack: Best open-source observability stack for metrics-heavy teams
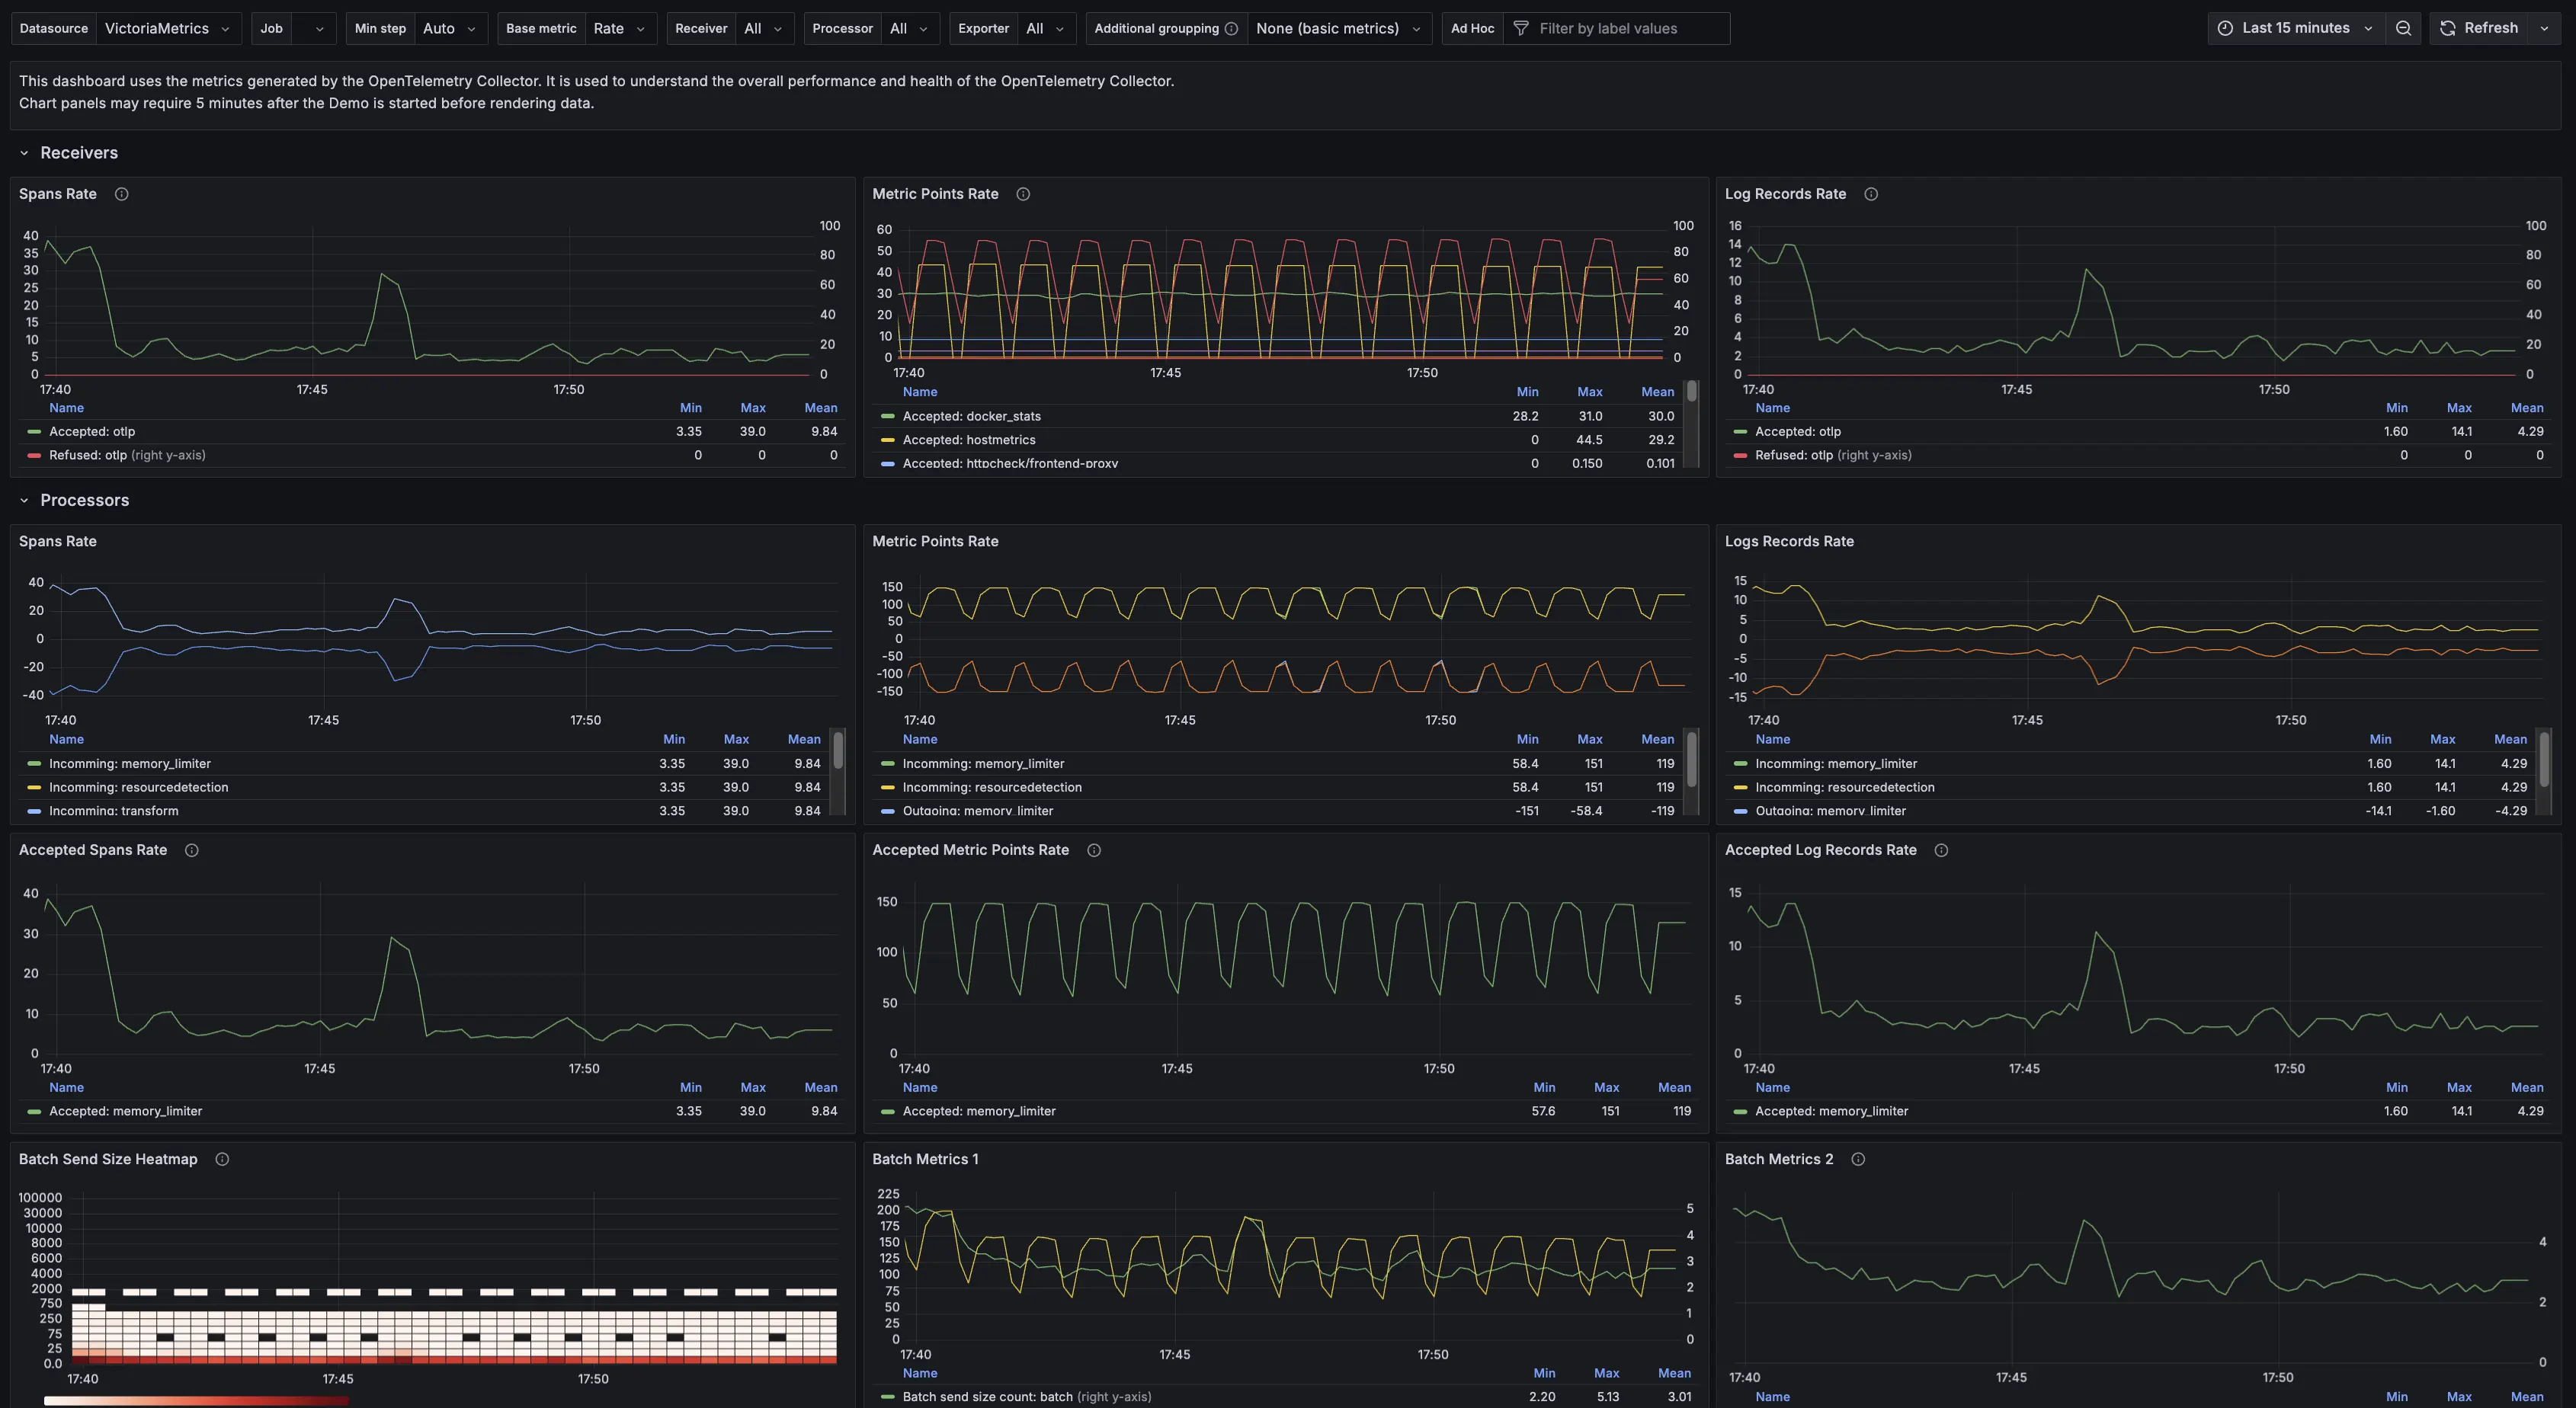
VictoriaMetrics Stack is the strongest open-source observability option for teams whose primary telemetry workload is metrics. VictoriaMetrics offers a drop-in Prometheus replacement with significantly better ingestion performance, lower memory usage, and more efficient long-term storage—making it a favored choice for large-scale open-source observability deployments where Prometheus's local storage limits become a bottleneck.
With the addition of VictoriaLogs, VictoriaMetrics Stack now covers two of the three core telemetry signals as a composable open-source observability stack. VictoriaLogs is positioned as an open-source, scalable logs solution for cloud, Kubernetes, and on-prem setups. For tracing, teams typically pair VictoriaMetrics with Grafana Tempo or Jaeger, which makes it a stack rather than a unified open-source observability platform. The full stack integrates with Grafana for dashboards and supports Prometheus remote-write, making it straightforward to layer into existing open-source observability architectures that are already Prometheus-based.
Key features
- VictoriaMetrics for high-performance Prometheus-compatible metrics
- VictoriaLogs for scalable log management
- Strong Prometheus remote-write compatibility
- MetricsQL query language (Prometheus-compatible superset)
- Efficient storage and ingestion for high-cardinality time series
- Grafana-friendly dashboards and plugin support
Pricing
- Open-source: Free, self-hosted under Apache 2.0 license
- VictoriaMetrics Cloud: Managed option with usage-based pricing
Pros
- Better resource efficiency than Prometheus at scale—relevant for large open-source observability deployments with millions of active time series
- VictoriaLogs brings log support without requiring Loki or Elasticsearch
- Prometheus-compatible, so migration from existing open-source observability stacks is low-friction
- Strong operational documentation and a growing community
Cons
- Native distributed tracing support requires adding Tempo or Jaeger—making it a stack, not a complete open-source observability platform
- MetricsQL is close to PromQL but not identical, which can cause confusion in mixed teams
- Less developer-friendly UI than full-stack open-source observability platforms like SigNoz or HyperDX
- Log analysis features in VictoriaLogs are less mature than Loki or OpenSearch
10. Uptrace
Uptrace is an open-source observability platform that centers on OpenTelemetry-based distributed tracing. It is designed for teams that want spans, service maps, trace grouping, and alerting in a lightweight, OpenTelemetry-native open-source observability platform—without the operational overhead of managing a full LGTM stack.
Uptrace supports all three telemetry signals—traces, metrics, and logs—and uses ClickHouse as its storage backend. As an open-source observability platform, it is particularly well suited to teams that have already standardized on OpenTelemetry instrumentation and want a simple, self-hostable UI for analyzing trace data alongside basic metrics and log visibility. Teams that require deep log analysis or rich metrics dashboards will likely find Uptrace insufficient as a standalone open-source observability platform, but for tracing-led debugging workflows it offers a focused and fast experience.
Key features
- OpenTelemetry-native distributed tracing
- Span groupings and trace explorer
- Metrics and dashboards
- Service maps and dependency graphs
- Alerting with multi-channel notifications
- ClickHouse storage backend
- Self-hosted and managed deployment options
Pricing
- Open-source: Free, self-hosted; source available on GitHub
- Uptrace Cloud: Managed option with usage-based pricing
Pros
- Clean, focused UI for trace-led observability investigations
- OpenTelemetry-first design means no proprietary instrumentation
- Lightweight relative to full open-source observability stacks
- ClickHouse backend supports fast queries on high-cardinality trace data
Cons
- Log analysis capabilities are less advanced than log-first open-source observability platforms
- Metrics coverage is less rich than VictoriaMetrics or Prometheus-native stacks
- Smaller community relative to SigNoz, Grafana, or Elastic-based open-source observability platforms
- License terms have evolved across recent versions—review the current repository license before deploying at scale
Conclusion
The open-source observability market in 2026 is more competitive than it has ever been. Teams no longer have to choose between paying for closed SaaS platforms or building fragmented stacks from Prometheus, Loki, Jaeger, and Grafana components. Unified open-source observability platforms like Parseable, SigNoz, and OpenObserve now cover logs, metrics, and traces in a single product, with deployment models ranging from single-node Docker to enterprise Kubernetes clusters.
The right open-source observability platform depends on your team's telemetry signals, query experience, storage cost tolerance, and operational capacity:
- Choose Parseable for cost-efficient unified telemetry on object storage with SQL querying across all signals.
- Choose Grafana LGTM for a composable stack with the largest open-source observability ecosystem and plugin marketplace.
- Choose SigNoz for an OpenTelemetry-native open-source observability platform that covers APM, logs, metrics, and traces in one UI.
- Choose OpenObserve for the lowest storage cost per GB on long-term telemetry retention.
- Choose ClickStack or HyperDX if session replay alongside logs and traces is a requirement.
- Choose VictoriaMetrics Stack if metrics are your primary signal and Prometheus storage scale is a bottleneck.
- Choose Apache SkyWalking for service topology mapping in microservices or service mesh environments.
- Choose OpenSearch Observability if your team is already committed to the OpenSearch ecosystem.
- Choose Uptrace for a focused, tracing-led OpenTelemetry experience with minimal operational overhead.
Whatever your starting point, the best open-source observability platforms share one characteristic: they give your team more control over telemetry data, more predictable costs at scale, and a clearer path to understanding production behavior—without depending entirely on a single vendor's pricing model or instrumentation ecosystem.

