

Introduction: Why “Unified Observability” Matters in 2025
Observability costs are up. Dashboards are multiplying. Teams want a unified, open-source observability platform that handles logs, metrics, and traces (and increasingly events/profiles) without vendor lock-in or runaway spend. This buyer’s guide cuts through the noise with a pragmatic ranking of the top options in 2025, anchored in scale, total cost of ownership (TCO), and day-2 operations.
This 2025 guide catalogs ten open-source platforms that organizations rely on today. We emphasize how they store data, how you query and correlate signals, and the operational trade-offs, so you can pick a solution that fits your scale, skill sets, and budget.
Below is a deeper, buyer-grade drill-down for each platform. For consistency, each entry includes: Architecture & signals, Core strengths, Watch-outs, and Quick start tips you can use in a 1–2 week pilot.
Top 10 Open Source Unified Observability Platforms in 2025
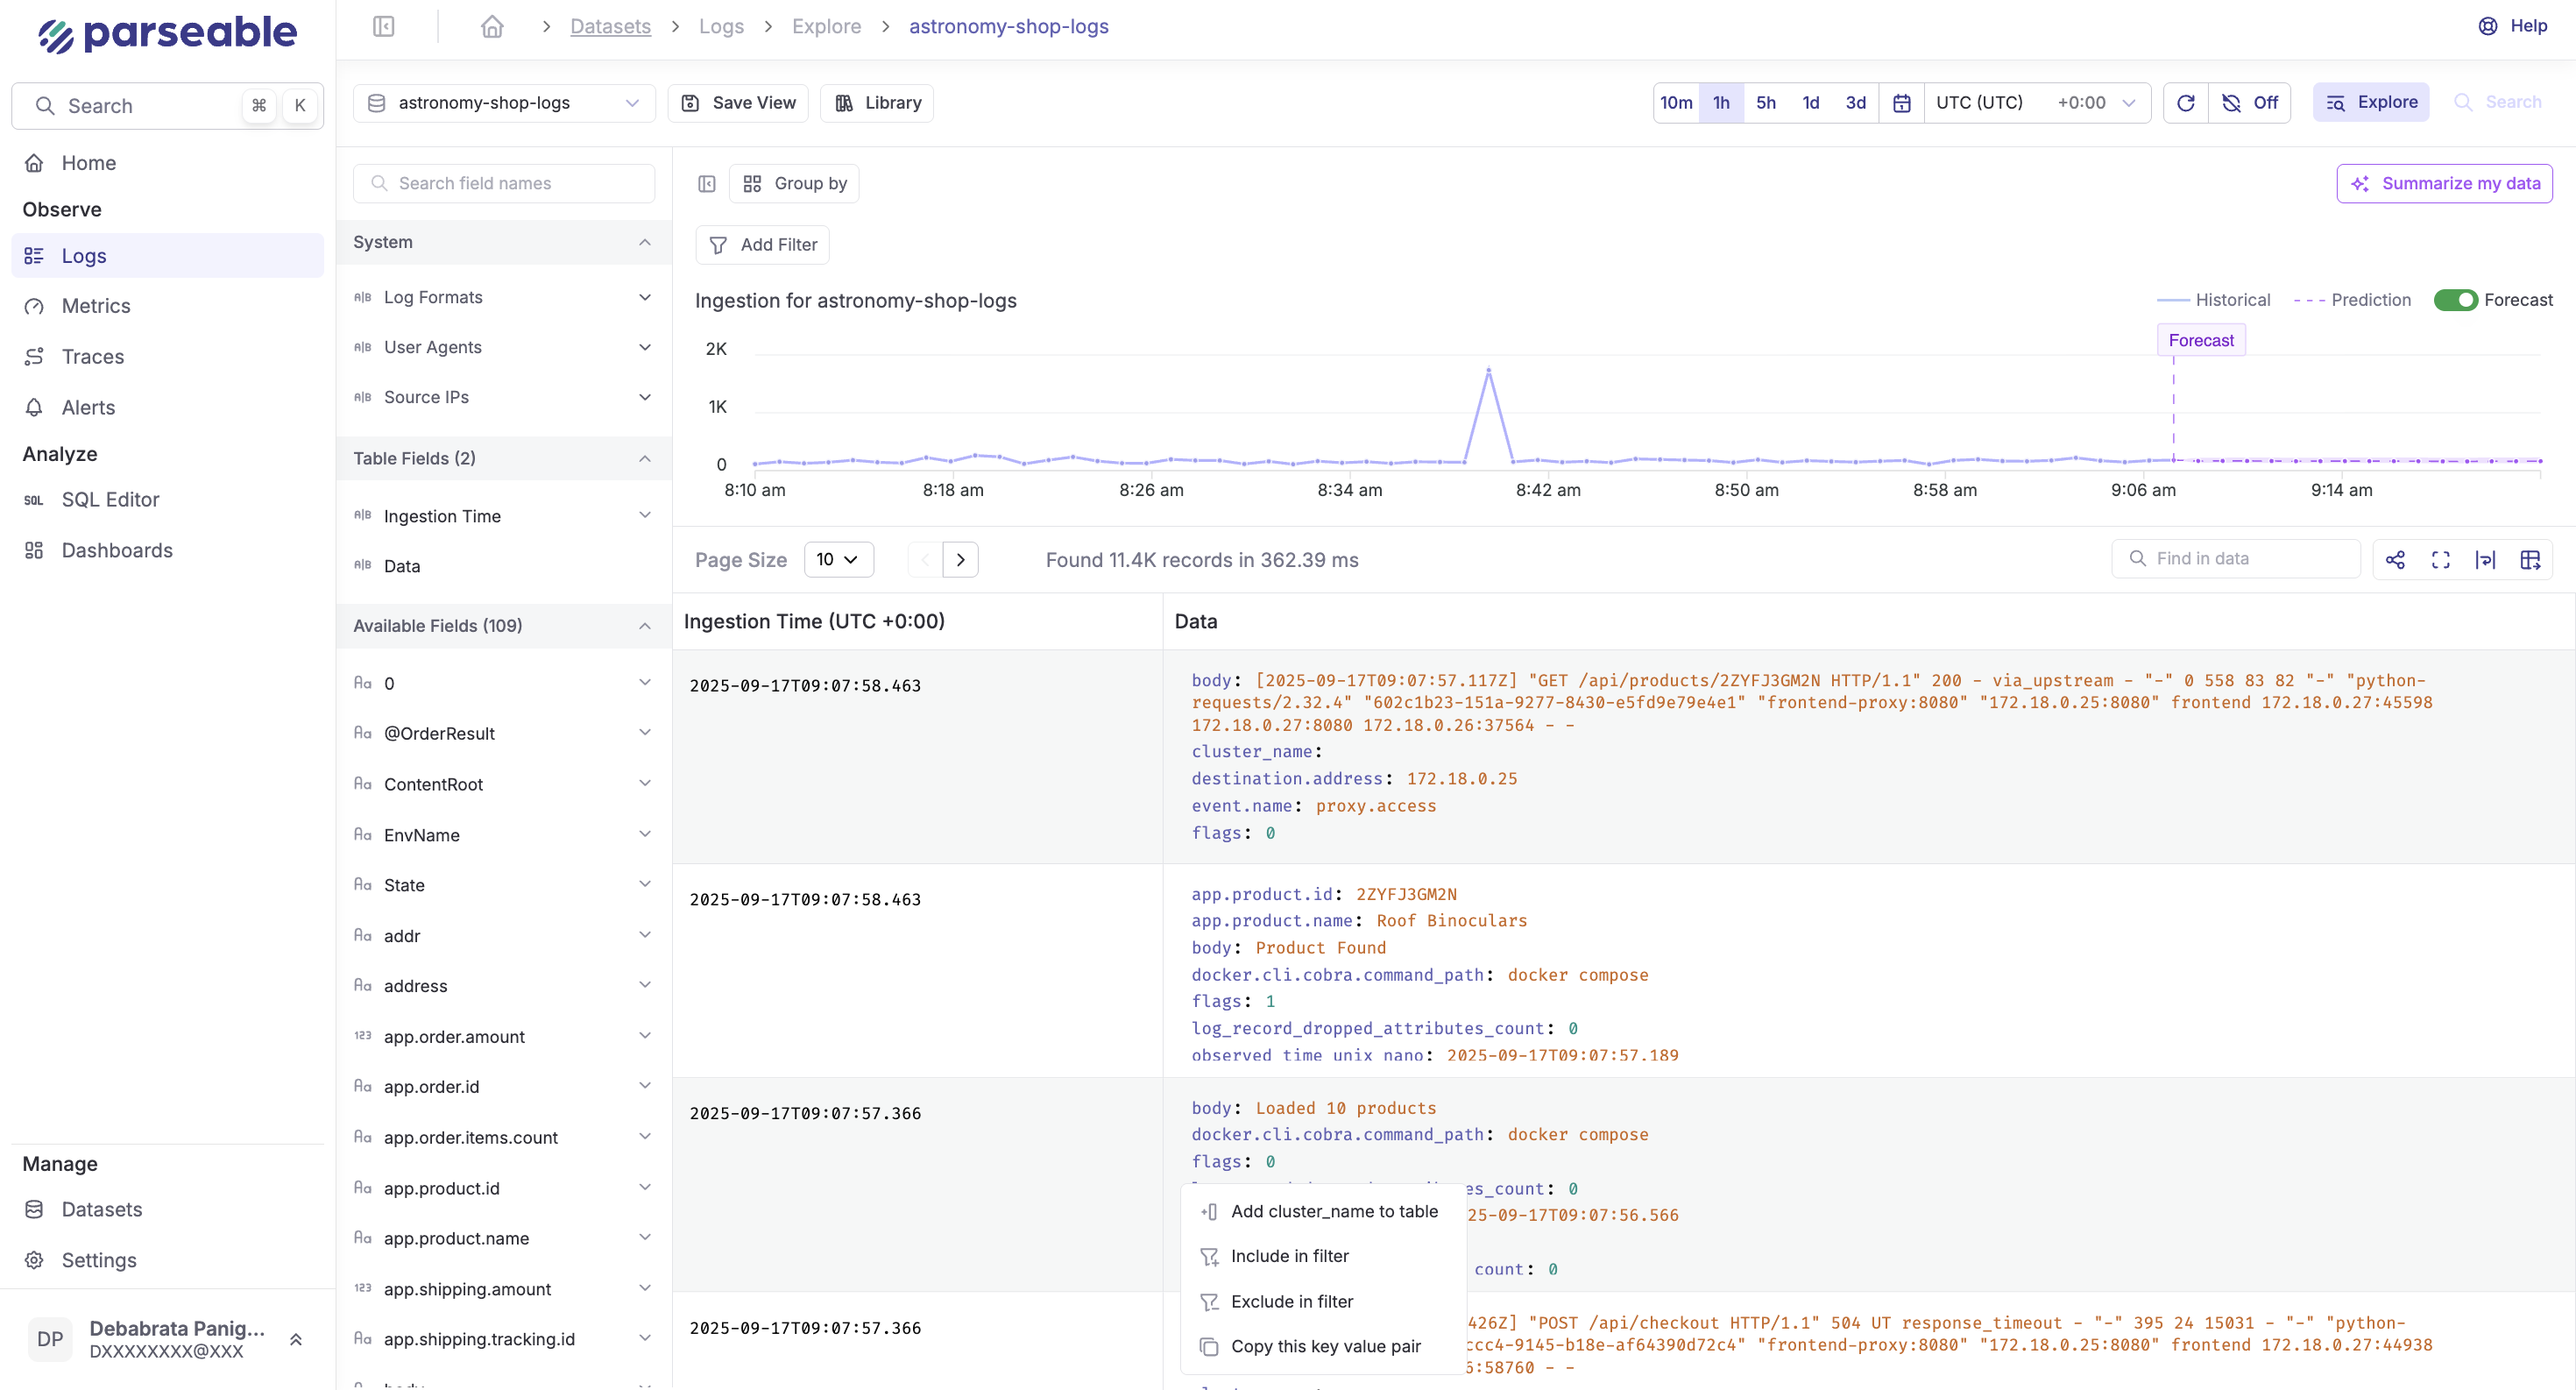
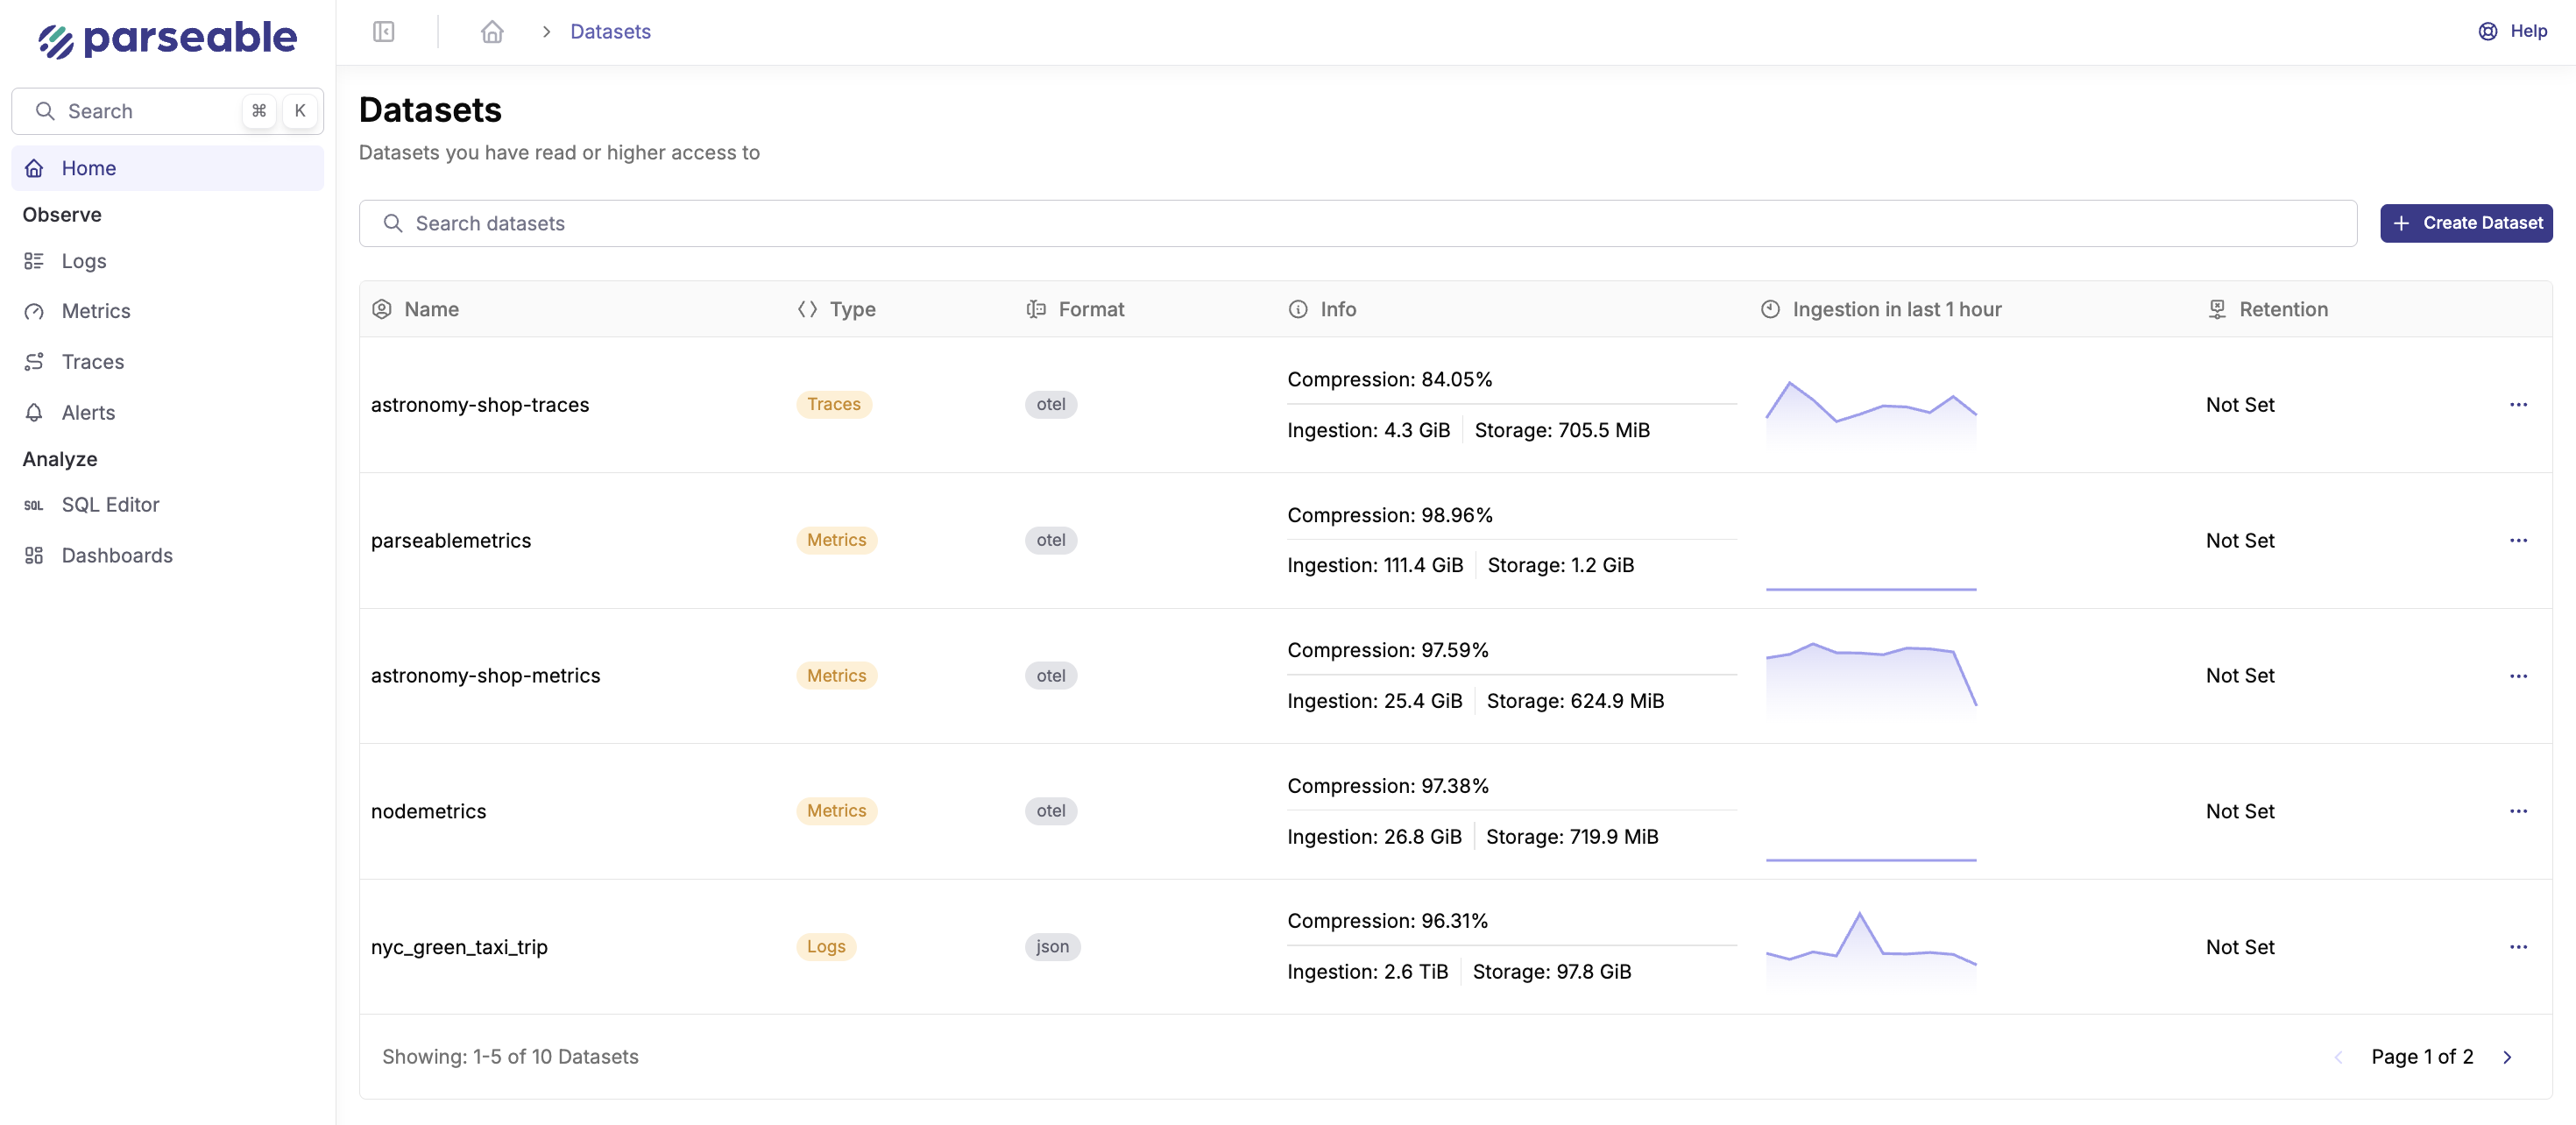
1. Parseable
Official Website: parseable.com License: AGPLv3
Architecture & signals: Object-storage-first (S3/GCS/Azure/MinIO) with columnar Parquet for logs/events and unified SQL-first querying across logs, metrics, and traces. Diskless, horizontally scalable ingest; built for real-time + historical analysis without hot disks. Unified platform targeting logs/metrics/traces with a “single-binary feel,” SQL-like queries, and OTel compatibility. Storage on object/disk depending on mode.
Core strengths
- Lowest-possible TCO at scale: Columnar compression + object storage lifecycle rules (tiering/retention) curb costs for multi-TB/day pipelines.
- Unified query surface: Correlate logs↔traces↔metrics with SQL (joins, filters, time windows) instead of juggling multiple query dialects.
- High-cardinality resilience: Columnar layout and predicate pushdown reduce wasteful scans vs. index-heavy row stores.
- Operational simplicity: Stateless ingest + object store means fewer moving parts; easy to run in K8s or VM fleets.
Watch-outs
- Some advanced UI/AI features may be enterprise-only; track roadmap/release notes.
- If you’re coming from index-heavy stacks, expect a brief query-shape learning curve (write fewer regexes, more selective SQL).
Quick start tips
- Pilot: Dual-write a noisy microservice + K8s control-plane metrics for 14 days.
- KPIs: Query P95 (<1–2s on common filters), storage $/TB-month (with 30–90d retention), and operator burn (hours/week).
- Schema hygiene: Normalize keys (
service,env,trace_id) and add lightweight enrichment at ingest.
2. Grafana LGTM
Official Website: grafana.com License: Core projects Grafana, Loki, Tempo and Mimir are AGPLv3; Pyroscope server is AGPLv3 (client integrations remain Apache-2.0).
Architecture & signals: Loki (logs), Grafana (UI), Tempo (traces), Mimir (metrics), plus Pyroscope (profiles). Each system scales independently; Grafana unifies visualization, alerting, SLOs.
Core strengths
- Breadth & community: Massive plugin ecosystem, great dashboards, contact points across infra/app layers.
- Battle-tested primitives: Prometheus-compatible metrics, Tempo for OTel traces, Loki for cost-aware log storage.
- Flexibility: Mix and match backends; storage backends commonly include object stores for cost control.
Watch-outs
- Operational complexity: Four+ backends to size, scale, patch, and back up; cross-product upgrades and retention policies take discipline.
- Multi-dialect queries: PromQL, LogQL, Tempo/TraceQL—powerful but context-switch heavy.
Quick start tips
- Pilot: Use your existing Prometheus → Mimir, OTel Collector → Tempo, and ship logs to Loki.
- Sane defaults: Start with global labels discipline; pre-build a few SLO dashboards to evaluate usefulness, not just look-and-feel.
3. ClickStax
ClickStax is a new offering after ClickHouse acquired HyperDX.
Official Website: clickhouse.com/clickstack License: Apache License 2.0
Architecture: An open-source, ClickHouse-powered full observability stack that ships out-of-the-box support for logs, metrics, traces, and session replay. It pairs a ClickHouse backend (columnar, compressed, vectorized) with a HyperDX-built UI that understands wide events, offers natural-language querying, alerting, and an OTel-native ingest path.
Core strengths: ClickStack lowers the barrier to “Observability 2.0” (wide-event, SQL-based observability) for teams that don’t want to hand-roll schemas, dashboards, and collectors on top of ClickHouse. You get fast search + fast aggregations over high-cardinality data without stitching multiple siloed stores.
Watch-outs:
- Turnkey OTel pipeline (collector → ClickHouse) with default schemas for L/M/T; bring-your-own schema when you need.
- Wide-event UI: NL queries, trace↔log correlation, session replay, and features like event deltas to surface regressions quickly.
- Elastic scale: Storage/compute separation (object storage), plus compute-compute separation for dedicated ingest vs. query pools.
- Semi-structured JSON support in ClickHouse with automatic column creation/type promotion for evolving telemetry.
- Open source first; designed to run self-hosted or on ClickHouse Cloud.
Quick start tips: Follow the Getting Started guide, dual-write a noisy service for 14 days, and compare P95 query latency, $/TB-month, and ops hours/week against your current stack.
4. HyperDx
Official Website: hyperdx.io License: MIT
Architecture & signals: Primarily logs + traces with session replay and app-debugging workflows; OSS backend with self-host option.
Core strengths
- App troubleshooting: Fast repro via replay, trace-linked logs, and error focus.
- Dev velocity: Shortens MTTR by making “what just happened?” obvious.
Watch-outs
- Metrics depth: If you need PromQL-grade infra metrics, plan to pair with a metrics backend.
- Governance: Review RBAC/multi-tenant needs for larger orgs when self-hosting.
Quick start tips
- Pilot: Instrument a user-facing service; validate you can jump from a 500 in logs → the exact user/session → the specific trace within seconds.
5. OpenSearch Observability
Official Website: opensearch.org License: Apache License 2.0
Architecture & signals: OpenSearch + Observability/Trace Analytics plugins for logs/metrics/traces, visualized in OpenSearch Dashboards. ILM for index lifecycle.
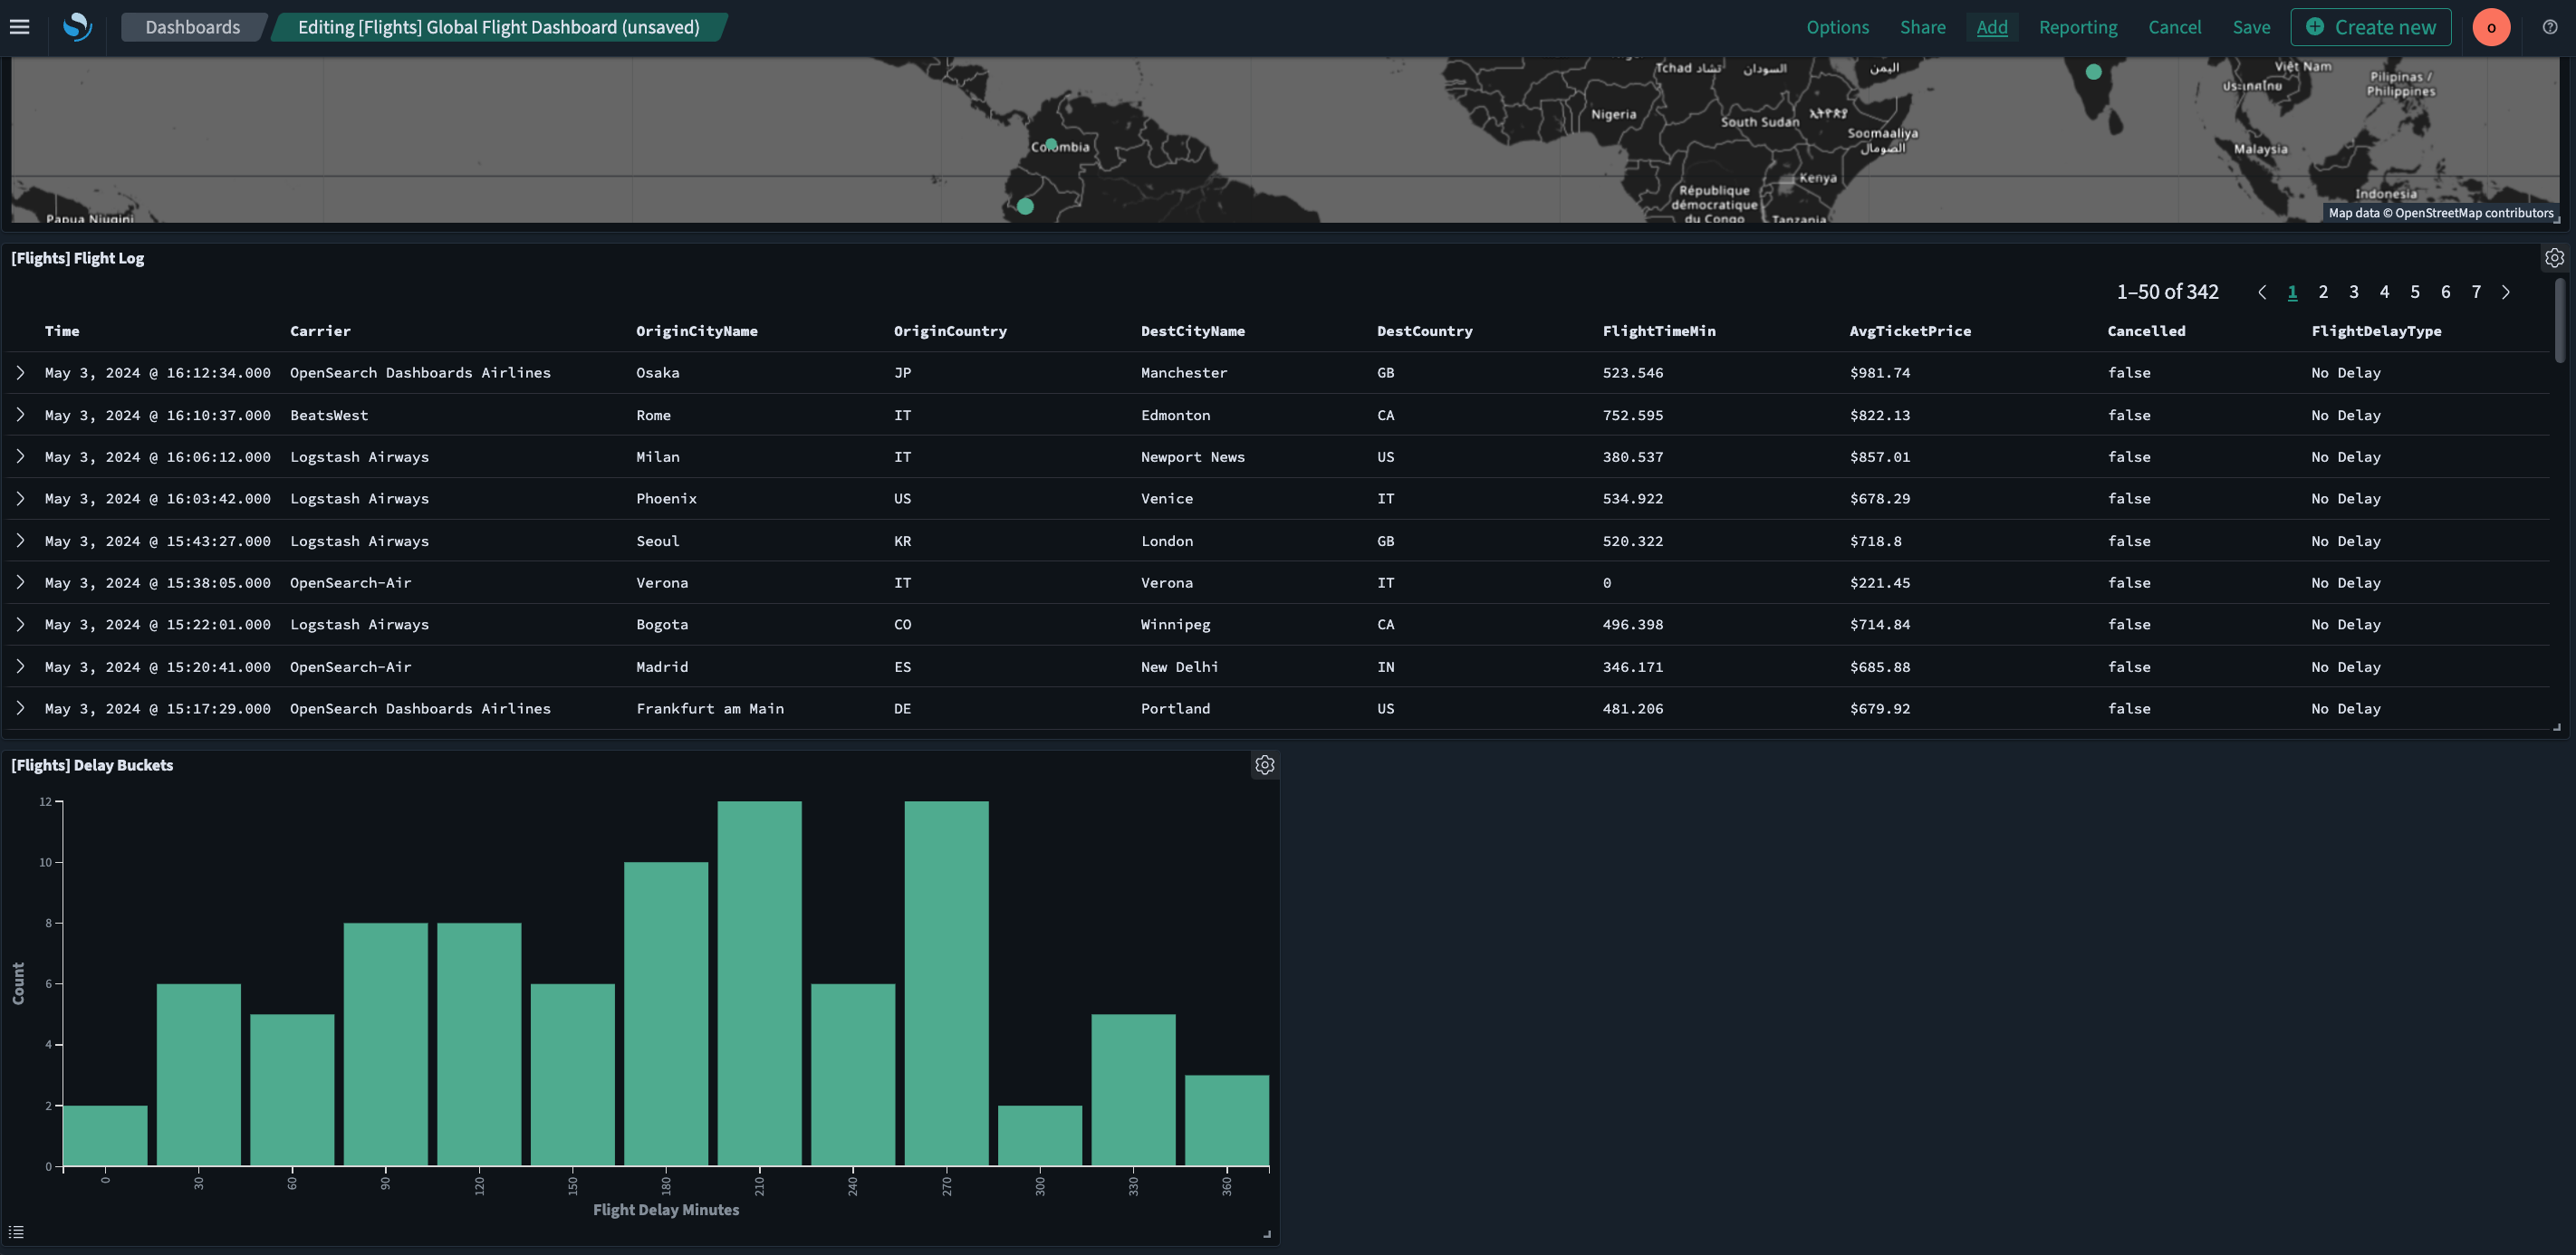
Core strengths
- Familiarity: If you’re already running OpenSearch, adding observability can be incremental.
- Search power: Lucene-style queries and dashboards suit teams with deep search habits.
- ILM: Mature index lifecycle and rollover controls.
Watch-outs
- Ops heaviness: JVM tuning, shard count, heap sizing, and snapshot management get intricate.
- Cost creep: Hot shards and replicas can quietly balloon storage and compute.
Quick start tips
- Pilot: Put hot logs on shorter hot phases + object store snapshots; implement strict index templates to control mapping drift.
6. Apache SkyWalking
Official Website: skywalking.apache.org License: Apache License 2.0
Architecture & signals: Tracing powerhouse with service map intelligence; bridges for metrics and logs via pluggable storage (e.g., Elasticsearch/OpenSearch, BanyanDB). Strong mesh/eBPF story.
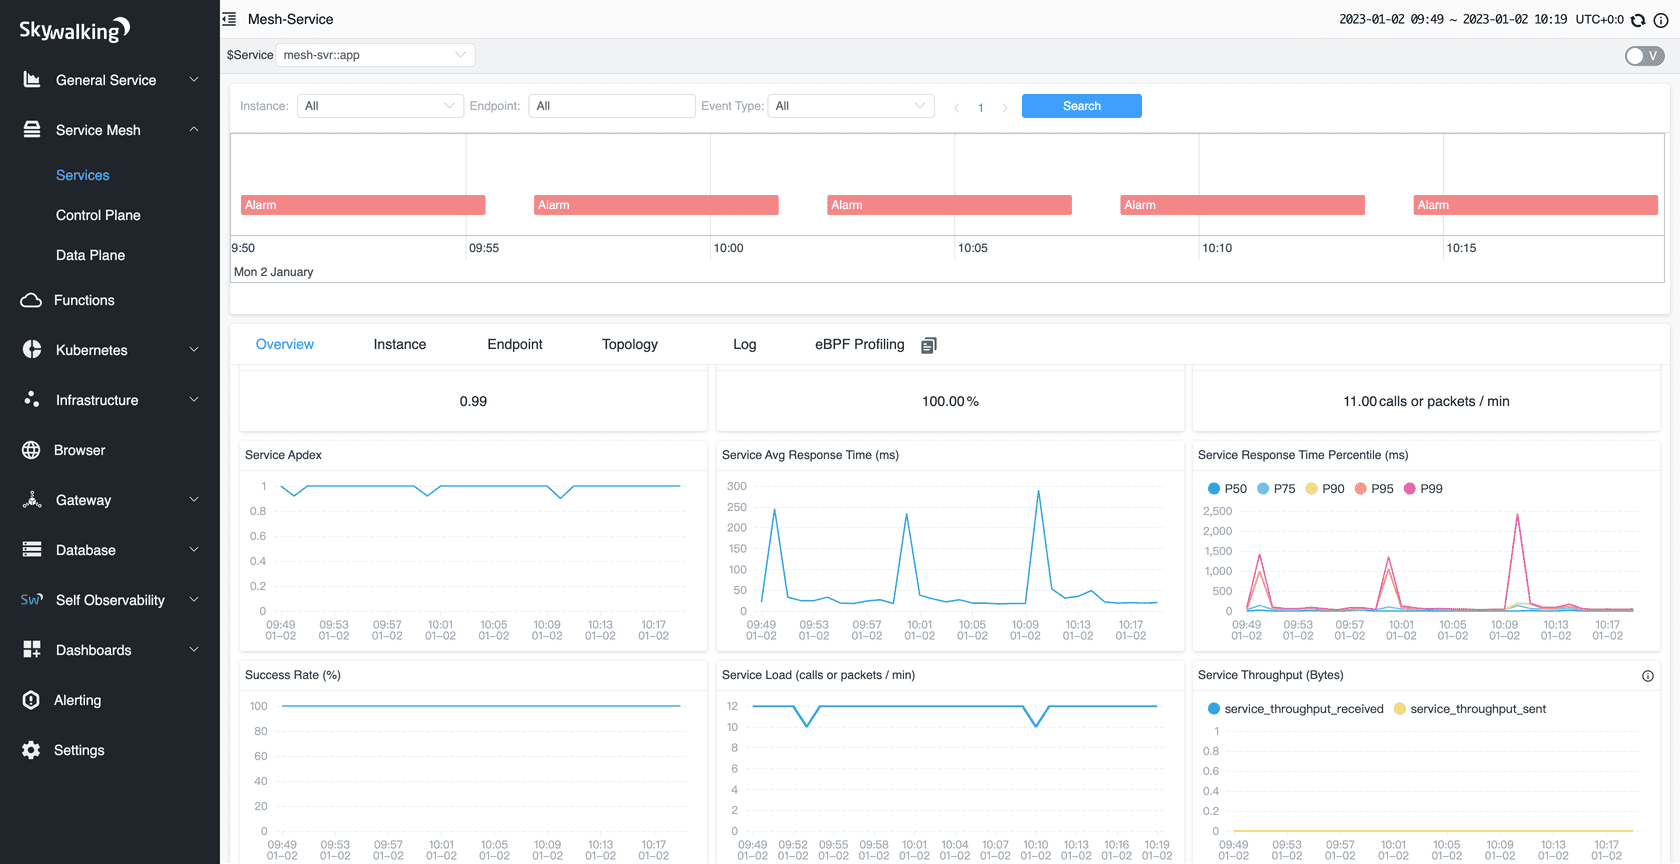
Core strengths
- Service-mesh clarity: Excellent at showing relationships, dependencies, and latency paths.
- Tracing depth: Rich span data, topology, and segment analysis.
- eBPF/mesh integrations: Insight without invasive code changes.
Watch-outs
- Unified maturity: Logs/metrics often come via adapters; ensure the “single-pane” experience meets your bar.
- Storage choice matters: Backing store selection shifts cost/perf characteristics.
Quick start tips
- Pilot: Focus on a microservices slice behind a service mesh; confirm trace-to-log correlation patterns you’ll standardize.
7. VictoriaMetrics Stack (VM + VictoriaLogs)
Official Website: victoriametrics.com License: Apache License 2.0
Architecture & signals: VictoriaMetrics for time-series metrics (remote-write compatible) + VictoriaLogs for logs; pair with Tempo/Jaeger for traces and Grafana for UI.
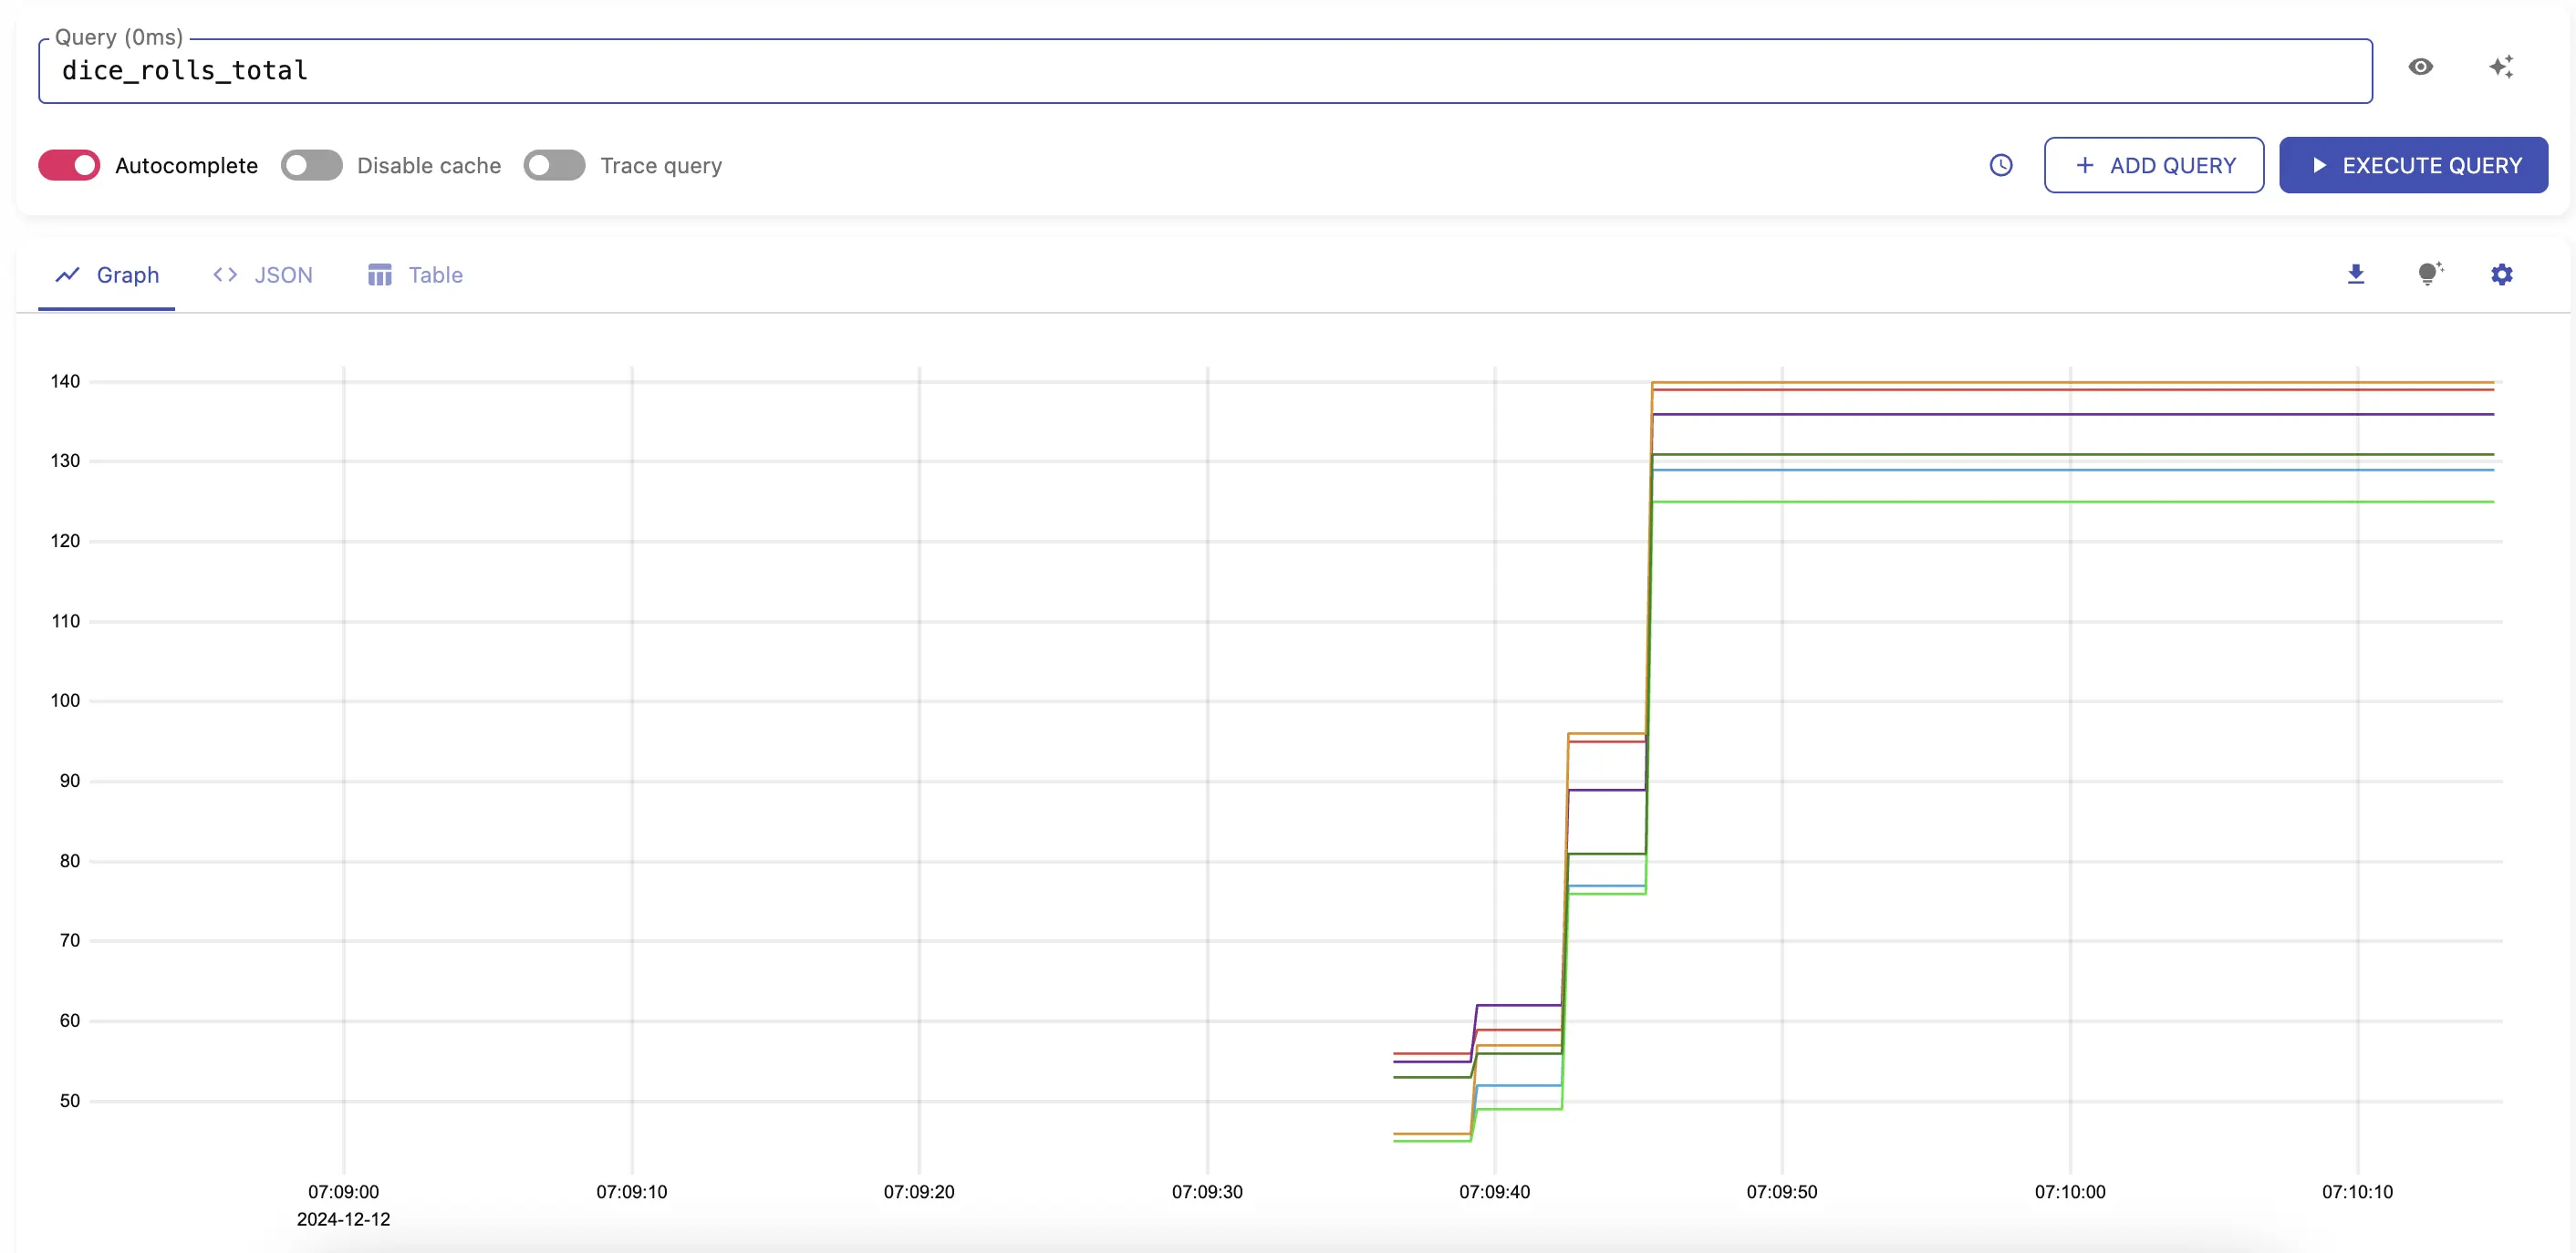
Core strengths
- Metrics at scale, cheaply: Highly efficient storage/ingest; a favorite for Prometheus consolidation.
- Composable “unified”: Add logs and traces with well-known companions; keep costs predictable.
- Ops-friendly: Simple deployment, clear resource curves.
Watch-outs
- DIY integration: You’ll stitch traces (Tempo/Jaeger) and visualization (Grafana) yourself.
- Logs maturity: Evaluate VictoriaLogs at your expected cardinality and retention; validate search ergonomics.
Quick start tips
- Pilot: Migrate a Prometheus remote-write stream to VM; add VictoriaLogs for application logs and Tempo for traces; test cross-links in Grafana.
8. Pixie
Official Website: pixie.dev License: Apache License 2.0
Architecture & signals: eBPF-based auto-telemetry for Kubernetes clusters (HTTP, SQL, DNS, CPU/memory insights, etc.) with rich live views and a scripting layer (PxL). Typically paired with a backend for long-term storage.
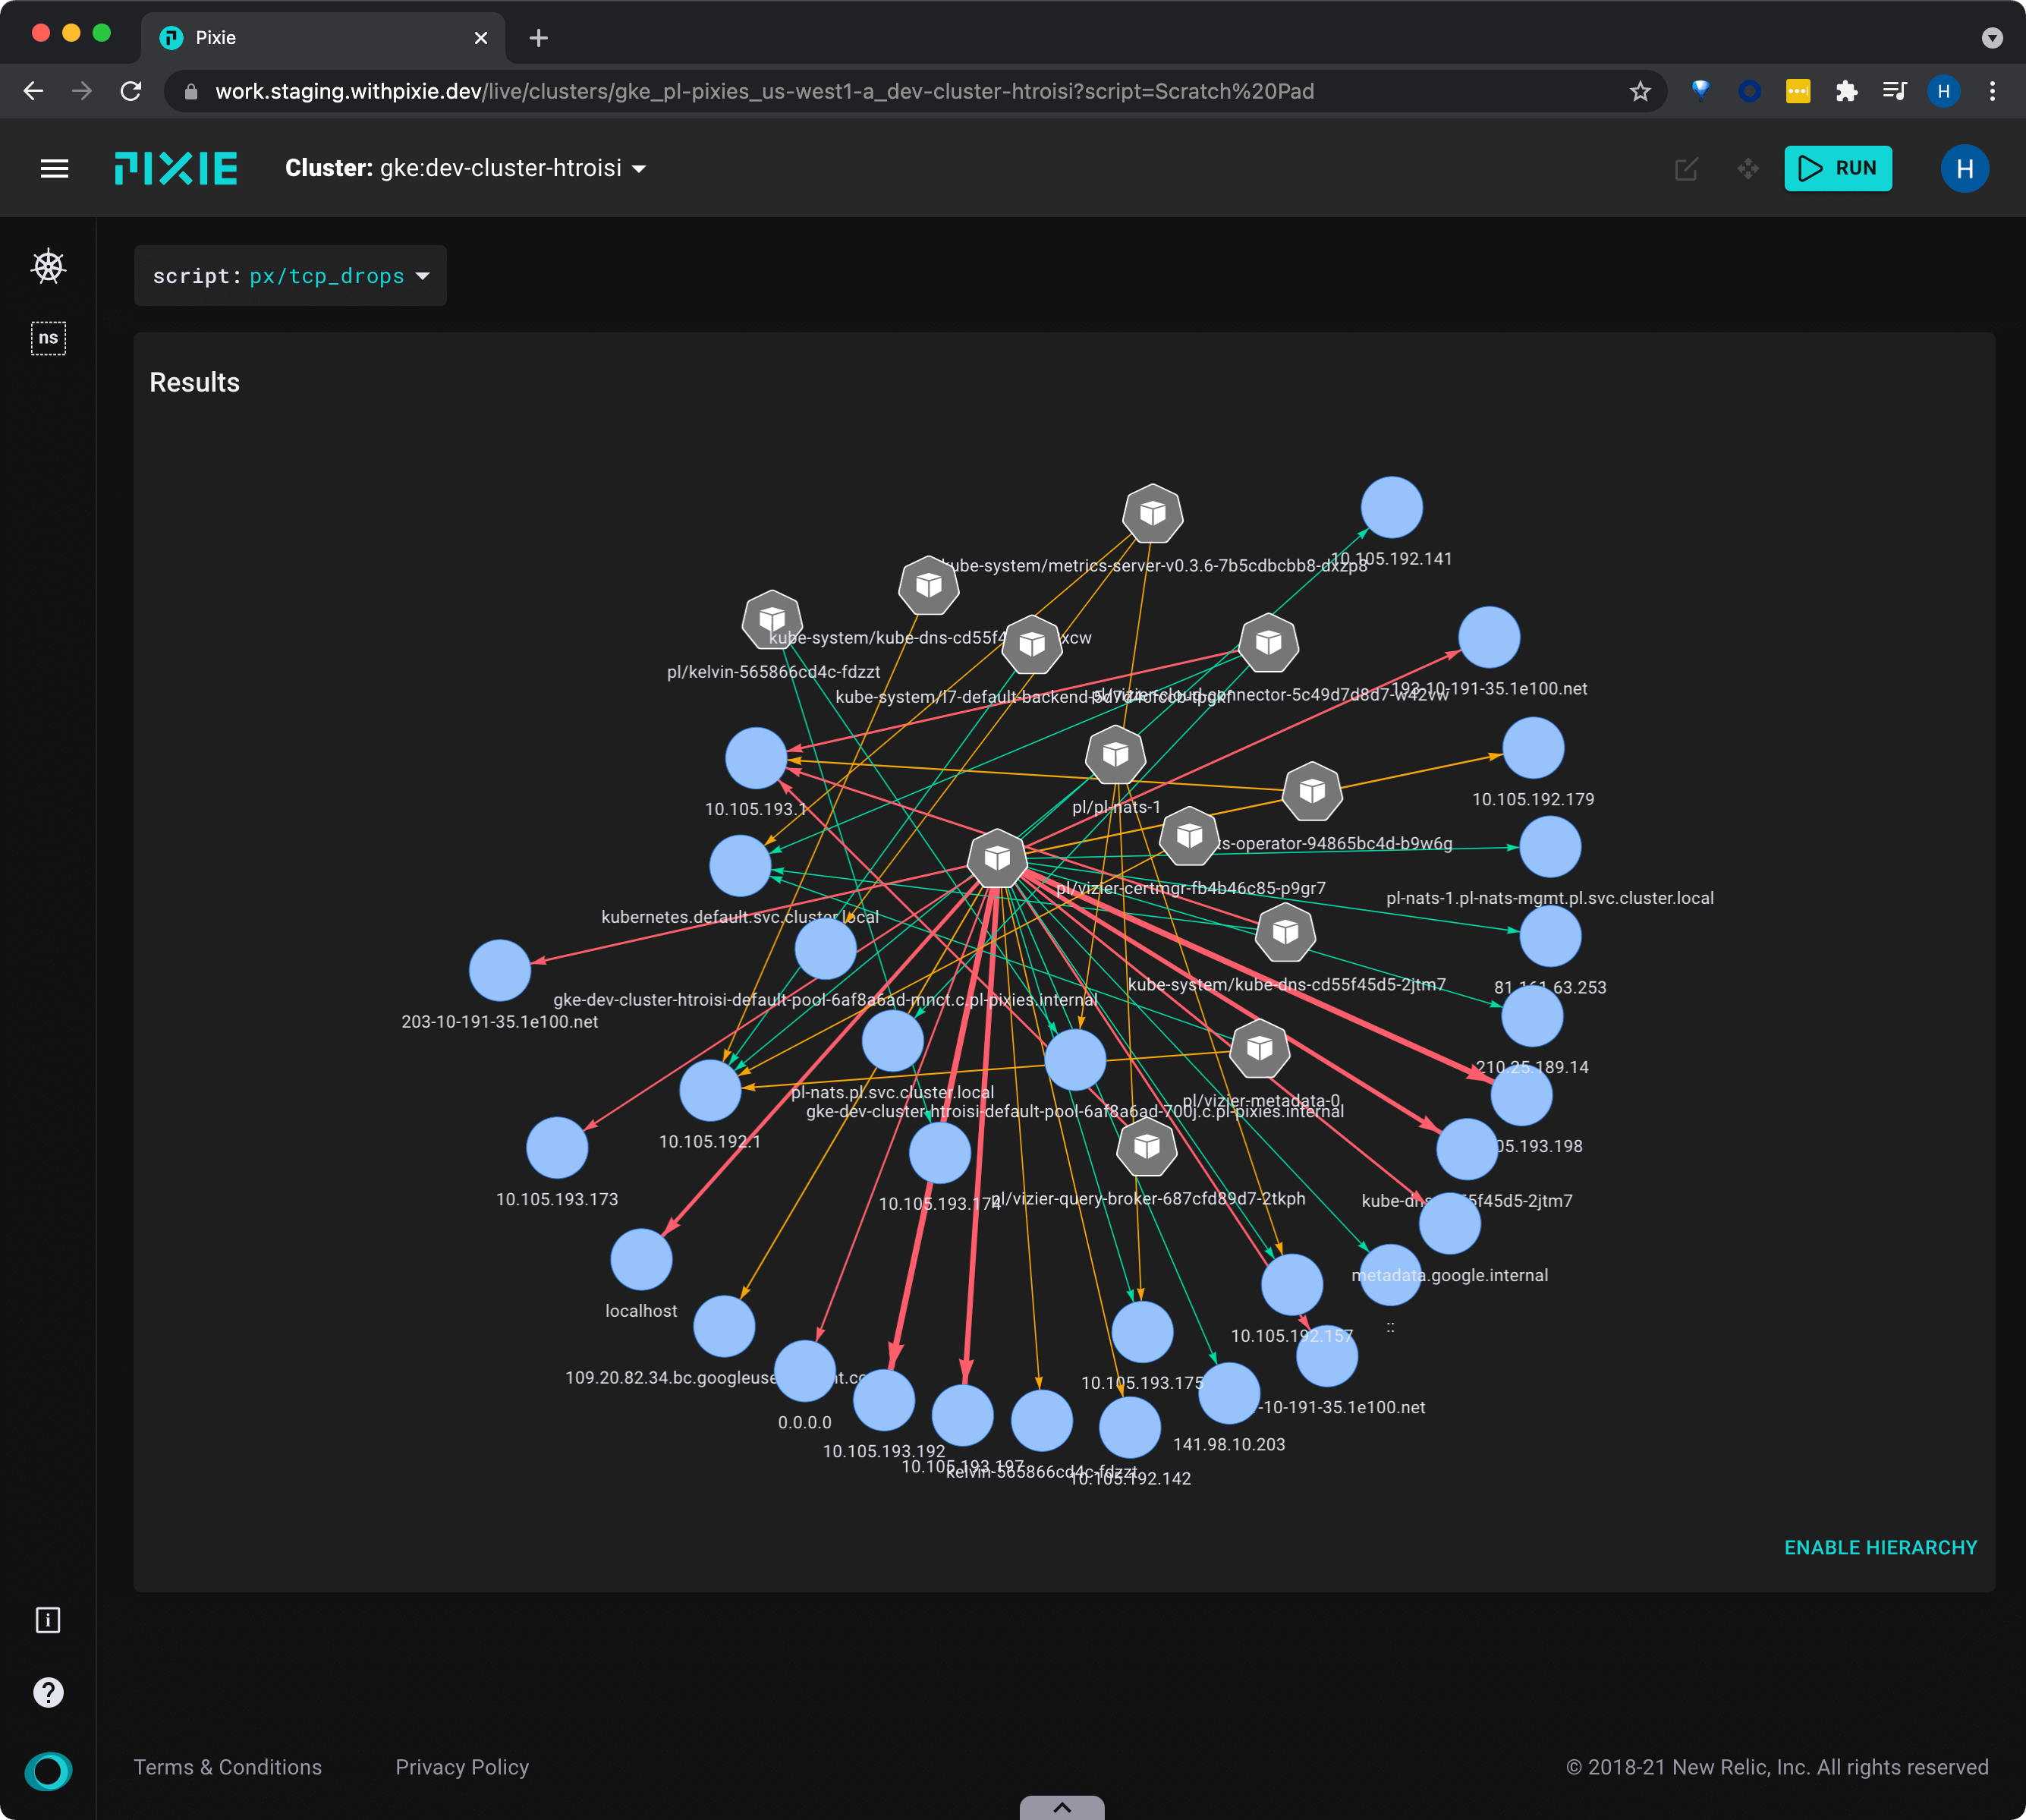
Core strengths
- Zero-touch visibility: Immediate insights without code changes—fantastic for cluster triage.
- Live debugging: High-fidelity, short-retention data is perfect for “right now” firefights.
- Developer empathy: Quick wins for SREs and app teams in K8s.
Watch-outs
- Retention: Designed for short-term/live data; plan exports for historical analysis.
- Scope: You’ll still want a persistent backend to unify logs/metrics/traces over months.
Quick start tips
- Pilot: Install Pixie on a staging cluster; verify scripts that surface N+1 calls, TLS issues, or payload anomalies; export key views into your long-term store.
9. Observatorium
Official Website: observatorium.io License: Apache License 2.0
Architecture & signals: A multi-tenant, centralized backend/API layer that unifies metrics/logs/traces via composable components (e.g., Thanos/Loki/Tempo-style stores) with authentication and tenancy boundaries baked in.
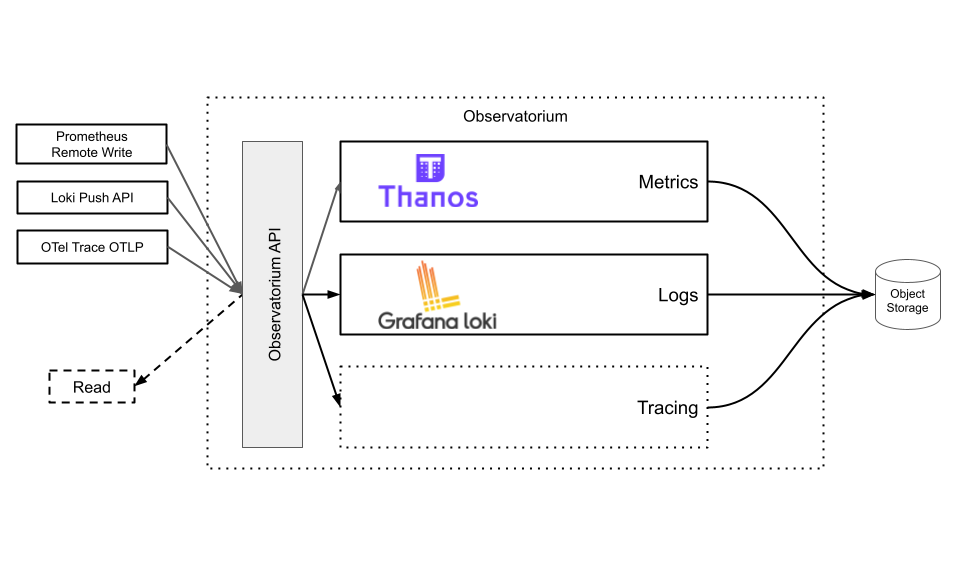
Core strengths
- Platform standardization: Great for internal platforms offering “observability as a service” to many teams.
- Governance: Per-tenant quotas, authn/z, and policy controls at the backend edge.
- Scale-out design: Built to aggregate signal backends behind a stable API.
Watch-outs
- Engineering investment: Requires SRE maturity to operate and evolve; UI is whatever you put in front (Grafana, etc.).
- Procurement of pieces: You’ll still manage the underlying signal stores and upgrades.
Quick start tips
- Pilot: Stand up a minimal multi-tenant slice for 2–3 teams; enforce quotas; measure onboarding friction and cross-team isolation.
10. Uptrace
Official Website: uptrace.dev License: AGPLv3
Architecture & signals: Tracing and metrics with distributed tracing, service maps, and alerting; self-hosted backend with optional SaaS.
Core strengths
- Tracing depth: Rich span data, topology, and segment analysis.
- Service-mesh clarity: Excellent at showing relationships, dependencies, and latency paths.
- eBPF/mesh integrations: Insight without invasive code changes.
Watch-outs
- Unified maturity: Logs/metrics often come via adapters; ensure the “single-pane” experience meets your bar.
- Storage choice matters: Backing store selection shifts cost/perf characteristics.
Quick start tips
- Pilot: Focus on a microservices slice behind a service mesh; confirm trace-to-log correlation patterns you’ll standardize.
Conclusion
In 2025, a unified open-source observability platform must deliver multi-signal visibility with cohesive queries and sane economics. Parseable leads this list for its object-store-first, columnar approach and SQL-first experience that makes large-scale exploration fast and affordable. Grafana’s ecosystem is unbeatable for breadth and visualization; SigNoz and HyperDX shine for app teams; SkyWalking and Pixie excel in K8s; VictoriaMetrics and Observatorium reward platform rigor.
A pragmatic adoption path:
- Pilot with dual-write on a noisy service for 2–4 weeks.
- Track P95 query latency, $ / TB-month, and operator hours/week.
- Standardize on OTel everywhere to stay portable.
- Lock in retention policies by signal and by environment early.
If your bias is lowest TCO + fastest ad-hoc correlation across logs, metrics, and traces, Parseable’s object-store, Parquet, and SQL-first design is purpose-built for this moment. Run a quick pilot and let the latency and storage math make the case.

