

vLLM OpenTelemetry: Monitor LLM Inference Metrics with Parseable
Production vLLM deployments need continuous visibility into request latency, token throughput, KV cache pressure, queue depth, and GPU cost. Without it, teams have no reliable way to detect degradation, optimize throughput, or understand what a deployment actually costs per request.
vLLM OpenTelemetry monitoring connects three components: vLLM's Prometheus-compatible /metrics endpoint, an OpenTelemetry Collector that scrapes and forwards those metrics, and Parseable as the storage backend for SQL queries, dashboards, and alerts.
This guide walks through the complete setup. You'll configure a metrics proxy to normalize vLLM's metric format, connect an OpenTelemetry Collector, send metrics to Parseable, and build a working dashboard that covers latency, token throughput, KV cache utilization, and GPU cost estimation.
What you'll build: a vLLM OpenTelemetry pipeline
The end-to-end vLLM OpenTelemetry pipeline flows like this:
vLLM /metrics endpoint
  → Metrics proxy (normalizes Prometheus format)
  → OpenTelemetry Collector (scrapes and exports)
  → Parseable (stores, queries, dashboards, alerts)
By the end of this guide, you will have:
- A running metrics proxy that sanitizes vLLM metric names for OTel compatibility
- An OpenTelemetry Collector config that scrapes vLLM metrics every 2 seconds
- A Parseable stream receiving structured telemetry
- SQL queries for latency, token throughput, KV cache, and GPU cost
- Dashboard panels for request volume, p95/p99 latency, and queue pressure
- Alert rules for high latency, cache saturation, and request failures
Quick answer: does vLLM support OpenTelemetry?
Yes, but with two distinct paths worth understanding before you start.
vLLM Prometheus metrics (what this guide covers): vLLM exposes production inference metrics through a Prometheus-compatible /metrics endpoint on its OpenAI-compatible API server. These include request-level histograms, token counters, KV cache gauges, and queue depth metrics. To collect them through an observability pipeline, you scrape that endpoint — which is exactly what the OpenTelemetry Collector does in this guide using its Prometheus receiver or a metrics proxy.
vLLM OpenTelemetry tracing (separate path): vLLM also supports native OpenTelemetry tracing through the --otlp-traces-endpoint flag and OTEL_SERVICE_NAME environment variable. This produces spans for individual inference requests and is useful for request-level debugging, not aggregate metric monitoring. See the optional tracing section at the end of this guide.
In most production setups, metrics come from /metrics and traces come from the OTLP traces endpoint. They are independent paths. This guide focuses on the metrics path.
To confirm your vLLM server is exposing metrics:
curl http://your-vllm-host:8000/metricsYou should see Prometheus-formatted output with metrics like vllm:num_requests_running, vllm:gpu_cache_usage_perc, and vllm:e2e_request_latency_seconds.
What is vLLM and why monitor inference?
vLLM for fast LLM inference
vLLM is a high-throughput inference engine for large language models. It implements PagedAttention for efficient KV cache management, supports continuous batching, and exposes an OpenAI-compatible REST API. Teams running open-weight models like Llama, Mistral, Qwen, or custom fine-tunes on GPU infrastructure typically use vLLM as the serving layer.
Because vLLM handles request scheduling, batching, cache eviction, and token generation, it surfaces a rich set of production metrics that map directly to user-visible behavior.
Why inference monitoring is different
Inference workloads have distinct failure modes compared to standard web services:
- Time to first token (TTFT): Long queuing, large prompt batches, or KV cache pressure causes TTFT to spike before overall latency degrades.
- Inter-token latency: Generation speed depends on batch size, model size, and GPU utilization. Slow inter-token latency is user-visible.
- KV cache utilization: When the KV cache fills up, vLLM preempts requests. High
vllm:kv_cache_usage_percpredicts imminent throughput drops. - Queue depth:
vllm:num_requests_waitingrising faster thanvllm:num_requests_runningindicates the server can't absorb incoming traffic. - Token volume vs request count: A request that generates 5 tokens costs far less than one generating 2,000 tokens. Cost analysis requires tracking token volume, not just request count.
- GPU utilization and cost: Without consistent GPU utilization metrics, cost-per-request estimates have no foundation.
Standard latency and error-rate monitoring misses most of these. vLLM observability requires tracking all of them together.
Architecture overview: vLLM, OpenTelemetry Collector, and Parseable
How the telemetry flow works
vLLM server
  ↓  exposes /metrics (Prometheus format, colons in metric names)
Metrics proxy (proxy.py)
  ↓  sanitizes names (colons → underscores), re-exposes on :9090
OpenTelemetry Collector
  ↓  scrapes :9090 every 2s, batches, exports via OTLP HTTP
Parseable
  ↓  receives OTLP metrics, stores in vLLMmetrics stream
SQL queries / dashboards / alerts
vLLM metric names use colons as separators (e.g., vllm:e2e_request_latency_seconds). Standard Prometheus and OTel tooling expects underscores. The metrics proxy converts the format so the OpenTelemetry Collector can scrape without issues.
Want to try this pipeline with your own inference data? Send vLLM metrics to Parseable through OpenTelemetry and start querying latency, token throughput, KV cache pressure, and GPU cost in one place. Start free with Parseable
Why Parseable fits this setup
Parseable stores telemetry as structured JSON, supports standard SQL for queries and aggregations, and provides a built-in dashboard and alerting layer. For LLM inference monitoring, this means you can write a SQL query for p99 latency, join it with token throughput, and build a cost estimate in a single query — no PromQL or custom query language required.
Why monitor vLLM inference?
Latency and user experience
The metrics that matter most for user-perceived performance:
| Metric | What it measures |
|---|---|
vllm:e2e_request_latency_seconds | Full request duration, request generation to final token |
vllm:time_to_first_token_seconds | Time from request receipt to first generated token |
vllm:inter_token_latency_seconds | Time between consecutive tokens during generation |
Alerting only on average latency masks long-tail issues. Use p95 and p99 histograms, especially for TTFT.
Throughput and token volume
| Metric | What it measures |
|---|---|
vllm:prompt_tokens_total | Total prompt tokens processed |
vllm:generation_tokens_total | Total tokens generated |
vllm:request_success_total | Successful completed requests |
Token throughput divided by time gives tokens/second — the primary capacity metric for sizing GPU deployments.
KV cache and batching pressure
| Metric | What it measures |
|---|---|
vllm:gpu_cache_usage_perc | KV cache fill percentage |
vllm:num_requests_running | Active requests being processed |
vllm:num_requests_waiting | Requests queued, waiting for capacity |
vllm:num_preemptions_total | Requests evicted due to cache pressure |
vllm:prefix_cache_hit_rate | Prefix cache efficiency |
KV cache pressure, not GPU utilization, is usually the first bottleneck in vLLM. Watch vllm:gpu_cache_usage_perc and vllm:num_requests_waiting together.
GPU cost and utilization
Cost per request depends on GPU type, cloud provider, utilization, batch size, model size, and traffic pattern. Consistent GPU metric collection is the prerequisite. The cost analysis section below shows a concrete example from a specific deployment — treat the numbers as a methodology, not a universal benchmark.
Metrics that matter for vLLM OpenTelemetry monitoring
These are the key vLLM metrics to collect, categorized by what they tell you.
Request and latency metrics
vllm:e2e_request_latency_seconds     # histogram, end-to-end latency per request
vllm:time_to_first_token_seconds     # histogram, TTFT per request
vllm:inter_token_latency_seconds     # histogram, generation speed
vllm:request_success_total           # counter, completed requests
Token metrics
vllm:prompt_tokens_total             # counter, total prompt tokens
vllm:generation_tokens_total         # counter, total generated tokens
vllm:request_prompt_tokens           # histogram, prompt tokens per request
vllm:request_generation_tokens       # histogram, generated tokens per request
Cache and queue metrics
vllm:gpu_cache_usage_perc            # gauge, KV cache fill %
vllm:num_requests_running            # gauge, active requests
vllm:num_requests_waiting            # gauge, queued requests
vllm:num_preemptions_total           # counter, cache evictions
vllm:prefix_cache_hit_rate           # gauge, prefix cache efficiency
Optional: Model Flops Utilization
vLLM exposes MFU metrics when launched with --enable-mfu-metrics. These measure GPU compute efficiency. Add this flag only if you need compute utilization analysis alongside throughput.
Prerequisites
Before starting:
- vLLM server running and accessible — confirm with
curl http://your-vllm-host:8000/metrics - Docker or Podman installed
- Git to clone the setup repository
- Parseable instance (cloud account or self-hosted) or use the included Docker service
- Network access between the collector host and both vLLM and Parseable endpoints
Step 1: Expose vLLM metrics
vLLM automatically exposes a Prometheus-compatible /metrics endpoint on the same port as the OpenAI-compatible API server (default 8000).
curl http://0.0.0.0:8000/metricsYou should see output like:
# HELP vllm:num_requests_running Number of requests currently running on GPU.
# TYPE vllm:num_requests_running gauge
vllm:num_requests_running{model_name="..."} 4.0

# HELP vllm:gpu_cache_usage_perc GPU KV-cache usage.
# TYPE vllm:gpu_cache_usage_perc gauge
vllm:gpu_cache_usage_perc{model_name="..."} 0.72
If you get a connection error, confirm vLLM started correctly and note the port (some deployments use 8080 or a custom port configured with --port).
Step 2: Clone the setup repository
git clone https://github.com/opensourceops/vllm-inference-metrics.git
cd vllm-inference-metrics
The repository includes:
proxy.py— the metrics proxycompose-otel.yml— Docker/Podman Compose fileotel-config.yaml— OpenTelemetry Collector configurationparseable.env— Parseable environment variables
Step 3: Configure the metrics proxy
vLLM metric names use colons as namespace separators (e.g., vllm:e2e_request_latency_seconds). Standard Prometheus scraping and most OTel pipelines expect underscores. The metrics proxy (proxy.py) handles this conversion: it fetches the raw vLLM metrics endpoint and re-exposes the metrics with colons replaced by underscores.
Set the vLLM endpoint in compose-otel.yml:
proxy:
  environment:
    - VLLM_METRICS_URL=http://your-vllm-host:8000/metrics
Replace your-vllm-host with your actual vLLM server address.
Step 4: Collect vLLM metrics with OpenTelemetry Collector
The OpenTelemetry Collector scrapes the metrics proxy and forwards metrics to Parseable via OTLP HTTP.
OTel Collector config (otel-config.yaml)
receivers:
  prometheus:
    config:
      scrape_configs:
        - job_name: "vllm"
          scrape_interval: 2s
          static_configs:
            - targets: ["proxy:9090"]

processors:
  batch:
    timeout: 10s
    send_batch_size: 100

exporters:
  otlphttp/parseablemetrics:
    endpoint: "http://parseable:8000"
    headers:
      Authorization: "Basic YWRtaW46YWRtaW4="
      X-P-Stream: vLLMmetrics
      X-P-Log-Source: otel-metrics
    tls:
      insecure: true

service:
  telemetry:
    logs:
      level: info
  pipelines:
    metrics:
      receivers: [prometheus]
      processors: [batch]
      exporters: [otlphttp/parseablemetrics]
What this does:
- Scrapes the metrics proxy every 2 seconds using the Prometheus receiver
- Batches metrics with a 10-second timeout and 100-event batch size
- Exports to Parseable via OTLP HTTP with the
vLLMmetricsstream header - The
Authorizationheader uses base64-encodedadmin:admin— update this for production
Full Docker Compose file (compose-otel.yml)
services:
  parseable:
    image: parseable/parseable:edge
    command: ["parseable", "local-store"]
    env_file: ./parseable.env
    volumes:
      - parseable-staging:/staging
    ports:
      - "8080:8000"
    restart: unless-stopped

  proxy:
    image: python:3.11-alpine
    volumes:
      - ./proxy.py:/app/proxy.py:ro
    environment:
      - VLLM_METRICS_URL=http://your-vllm-host:8000/metrics
    command: >
      sh -c "pip install --no-cache-dir flask requests && python /app/proxy.py"
    ports:
      - "9090:9090"
    restart: unless-stopped
    depends_on:
      - parseable
    healthcheck:
      test: ["CMD-SHELL", "python - <<'PY'\nimport requests;print(requests.get('http://localhost:9090/metrics',timeout=3).status_code)\nPY"]
      interval: 10s
      timeout: 5s
      retries: 5
      start_period: 5s

  otel-collector:
    image: otel/opentelemetry-collector:latest
    command: ["--config=/etc/otel-config.yaml"]
    volumes:
      - ./otel-config.yaml:/etc/otel-config.yaml:ro
    ports:
      - "4317:4317"
      - "4318:4318"
      - "8888:8888"
    restart: unless-stopped
    depends_on:
      proxy:
        condition: service_healthy
      parseable:
        condition: service_started
    healthcheck:
      test: ["CMD", "wget", "-qO-", "http://localhost:13133/healthz"]
      interval: 10s
      timeout: 5s
      retries: 5
      start_period: 5s

volumes:
  parseable-staging:
Start the stack
# Docker
docker compose -f compose-otel.yml up -d

# Podman
podman compose -f compose-otel.yml up -d
Verify all services started:
docker compose -f compose-otel.yml psCheck the collector is scraping:
docker compose -f compose-otel.yml logs -f otel-collectorStep 5: Store vLLM metrics in Parseable
Once the stack is running, Parseable receives metrics in the vLLMmetrics stream. The Parseable UI is available at http://localhost:8080.
Default credentials: admin / admin — change these before any non-local deployment.
Inspect the stream schema before writing queries. Field names in the stream depend on the proxy, collector, and export format. After the first few seconds of ingestion, run:
curl -X POST http://localhost:8080/api/v1/query \
  -H "Authorization: Basic YWRtaW46YWRtaW4=" \
  -H "Content-Type: application/json" \
  -d '{"query": "SELECT * FROM vLLMmetrics LIMIT 5", "startTime": "10m", "endTime": "now"}'
Examine the returned field names. The SQL examples in the next sections use field names from the proxy-normalized format (underscores). If your deployment uses different field names, adapt the queries to match your actual schema.
Step 6: Query vLLM metrics with SQL
All queries below target the vLLMmetrics stream. Adapt field names to match your schema.
p95 and p99 latency
SELECT
  date_trunc('minute', p_timestamp) AS minute,
  percentile_cont(0.95) WITHIN GROUP (ORDER BY value) AS p95_latency_seconds,
  percentile_cont(0.99) WITHIN GROUP (ORDER BY value) AS p99_latency_seconds,
  avg(value) AS avg_latency_seconds
FROM vLLMmetrics
WHERE name = 'vllm_e2e_request_latency_seconds'
  AND p_timestamp >= now() - interval '1 hour'
GROUP BY 1
ORDER BY 1;
If your team already collects vLLM metrics, Parseable gives you a SQL-first way to investigate them without building a custom metrics backend. Store inference telemetry, run precise queries, and turn the results into dashboards and alerts. Try Parseable for free.
Time to first token
SELECT
  date_trunc('minute', p_timestamp) AS minute,
  percentile_cont(0.95) WITHIN GROUP (ORDER BY value) AS p95_ttft_seconds,
  percentile_cont(0.99) WITHIN GROUP (ORDER BY value) AS p99_ttft_seconds
FROM vLLMmetrics
WHERE name = 'vllm_time_to_first_token_seconds'
  AND p_timestamp >= now() - interval '1 hour'
GROUP BY 1
ORDER BY 1;
Token throughput
SELECT
  date_trunc('minute', p_timestamp) AS minute,
  sum(CASE WHEN name = 'vllm_prompt_tokens_total' THEN value ELSE 0 END) AS prompt_tokens,
  sum(CASE WHEN name = 'vllm_generation_tokens_total' THEN value ELSE 0 END) AS generation_tokens
FROM vLLMmetrics
WHERE p_timestamp >= now() - interval '1 hour'
GROUP BY 1
ORDER BY 1;
KV cache pressure
SELECT
  date_trunc('minute', p_timestamp) AS minute,
  avg(CASE WHEN name = 'vllm_gpu_cache_usage_perc' THEN value END) AS avg_kv_cache_pct,
  max(CASE WHEN name = 'vllm_gpu_cache_usage_perc' THEN value END) AS max_kv_cache_pct
FROM vLLMmetrics
WHERE p_timestamp >= now() - interval '1 hour'
GROUP BY 1
ORDER BY 1;
Running vs waiting requests
SELECT
  date_trunc('minute', p_timestamp) AS minute,
  avg(CASE WHEN name = 'vllm_num_requests_running' THEN value END) AS avg_running,
  avg(CASE WHEN name = 'vllm_num_requests_waiting' THEN value END) AS avg_waiting
FROM vLLMmetrics
WHERE p_timestamp >= now() - interval '1 hour'
GROUP BY 1
ORDER BY 1;
GPU cost estimate
This query estimates cost for an A100 PCIe at ~$2.21/hour on a standard cloud provider. Adjust the rate for your GPU type, provider, and contract pricing.
SELECT
  date_trunc('hour', p_timestamp) AS hour,
  sum(CASE WHEN name = 'vllm_generation_tokens_total' THEN value ELSE 0 END) AS total_tokens,
  sum(CASE WHEN name = 'vllm_request_success_total' THEN value ELSE 0 END) AS total_requests,
  2.21 AS gpu_hourly_rate_usd,
  round(
    2.21 / NULLIF(sum(CASE WHEN name = 'vllm_request_success_total' THEN value ELSE 0 END), 0),
    6
  ) AS cost_per_request_usd
FROM vLLMmetrics
WHERE p_timestamp >= now() - interval '24 hours'
GROUP BY 1
ORDER BY 1;
Cost analysis: GPT-OSS-20B on A100 PCIe
The following numbers come from a specific production window and should be treated as a methodology example, not a universal benchmark. Results will differ based on model size, GPU type, cloud provider, batch size, traffic pattern, and utilization.
Deployment window: 3.15 hours
Model: GPT-OSS-20B
GPU: A100 PCIe
Requests processed: 5,138
Throughput: 1,631 requests/hour
Estimated cost per request: ~$0.001005
This level of cost visibility requires collecting token volume, request count, and a reference GPU hourly rate consistently over time. One-off checks don't support trend analysis or capacity planning. The SQL query in the previous section structures this into a per-hour view that makes cost anomalies visible.
Cost analysis is only meaningful when latency, throughput, token volume, and GPU utilization are collected as a set. A spike in cost-per-request with no throughput change typically means request volume dropped, not that inference became more expensive.
GPU cost analysis only works when token volume, request count, latency, and utilization are collected continuously. Parseable helps teams keep that telemetry queryable, so inference cost and performance trends are easier to track over time. Start monitoring inference costs with Parseable.
Step 7: Build vLLM dashboards in Parseable
In the Parseable UI, create a new dashboard and add panels using the SQL queries above.
Recommended panels:
| Panel | Query focus | Visualization |
|---|---|---|
| Request throughput | vllm_request_success_total per minute | Time series |
| p95 / p99 latency | vllm_e2e_request_latency_seconds | Time series |
| Time to first token | vllm_time_to_first_token_seconds p95 | Time series |
| Token volume | Prompt vs generation tokens per minute | Stacked bar |
| KV cache usage | vllm_gpu_cache_usage_perc | Gauge + time series |
| Running vs waiting | vllm_num_requests_running and _waiting | Time series |
| GPU cost estimate | Cost per request per hour | Table |
| Request failures | Total requests minus successful | Time series |
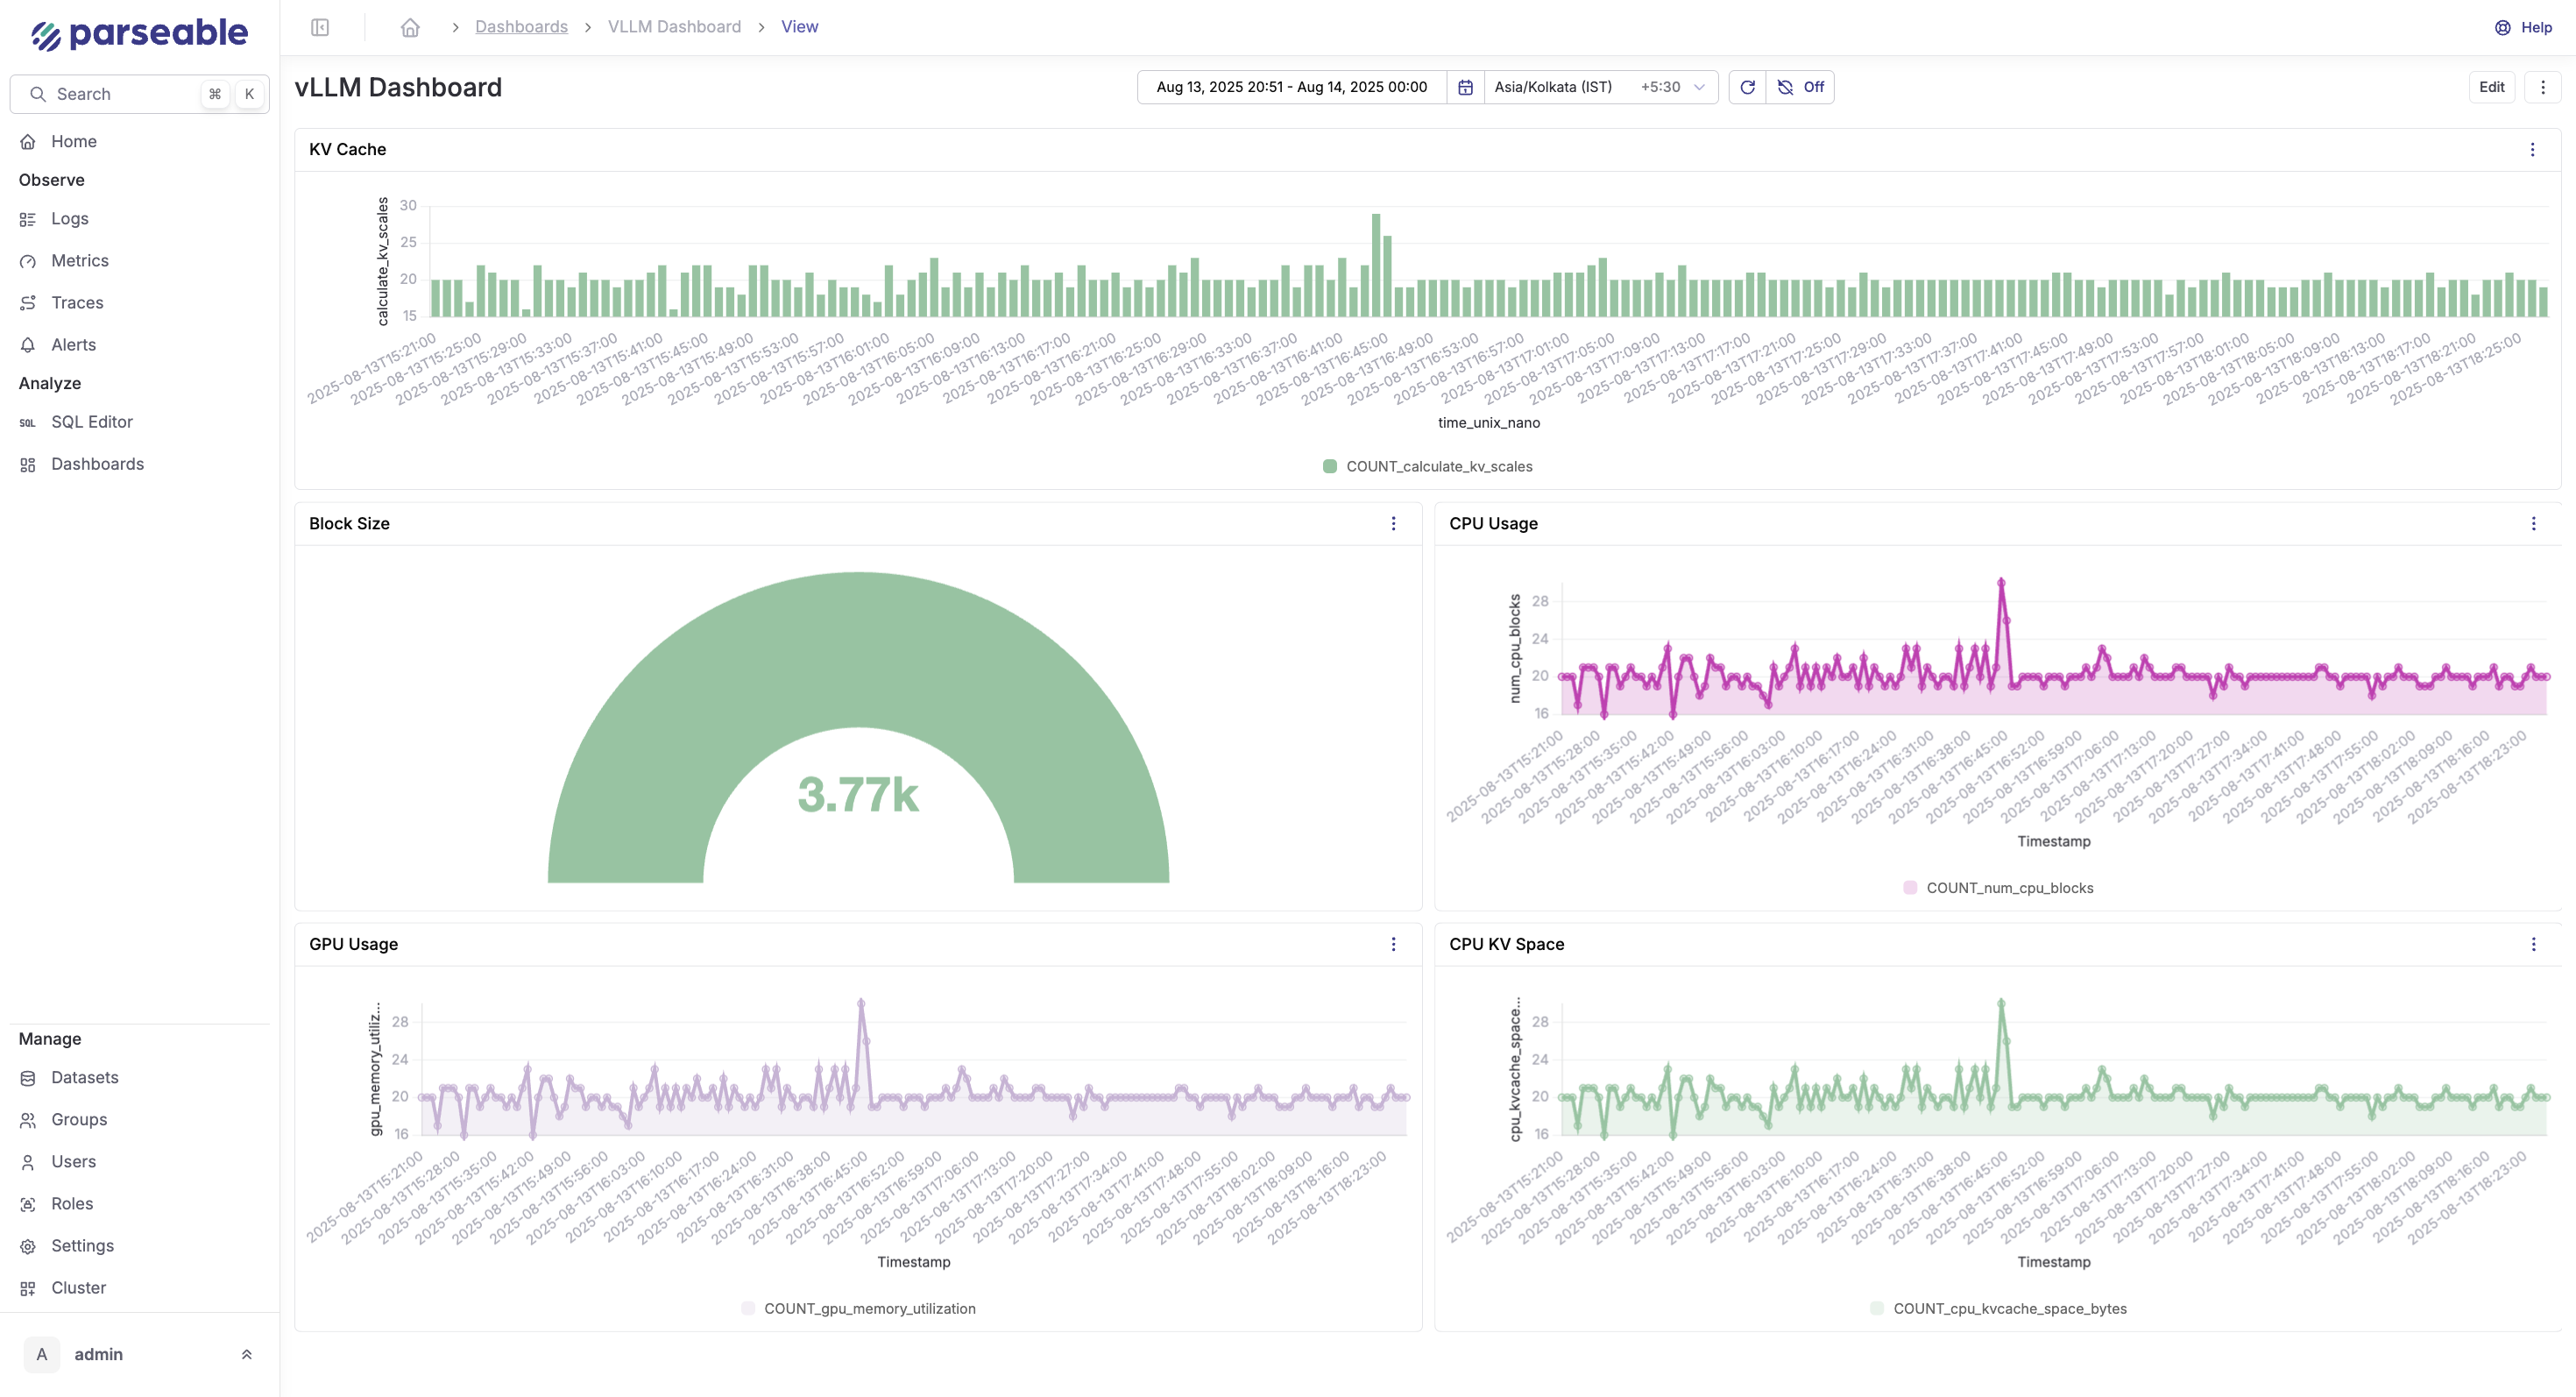
Keep the dashboard focused on operational decisions: latency degradation, cache saturation, and throughput drops are the signals that require action. Once done you should be seeing something like this:
Step 8: Create alerts for vLLM inference
Set up alerts in Parseable for the conditions that require immediate attention.
Recommended alert rules:
-- High p99 latency (threshold: 10 seconds)
SELECT percentile_cont(0.99) WITHIN GROUP (ORDER BY value)
FROM vLLMmetrics
WHERE name = 'vllm_e2e_request_latency_seconds'
  AND p_timestamp >= now() - interval '5 minutes'
HAVING percentile_cont(0.99) WITHIN GROUP (ORDER BY value) > 10;

-- High time to first token (threshold: 5 seconds)
SELECT percentile_cont(0.95) WITHIN GROUP (ORDER BY value)
FROM vLLMmetrics
WHERE name = 'vllm_time_to_first_token_seconds'
  AND p_timestamp >= now() - interval '5 minutes'
HAVING percentile_cont(0.95) WITHIN GROUP (ORDER BY value) > 5;

-- KV cache saturation (threshold: 90%)
SELECT avg(value)
FROM vLLMmetrics
WHERE name = 'vllm_gpu_cache_usage_perc'
  AND p_timestamp >= now() - interval '5 minutes'
HAVING avg(value) > 0.90;

-- High queue depth (threshold: 50 waiting requests)
SELECT avg(value)
FROM vLLMmetrics
WHERE name = 'vllm_num_requests_waiting'
  AND p_timestamp >= now() - interval '5 minutes'
HAVING avg(value) > 50;
Alert on p95/p99, not averages. Average latency masks long-tail issues that affect real users.
Optional: add vLLM OpenTelemetry tracing
vLLM supports OpenTelemetry tracing separately from the Prometheus metrics path. To enable it, start vLLM with the tracing flags:
OTEL_SERVICE_NAME=vllm-production \
OTEL_EXPORTER_OTLP_TRACES_ENDPOINT=http://your-otel-collector:4318/v1/traces \
python -m vllm.entrypoints.openai.api_server \
  --model your-model \
  --otlp-traces-endpoint http://your-otel-collector:4317
The OTel Collector receives traces on port 4317 (gRPC) or 4318 (HTTP/protobuf). Add a traces pipeline alongside the metrics pipeline in your otel-config.yaml:
receivers:
  otlp:
    protocols:
      grpc:
        endpoint: "0.0.0.0:4317"
      http:
        endpoint: "0.0.0.0:4318"

service:
  pipelines:
    metrics:
      receivers: [prometheus]
      processors: [batch]
      exporters: [otlphttp/parseablemetrics]
    traces:
      receivers: [otlp]
      processors: [batch]
      exporters: [otlphttp/parseablemetrics]
Use traces when you need to correlate individual client requests with vLLM server spans — for debugging specific slow requests or understanding per-request model execution. For ongoing production monitoring, metrics are sufficient.
Troubleshooting
No metrics at /metrics
Check that vLLM started successfully and the API server is running:
curl http://your-vllm-host:8000/health
curl http://your-vllm-host:8000/metrics
If the health check passes but /metrics returns nothing, confirm you are running a recent vLLM version. Metrics collection is enabled by default in v0.3+.
Metrics proxy is not serving data
curl http://localhost:9090/metrics
curl http://localhost:9090/health
Check the proxy logs:
docker compose -f compose-otel.yml logs proxyConfirm the VLLM_METRICS_URL in the compose file points to the correct host and port.
OpenTelemetry Collector is not scraping
docker compose -f compose-otel.yml logs otel-collectorCommon causes: proxy health check hasn't passed yet (wait 30 seconds after start), wrong scrape target in otel-config.yaml, or network connectivity between collector and proxy containers.
Check the collector's internal metrics on port 8888:
curl http://localhost:8888/metrics | grep otelcol_receiver_acceptedParseable stream is empty
Verify the stream exists and is receiving data:
curl -X POST http://localhost:8080/api/v1/query \
  -H "Authorization: Basic YWRtaW46YWRtaW4=" \
  -H "Content-Type: application/json" \
  -d '{"query": "SELECT COUNT(*) FROM vLLMmetrics", "startTime": "10m", "endTime": "now"}'
If the stream doesn't exist, the collector may not be connecting to Parseable. Confirm the endpoint in otel-config.yaml and the Authorization header are correct.
Field names do not match SQL examples
Inspect the actual schema before adapting queries:
curl -X POST http://localhost:8080/api/v1/query \
  -H "Authorization: Basic YWRtaW46YWRtaW4=" \
  -H "Content-Type: application/json" \
  -d '{"query": "SELECT * FROM vLLMmetrics LIMIT 3", "startTime": "5m", "endTime": "now"}'
Use the actual field names from the response in your SQL queries.
Latency or token metrics look wrong
vLLM latency histograms report buckets. If you are querying raw histogram bucket rows instead of computing percentiles, values will look incorrect. Use percentile_cont as shown in the SQL examples, or confirm how the OTel exporter flattens histograms into the Parseable stream.
GPU cost calculation looks inaccurate
The cost query uses a hardcoded hourly rate. Update the rate constant to match your actual GPU type, cloud provider, and contract pricing. Also confirm that vllm_request_success_total is counting completed requests in your deployment, not total submitted requests.
Common mistakes
Confusing vLLM metrics and vLLM traces
Metrics come from /metrics. Traces come from the OTLP traces endpoint configured with --otlp-traces-endpoint. They use different collection mechanisms. This guide covers metrics. Do not configure the OTel Collector's OTLP receiver as the metrics source unless you are also shipping traces.
Tracking GPU utilization but ignoring KV cache pressure
GPU utilization can look healthy while KV cache is filling up and causing request preemptions. Always monitor vllm_gpu_cache_usage_perc, vllm_num_requests_waiting, and vllm_num_preemptions_total alongside GPU utilization.
Alerting only on average latency
Average latency masks long-tail issues. Use p95 and p99 for e2e_request_latency_seconds and p95 for time_to_first_token_seconds. An average of 2 seconds with a p99 of 45 seconds indicates a serious problem that average-only alerting will hide.
Treating example cost numbers as universal
The cost analysis in this guide is from one specific deployment: GPT-OSS-20B on A100 PCIe. Your numbers will differ based on model size, GPU type, provider pricing, batch size, traffic pattern, and peak vs. off-peak utilization.
Conclusion
A working vLLM OpenTelemetry setup gives teams the visibility needed to operate production inference infrastructure: request latency at p95/p99, time to first token, token throughput, KV cache pressure, queue depth, and GPU cost — all in a queryable, dashboardable backend.
vLLM exposes the right production metrics through its /metrics endpoint. The OpenTelemetry Collector provides a flexible, production-proven collection and forwarding layer. Parseable stores the telemetry as structured JSON with SQL access for ad-hoc queries, dashboards, and alerts. Keep the pipeline practical: validate your stream schema, use the actual field names, and monitor p95/p99 latency alongside cache pressure rather than average metrics alone. Add tracing only when request-level debugging requires it.
For teams running multiple AI inference backends, the same OTel Collector pipeline can be extended to collect metrics from other serving frameworks alongside vLLM, giving a unified view of AI inference observability across your infrastructure.

