
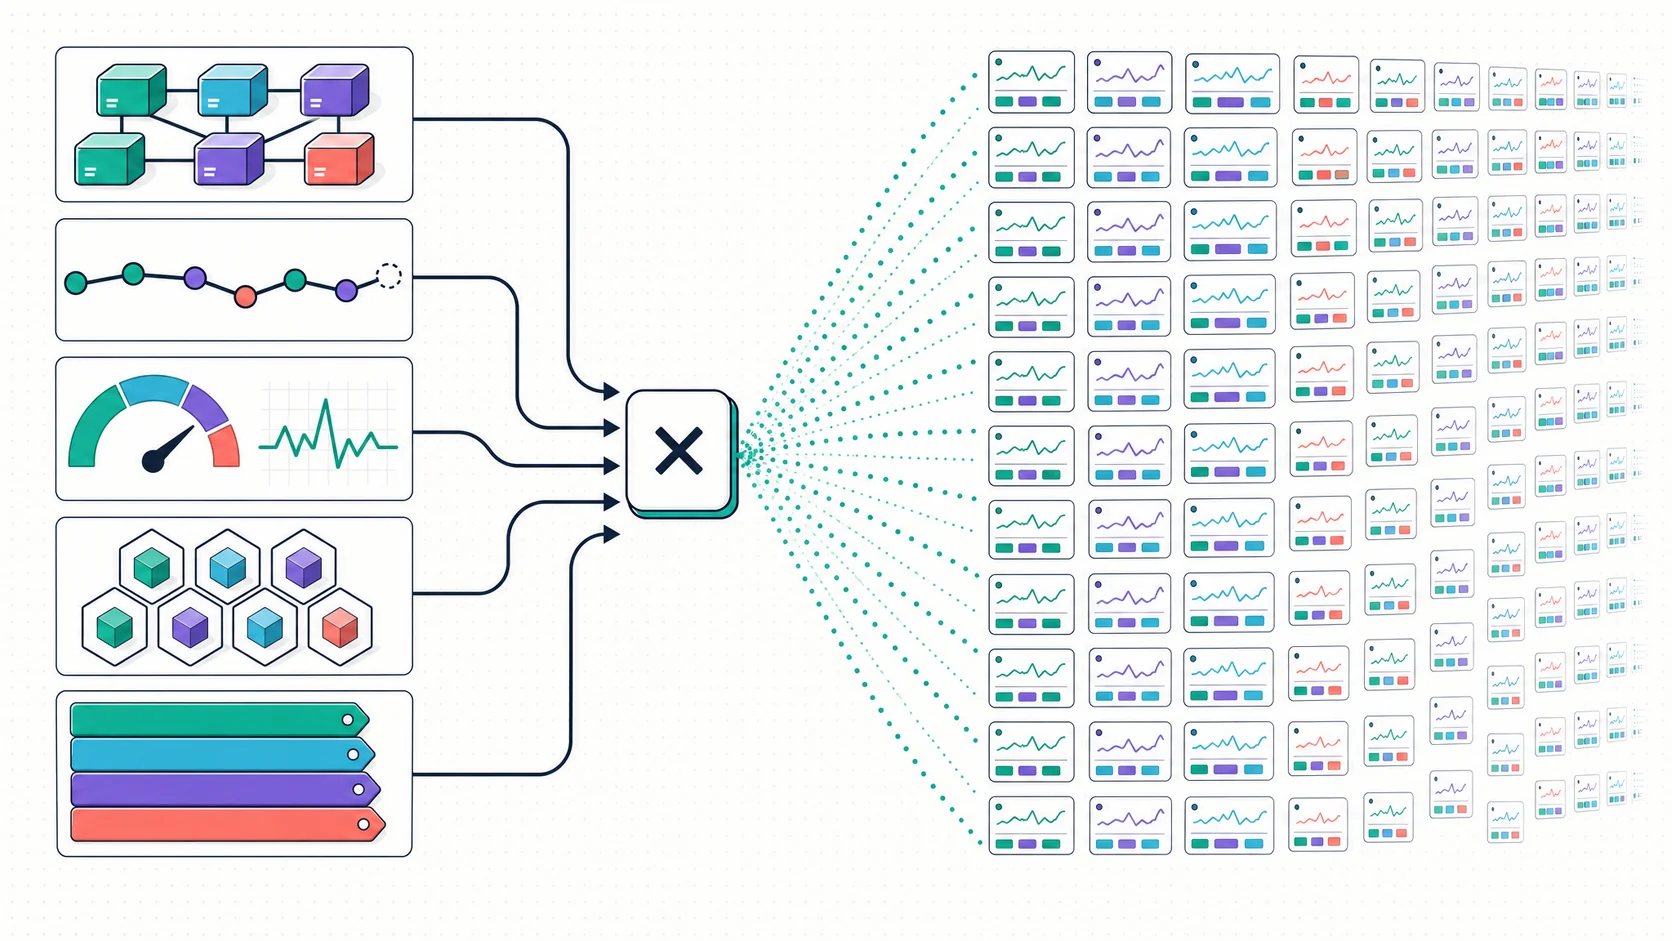
High cardinality usually becomes visible as an operational problem before anyone stops to define it. A dashboard slows down, active-series counts jump after a deployment or a new label makes the metrics bill climb. Underneath each case is the same idea: a field contains many unique values.
User IDs, trace IDs, request IDs and Kubernetes pod names are common examples. Modern systems need this detail for debugging. A payments API may attach merchant IDs, route templates and tenant identifiers to its telemetry. The trouble starts when the storage system creates separate index entries, streams or time series for a growing number of values and combinations.
High-cardinality data behaves differently across metrics, logs and traces. Its value and cost depend on the signal, storage model and query pattern.
In this guide
- What high cardinality means
- Why cardinality explodes
- Where high-cardinality fields belong
- Metrics, logs and traces
- How to detect cardinality problems
- How to reduce or control cardinality
- How storage architecture changes the trade-off
What is high cardinality?
Cardinality is the number of distinct values observed in a field. A field containing five distinct values has a cardinality of five.
High cardinality means a field, label, dimension or attribute can take a very large number of distinct values, often thousands or millions. The exact threshold is fuzzy, but the practical definition is simpler: a field is high cardinality when its uniqueness starts to stress the storage, indexing or query layer of the system that holds it.
For a data field, cardinality is the number of distinct values observed. For metrics, series cardinality is the number of unique metric-name and label-value combinations. These numbers are related, but they are not interchangeable.
A simple example of high cardinality
| Field | Sample values | Approx. unique values | Cardinality |
|---|---|---|---|
http_method | GET, POST, PUT, DELETE | 7 | Low |
status_code | 200, 404, 500 | Usually dozens | Low |
region | us-east-1, eu-west-2 | ~30 | Low |
service | checkout, billing, auth | ~100 | Low to medium |
customer_tier | free, pro, enterprise | 3 | Low |
user_id | u_8e91, u_2a44 | 1M+ | High |
trace_id | 4bf92f3577b34da6a3ce929d... | per request | Extreme |
pod_name | api-7d9bc6-zk8wl | thousands per day | High with churn |
Useful intuition: if you can list every possible value of a field on a whiteboard, it is low cardinality. If listing them would take a database query, it is high cardinality.
Low-cardinality fields work well for aggregation. High-cardinality fields are often more useful for exact filtering and investigation. Their cost depends on where and how they are stored.
Cardinality vs dimensionality
These terms often get used interchangeably, which is where the confusion starts.
- Cardinality is the number of unique values inside a single field.
- Dimensionality is the number of fields attached to an event, log line, metric series or span.
A log line with service, status_code, user_id, region, pod and route has six dimensions. Each of those dimensions has its own cardinality. service might have 50 unique values. user_id might have 5 million. The two ideas compose: a system can be high in dimensionality, high in cardinality or both.
This distinction matters because the failure modes differ. High dimensionality tests schema flexibility and storage layout. High cardinality tests indexes, time-series management and query planning. Prometheus-style metrics systems work best when label values stay bounded. Columnar stores can make wide, high-cardinality event data more practical because queries read selected columns instead of maintaining one time series for every label combination.
When people say "cardinality explosion," they usually mean a multiplicative interaction between high dimensionality and high cardinality on at least one of the dimensions.
Why high cardinality matters in observability
Observability is the ability to ask new questions of your system without shipping new code. That definition only holds when the underlying telemetry is rich enough to support unanticipated queries. High-cardinality context helps engineers answer those questions.
Consider an incident where the error rate rises by 0.4 percent for an hour. Aggregated metrics show the change, but not whether it affects one tenant, one region, one mobile build or one database shard. To answer why, you need details such as tenant ID, build version, shard ID, plan or feature-flag variant.
Multi-tenant systems need tenant-level visibility. Cloud-native systems create ephemeral identifiers. Distributed requests need trace context. These fields let engineers test an incident hypothesis instead of relying only on aggregates. Store them in a signal and system that preserve the detail without making cost or query performance unpredictable.
How high cardinality explodes
Metric-series cardinality can grow multiplicatively when dimensions combine. A single field may grow gradually while the number of label combinations rises much faster.
From stable infrastructure to cloud-native churn
Consider the same application in two environments. Both have 50 normalized routes, 5 status codes and 10 services. During the selected window, the stable environment has 100 VM identities and one deployment version. Rolling deployments and autoscaling cause the cloud-native environment to observe 4,000 unique pod identities and 20 versions.
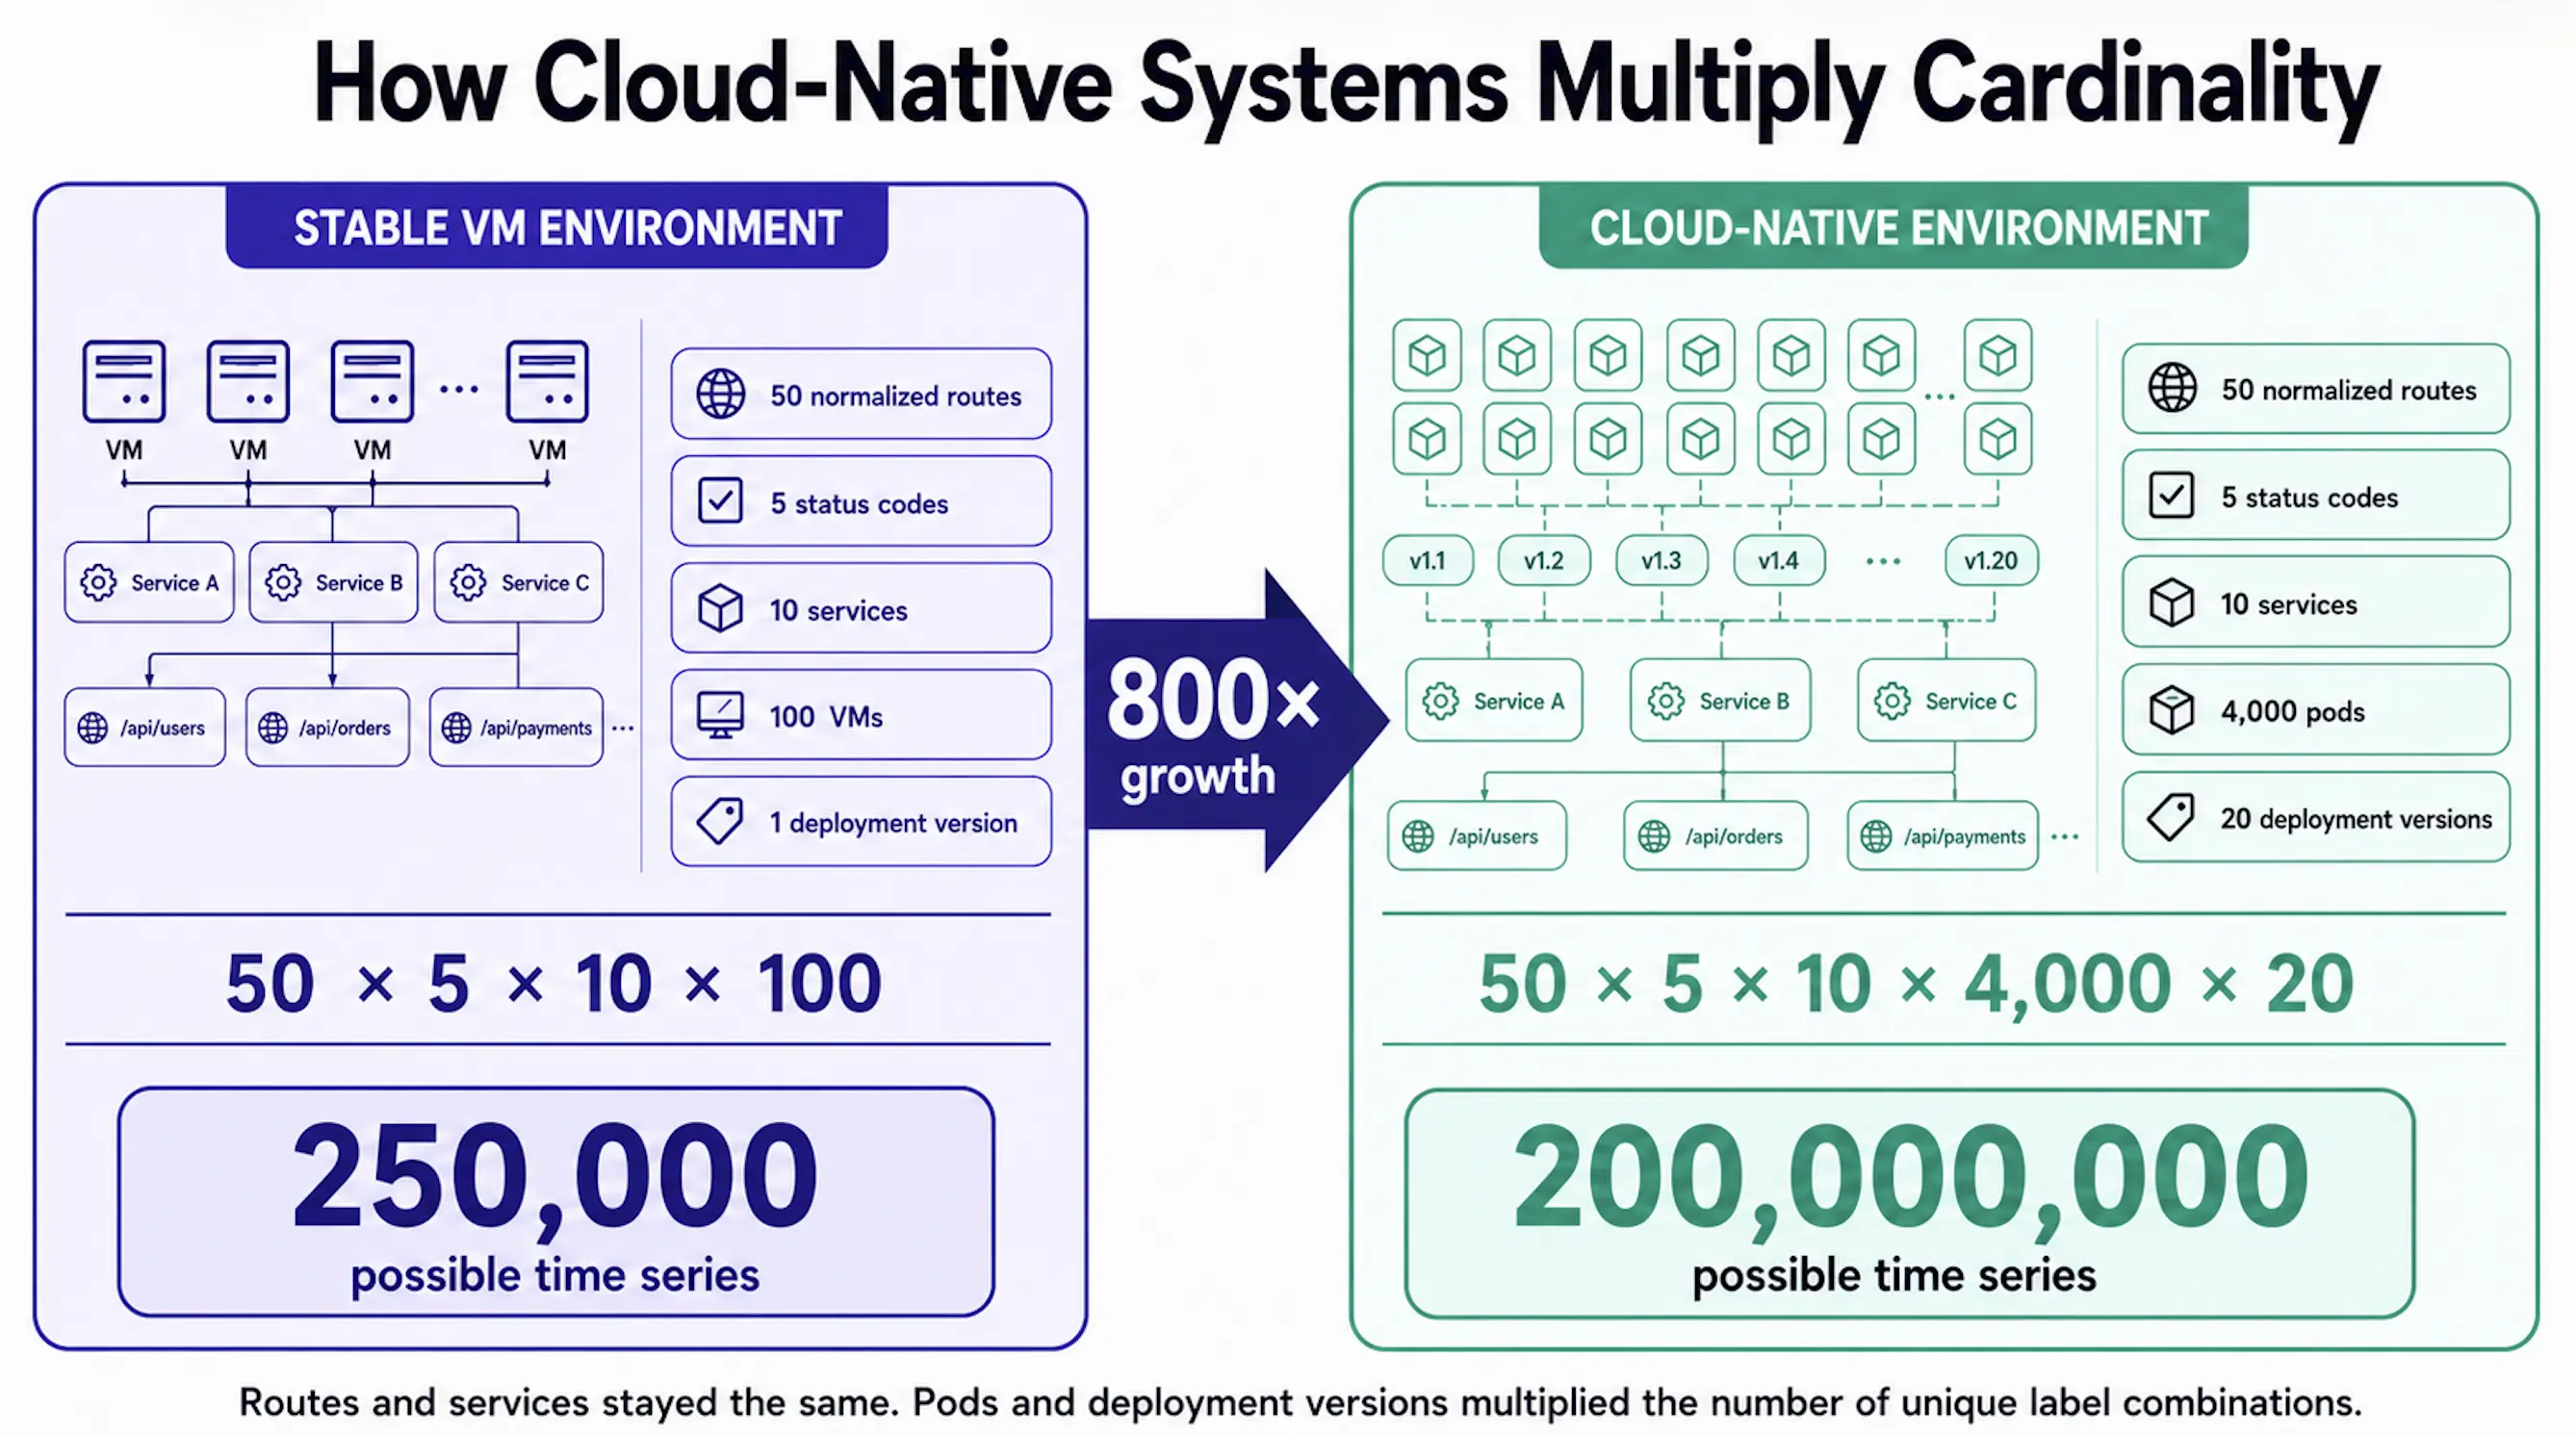
The image shows the resulting upper bounds: 250,000 possible series for the stable environment and 200 million for the cloud-native one, an 800-fold increase. These are possible combinations across the window, not concurrent active-series counts; many combinations may never occur. The practical count depends on workload behavior. Prometheus documents that every unique label set creates another time series and advises against unbounded labels such as user IDs and email addresses.
To control this growth:
- Keep metric labels strictly bounded.
- Move per-request, per-user and per-tenant detail into logs and traces.
- Use a backend designed for the expected active-series count, retention period and query patterns.
See the architectural trade-offs in our guide to high cardinality and columnar time-series storage.
A real-world example: Tesla's metrics cardinality
Tesla's internal metrics platform has accumulated tens of billions of time series and currently stores tens of trillions of samples while ingesting tens of millions of rows per second. The series figure is cumulative, not a concurrent active-series count, but it shows the number of distinct label combinations a large metrics estate can create over time. A published case study about Tesla describes this scale and identifies high-cardinality time series as a constraint for traditional metrics systems.
Why high cardinality becomes a problem
Once cardinality runs ahead of a platform's design, several costs can rise together:
- Resource overhead: Each label set creates another time series with RAM, CPU, disk and network costs. Prometheus calls out all four costs in its instrumentation guidance.
- Query and index work: Systems must locate matching series before reading samples. Dashboards and alert rules that scan many series have more work to do.
- Capacity and retention pressure: An unbounded label can consume capacity that would otherwise support useful metrics, targets or a longer retention window.
- Higher bills under some pricing models: Products priced by active series, samples or ingest volume charge more as those measurements grow.
These effects vary by backend, configuration, workload and pricing model. Measure them in your own system instead of treating one series count as a universal limit.
Where high-cardinality fields belong
High-cardinality fields often carry valuable diagnostic context. The decision is where to store each field and whether engineers will aggregate it or look up one exact value.
| Field | Metric label? | Logs or traces? | Recommended treatment |
|---|---|---|---|
tenant_id | Usually no; use a bounded tier or cohort for aggregate metrics | Yes, when needed and permitted | Keep tenant-level context out of global metric labels unless the tenant set is small and controlled |
user_id | No | Yes, subject to privacy and retention policy | Use for support or impact analysis; avoid direct personal data when an internal ID works |
trace_id or request_id | No | Yes | Use for exact request lookup and cross-signal correlation |
| Normalized route | Often yes | Yes | Record /orders/:id, not the raw URL or query string |
| Raw URL, session token or nonce | No | Rarely and only after redaction | Normalize or drop values that expose secrets, personal data or one-off identifiers |
| Pod or container ID | Usually no | Yes | Use stable deployment, namespace or workload labels for metrics; keep ephemeral identity as event context |
| Release or build version | Sometimes, if the set stays bounded | Yes | Retire stale values and watch growth across rolling deployments |
| Timestamp | No | Native event field | Time is already an axis; do not duplicate it as a label |
Ask two questions before adding a field to a metric: Will anyone aggregate by it? Is its value set bounded? If the field is mainly used to find one request, user or container, put it in a log or span instead.
High cardinality over time
Point-in-time cardinality counts the unique values present now. Cardinality over time counts every value observed during a window. A Kubernetes deployment may have 50 active pods while deployments and autoscaling create a much larger cumulative set of pod identities during the month.
This turnover is cardinality churn. Pod names, container IDs, ephemeral job IDs and build identifiers can create new series even while the live workload remains stable. The effect depends on how a backend manages active and historical series, but it makes cumulative uniqueness and retention important.
A query grouped by pod over one hour sees a smaller set than the same query over 30 days. Keep stable identifiers such as deployment and namespace in metric labels and retain ephemeral identities as searchable log or span attributes when engineers need them.
Metrics vs logs vs traces for high-cardinality data
Not every signal type should carry the same cardinality. Choosing the right home for each attribute is what makes an observability stack scalable.
| Signal | Typical cost model | High-cardinality fit | Useful high-cardinality context |
|---|---|---|---|
| Metrics | Per active series, per sample | Limited in label-indexed systems | Bounded enums, SLO dimensions |
| Logs | Per event or byte | Depends on indexing and storage | Per-event context, user IDs, trace IDs |
| Traces | Per span, often sampled | Designed for request attributes | Per-request flow, span attributes |
These are common models, not universal rules. Backend configuration, indexes, sampling and commercial pricing can change the trade-offs.
When high-cardinality data belongs in metrics
Keep metric labels bounded. Dimensions such as service, normalized route, region, environment, status class and tenant tier can be useful because teams aggregate over them. Request IDs, email addresses and user IDs usually are not. Prometheus recommends avoiding high-cardinality and unbounded label values because every unique label combination creates a new series.
When it should move to logs
Use logs when a field is high cardinality and you need to search for a specific value but rarely aggregate over every value. User ID, tenant ID, request ID and error details fit this pattern. The storage model still matters: Grafana Loki recommends low-cardinality index labels and structured metadata for frequently searched high-cardinality values.
When traces are the better fit
Use traces when the question is "what happened during this specific request and which downstream services were involved?" Traces preserve causal structure directly; logs alone usually do not. If your debugging session involves walking through service-to-service hops, traces are the right primary signal.
How to preserve context across signals
Where useful, propagate trace context across logs and spans. Metrics can use exemplars to reference representative traces without turning trace IDs or tenant IDs into metric labels. OpenTelemetry defines exemplars as recorded metric values that can carry trace and span context for this correlation. Apply privacy and access controls before propagating tenant or user identifiers.
How to detect if high cardinality is already hurting you
Stack behavior often exposes high cardinality before a data quality report does.
Warning signs
- Dashboard latency rises on longer time ranges.
- Queries time out on
group byoperations. - Storage costs grow faster than traffic.
- Active-series count climbs even when traffic is flat.
- Memory pressure appears after deployments that introduce new label values.
- Retention shrinks under cost pressure.
- Alert evaluation lag grows.
- Stability incidents follow autoscaling events.
What to check in Prometheus-style systems
Check whether active-series count keeps growing when traffic remains stable. Then find metrics with unusually large series counts and inspect labels containing UUIDs, hashes, user identifiers or other unbounded values. Prometheus's instrumentation guidance recommends investigating metrics whose cardinality can grow beyond a small bounded set and moving unsuitable analysis to a general-purpose processing system.
Use this workflow:
- Confirm that active-series growth is outpacing traffic or the number of monitored workloads.
- Rank metric families by series count to find the largest contributors.
- Inspect those metrics for unbounded or fast-changing label values such as IDs, hashes, raw paths and pod names.
- Check whether dashboards, recording rules or alerts actually filter or group by each suspect label.
- Normalize, drop or aggregate unused labels. Move diagnostic identifiers to logs or traces when policy permits.
For the exact TSDB API, PromQL and relabeling workflow, see how to find and reduce Prometheus cardinality.
How to reduce or control high cardinality
Control cardinality at the instrumentation, telemetry-pipeline and storage layers. Some changes reduce unnecessary detail; others preserve useful detail in a better-suited signal or backend.
Normalize labels and routes
Convert raw URLs to route templates at instrumentation time. Drop query string parameters from labels. Replace IDs in paths with :id placeholders. Most HTTP middleware can do this automatically with a small config change.
Remove low-value, unbounded dimensions
Audit every metric label. If an unbounded label is not used in a dashboard, recording rule or alert, remove it from the metric. Retain it in logs or traces only when it has diagnostic value and policy permits.
Use aggregation or rollups where appropriate
Aggregation and rollup pipelines can produce lower-cardinality metrics for long-term trends. Keep detailed data only where it provides enough diagnostic value to justify its cost.
Move some dimensions from metrics to logs or traces
Remove identifiers such as user_id from metric labels. When engineers need user-level lookup, retain an approved internal identifier in logs or traces with appropriate access and retention controls.
Set telemetry governance rules
Document which label categories are allowed on which metric families. Treat new high-cardinality labels as a code review concern, not a runtime concern. Catch them before they ship.
Track cardinality over time, not just point-in-time
Build dashboards that show active series growth, churn rate per label and top-N labels by cardinality. Make these dashboards visible to every engineer adding instrumentation.
Use storage and query systems built for high-cardinality workloads
If teams repeatedly fight the same cardinality limits after fixing instrumentation, evaluate the storage architecture. Columnar formats and query engines that read selected columns offer a different cost model from systems that represent every metric-label combination as a series.
How storage architecture changes the trade-off
A label-indexed metrics system pays for every unique label combination. A columnar event store has a different trade-off: fields are stored separately, so a query can read only the columns it needs. Apache Parquet is a column-oriented format organized into row groups and column chunks, with optional statistics and page indexes that query engines can use to skip irrelevant data.
Columnar storage does not make every high-cardinality query free. Partitioning, sorting, row-group layout, compression and the selectivity of a filter still matter. It does avoid requiring every unique field combination to become a permanently indexed time series. See our deeper explanations of high cardinality with columnar time-series storage and Parquet for observability data.
How Parseable approaches high-cardinality data
Parseable stores telemetry, including metric samples and their labels, in Apache Parquet on object storage. This columnar layout allows queries to read the relevant fields without requiring every historical label combination to remain in an in-memory series store.
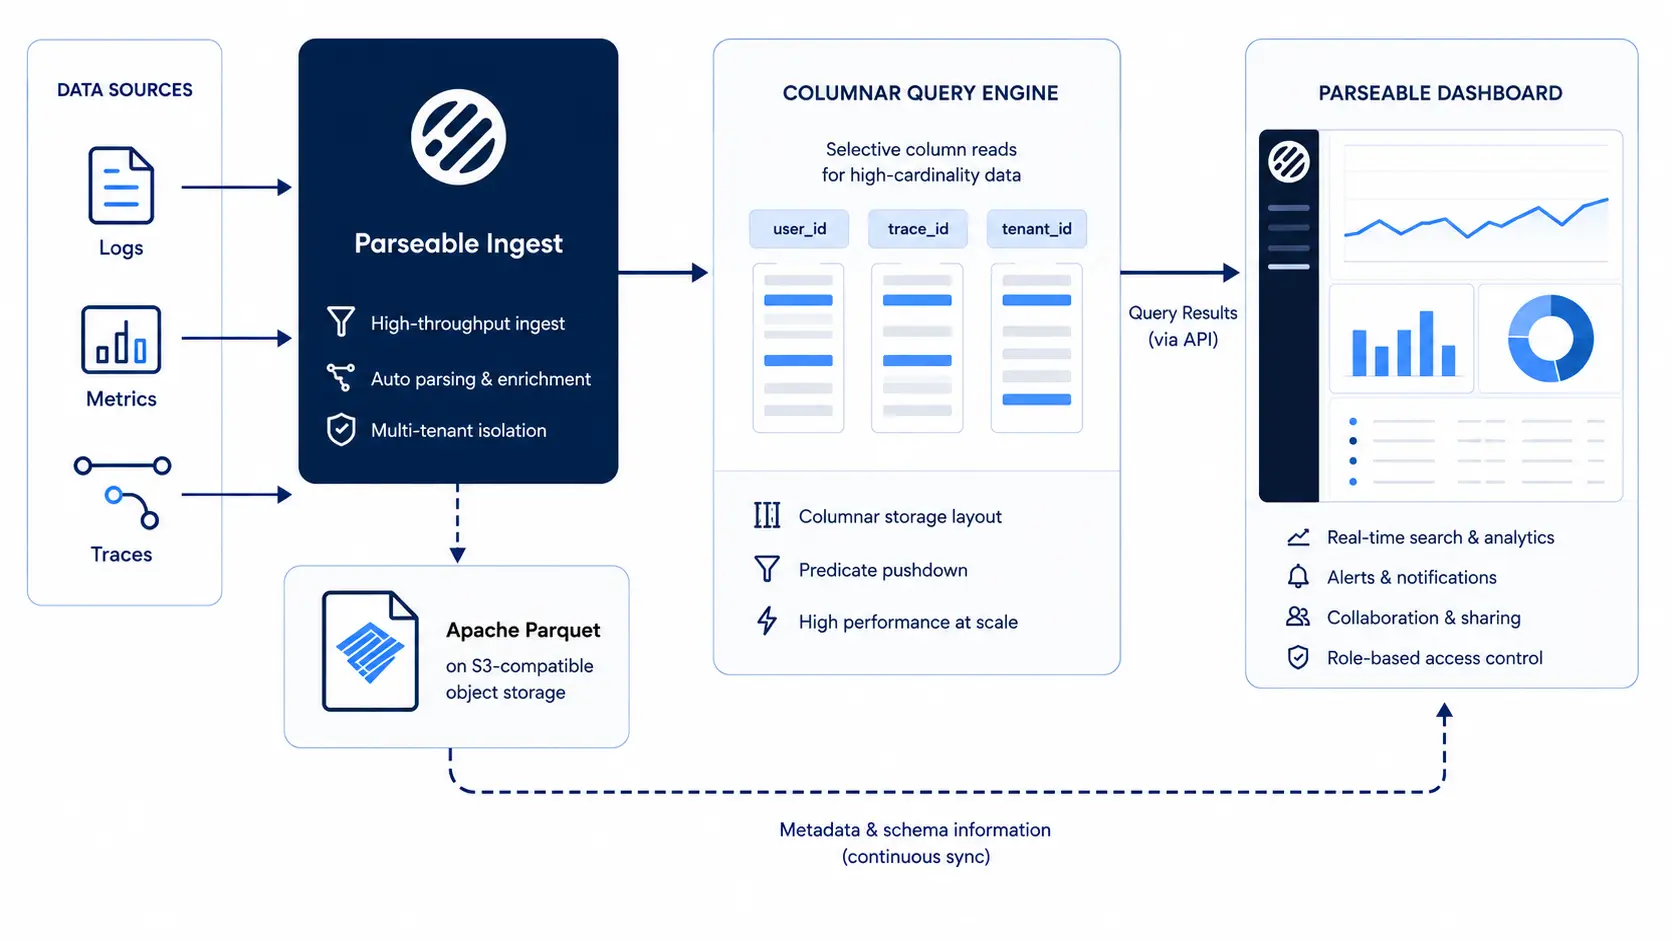
Parseable runs a production deployment that processes approximately 2 million metric data points per second across 34,000 metrics. At a typical point in time, the workload contains the equivalent of 90–100 million unique metric-and-label combinations. One field alone contains about 2.5 million unique values. The deployment has operated at this scale for more than three months and continues to grow. It uses approximately 120 vCPUs and 350 GiB of memory. Customer measurements compare an estimated 250 TB of logical incoming telemetry per day with 5–6 TB of resulting Parquet data in object storage. This is an observed end-to-end storage result, not a controlled codec benchmark; replication, retention settings, data shape and workload can change the ratio. These production observations are workload-specific, not performance guarantees.
Read the production case study for a closer look at how Parseable handles around 100 million time series, from OpenTelemetry ingestion through Parquet pruning during queries.
The High-Cardinality Observability solution page explains the product architecture, use cases and evaluation criteria.
Conclusion
High cardinality is valuable when it preserves the identifiers engineers need during an investigation. It becomes harmful when unbounded values are placed in metric labels or another storage model that creates permanent index structures for every unique combination.
Keep metric labels bounded, normalize routes and move per-request detail into logs or traces. If high-cardinality fields still make queries or retention unpredictable, evaluate whether the storage architecture matches the shape of the telemetry.
Try Parseable with a representative sample of high-cardinality telemetry and compare query performance, retained context and storage cost.