
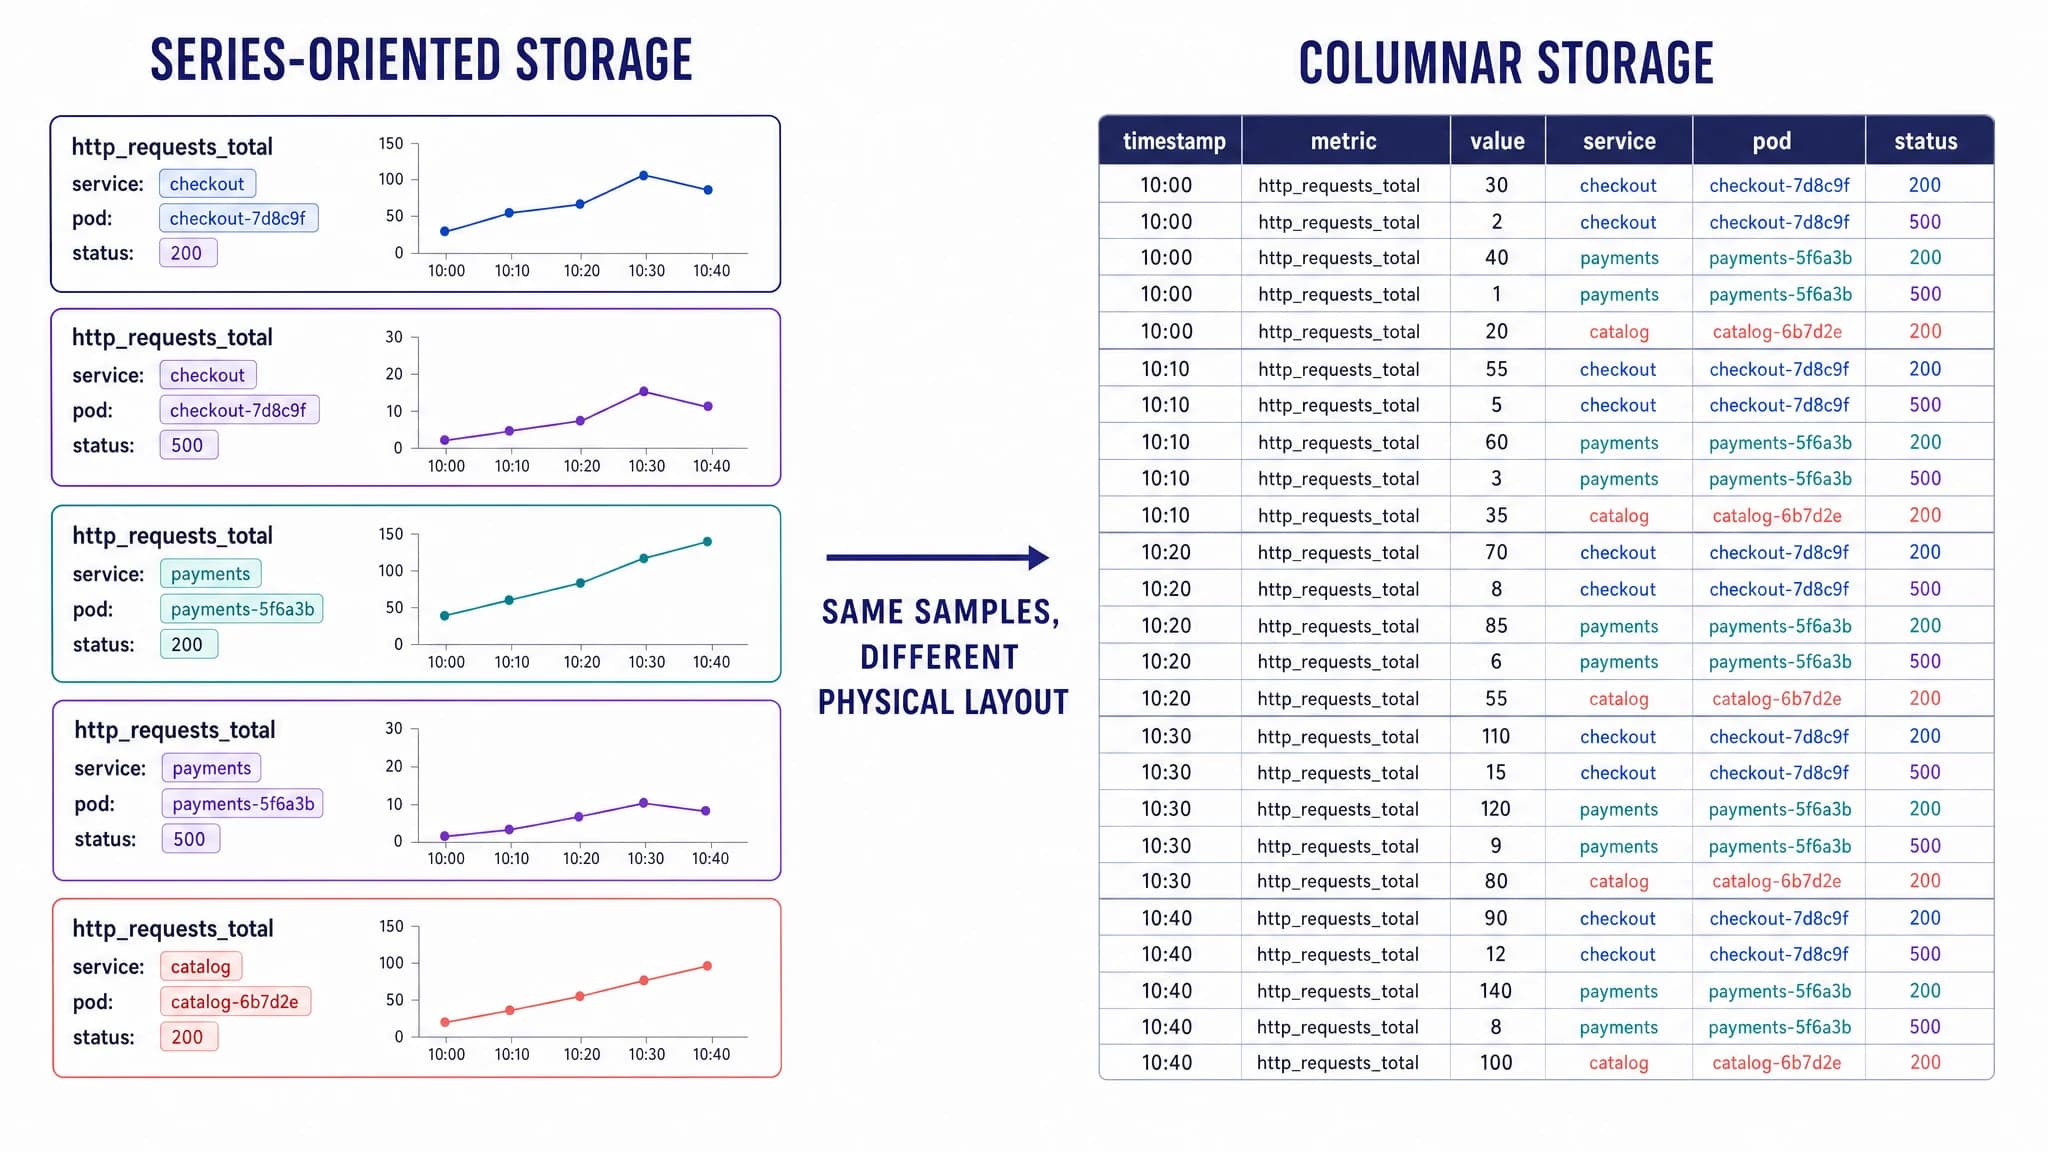
High-cardinality metrics often begin with a useful label. Someone adds a pod name to isolate deployment failures, a customer ID to understand impact or a raw URL to investigate errors. Then the number of time series starts climbing because every observed combination of a metric name and its label values identifies a separate series.
Labels such as user_id, raw URL, pod name or build SHA can turn one metric into millions of active or rapidly changing series. A columnar time-series architecture changes how those samples are stored and queried. It can keep labels as columns, use Parquet metadata to skip irrelevant data and avoid keeping every historical label set as a permanently resident series object.
Large scans, wide aggregations, poor sorting and uncontrolled ingestion still consume resources.
This guide explains where metrics cardinality costs arise, what columnar storage changes and when a series-oriented, columnar or hybrid architecture fits the workload.
In this guide
- Why high-cardinality metrics become expensive
- What columnar storage changes
- How Parquet and DataFusion reduce query work
- What columnar storage does not solve
- How Parseable handles high-cardinality metrics
- How to choose a storage model
Why high-cardinality metrics become expensive
Prometheus defines a time series as a stream of timestamped values with one metric name and one set of labels. Changing, adding or removing a label value creates another series.
Consider this metric:
http_requests_total{
  service="checkout",
  route="/orders/:id",
  status="500",
  pod="checkout-7d9bc6-zk8wl"
}
The following sample belongs to another series because the pod value changed:
http_requests_total{
  service="checkout",
  route="/orders/:id",
  status="500",
  pod="checkout-86bd74-n2r7p"
}
If an application has 10 services, 50 normalized routes, 5 status classes, 4,000 pods and 20 observed deployment versions, the upper bound is:
10 × 50 × 5 × 4,000 × 20 = 200,000,000 possible label combinationsThat number is an upper bound, not a prediction. A time-series system creates series only for combinations that occur, and correlations between labels may keep the observed count far lower. An unbounded label such as user_id changes the picture because new values keep arriving.
If you need the underlying definitions first, read what high cardinality means, including the difference between field cardinality and series cardinality.
Series metadata consumes resources
A series-oriented metrics system must identify each active label set and associate incoming samples with it. Depending on the implementation, this involves label indexes, series metadata, write-ahead logs, head blocks, caches and compaction work.
Prometheus warns that every label set adds RAM, CPU, disk and network costs. The exact cost per series varies by backend and workload, so there is no universal safe series count.
If you are diagnosing an existing Prometheus deployment, use the Prometheus cardinality runbook to rank metrics, isolate expensive labels and verify each change.
Series-oriented systems can scale much further when they distribute that state. Grafana's Mimir load test reached 1 billion active series on a 1,500-replica cluster with about 7,000 CPU cores and 30 TiB of RAM, illustrating both the achievable scale and the infrastructure involved.
The same principle applies to derived metrics. The OpenTelemetry SpanMetrics Connector guide shows how dimension selection and cardinality limits affect generated RED metrics.
Churn can matter as much as the active count
Cardinality explosion is not limited to a large steady set of labels. Kubernetes pod names, ephemeral job IDs, raw routes and build identifiers continually create new label sets. A system may have a manageable number of active workloads while generating a much larger number of series over a day or retention window.
Churn adds work to ingestion, indexing, compaction and retention. It also reduces the value of caches because new series repeatedly replace old ones.
Queries pay for matched series and samples
A query such as:
sum by (service) (
  rate(http_requests_total{status="500"}[5m])
)
first identifies matching series and then reads samples from the selected time range. Broad matchers, long time ranges or group by operations over high-cardinality labels can make both stages expensive. Fast ingestion alone does not guarantee fast queries.
What columnar storage changes
A columnar system can represent metric samples as rows with separate columns for the timestamp, metric name, value and selected attributes:
| timestamp | metric_name | value | service | route | status | pod |
|---|---|---|---|---|---|---|
| 10:00:00 | http_requests_total | 1 | checkout | /orders/:id | 500 | checkout-7d9bc6-zk8wl |
| 10:00:01 | http_requests_total | 1 | checkout | /orders/:id | 200 | checkout-86bd74-n2r7p |
Each column is encoded and stored separately within a row group. A query that needs timestamp, value, service and status does not have to read the pod or route values.
Columnar storage shifts where and when the system pays the cost:
- Historical labels do not all need separate in-memory series objects. The values can live in encoded column chunks on object storage.
- Queries can read only the required columns. Wide telemetry records do not force wide reads.
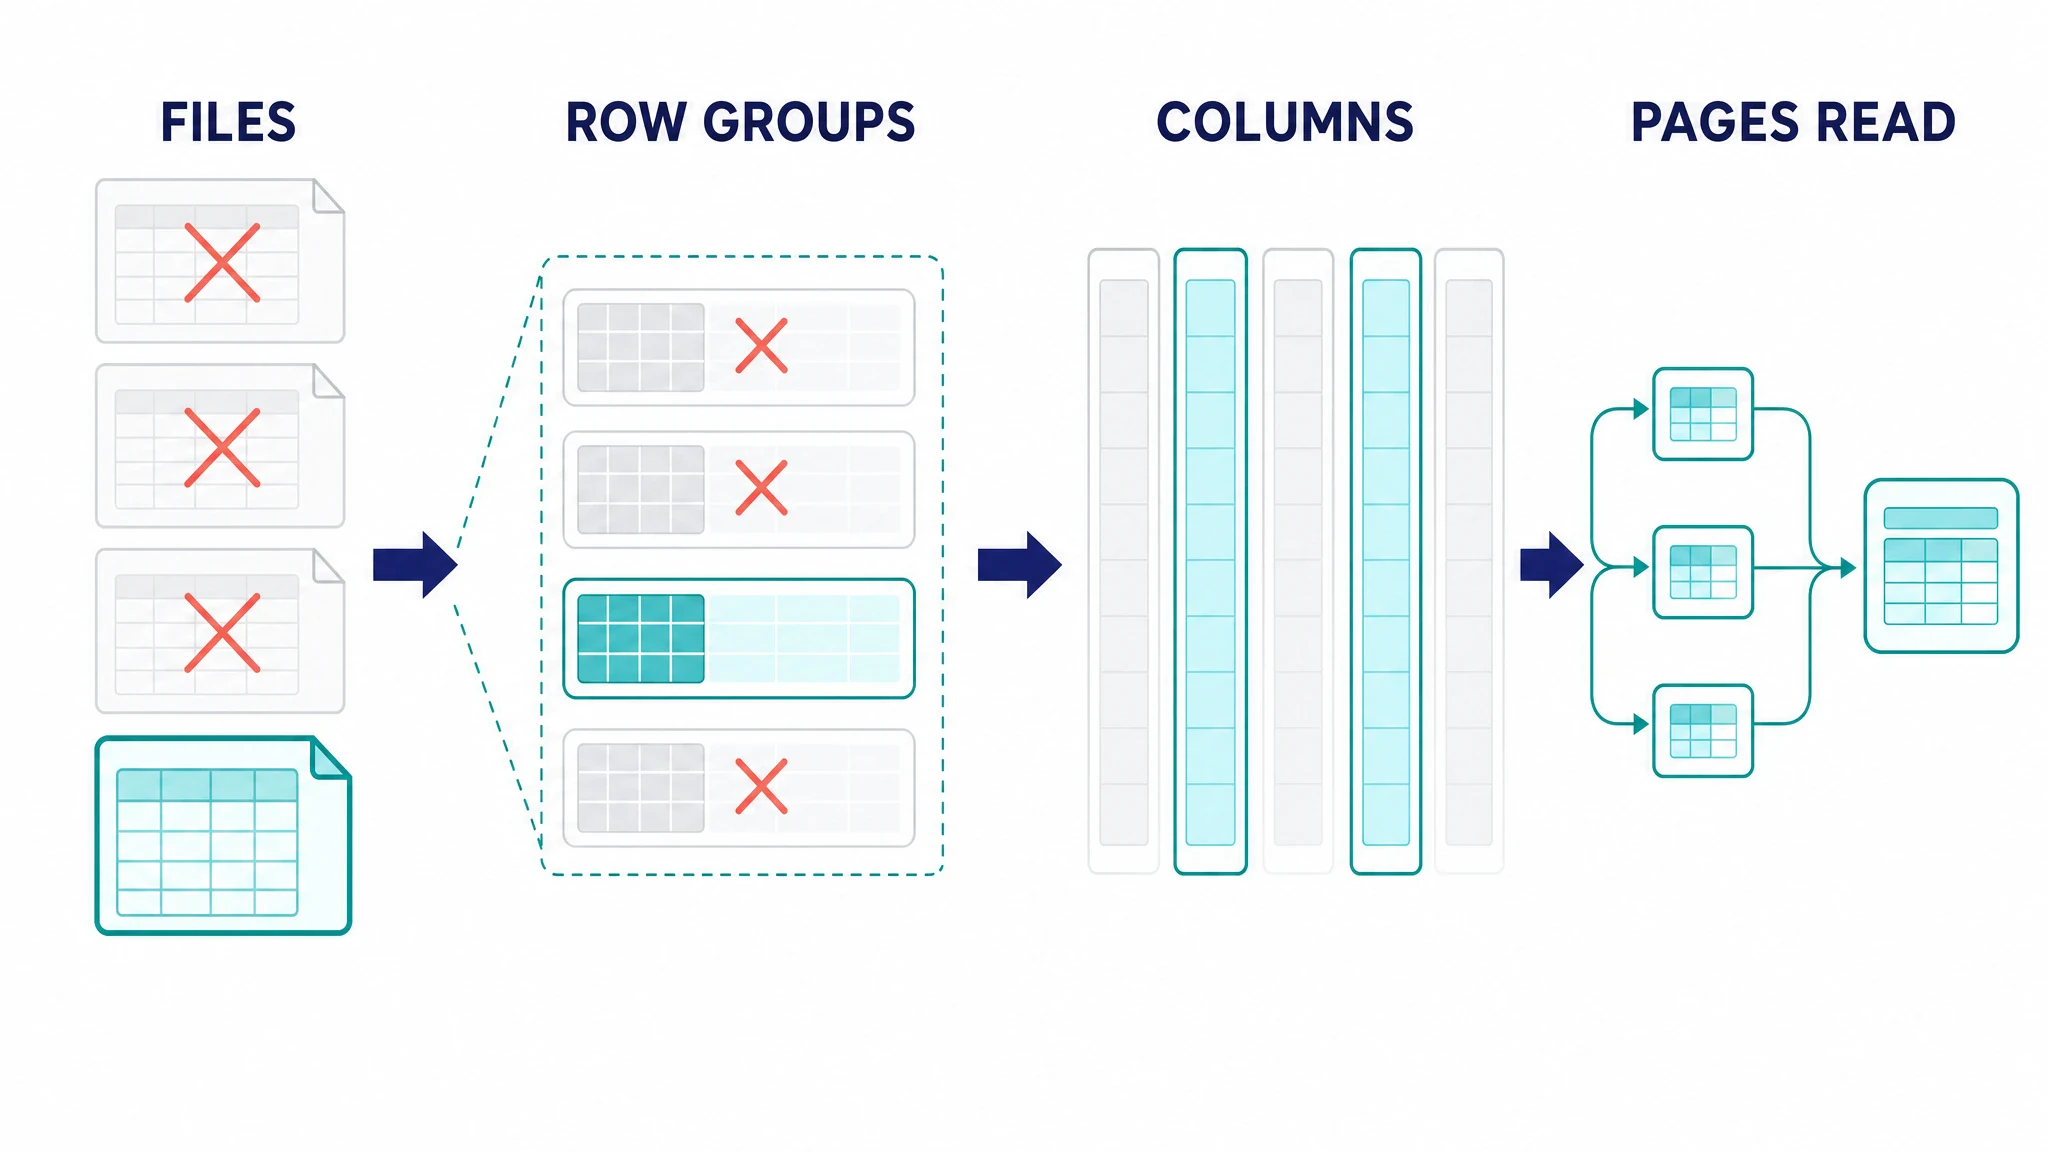
- Metadata can eliminate irrelevant row groups and pages. Queries may scan only a fraction of the stored samples.
The number of rows still grows with the number of samples. High-cardinality values still occupy storage, and grouping by millions of values still requires CPU and memory. Columnar storage changes which structures grow and when the system pays the cost.
How Parquet and DataFusion reduce query work
Apache Parquet is a column-oriented file format organized into row groups, column chunks and pages. This layout supports several forms of pruning.
Projection pruning reads fewer columns
For this query:
SELECT
  service,
  sum(value)
FROM metrics
WHERE metric_name = 'http_requests_total'
  AND status = '500'
  AND timestamp >= now() - interval '15 minutes'
GROUP BY service;
the engine needs only service, value, metric_name, status and timestamp. Projection pruning skips unrelated columns such as pod, namespace, trace_id and deployment_version.
Row-group and page pruning read fewer rows
Parquet files can contain statistics such as minimum and maximum values for each column chunk. If a row group's time range falls outside the query window, the engine can skip it before reading its samples. Page indexes and Bloom filters can provide finer-grained pruning when they are present and useful.
DataFusion's Parquet reader combines projection pruning with row-group statistics, optional Bloom filters and page-level statistics. Pruning works best when file layout, sorting, partitioning and query predicates align.
Encoding and compression remain data-dependent
Low-cardinality columns such as status class often compress well with dictionary or run-length encoding. High-cardinality strings may not. Their compression depends on repetition, ordering, prefixes, value length and the selected encoding.
This is why “columnar storage cost equals the sum of distinct values” is not a useful model. A real system stores samples, null information, encodings, file metadata and indexes. Measure the encoded bytes and query work for representative data instead of estimating storage from cardinality alone.
For a deeper explanation of the file format and storage economics, read why observability data belongs in Apache Parquet.
What columnar storage does not solve
Columnar time-series storage solves a different set of problems, so it comes with a different set of constraints.
Unselective queries still scan data
A query that reads every service, pod and user over 90 days may touch most row groups and produce a large aggregation state. Projection pruning helps only when the query selects a subset of columns. Predicate pruning helps only when metadata can rule data out.
Point lookups need a suitable layout or index
Searching for one random trace_id or user_id can be inefficient when files are sorted only by time and contain no useful Bloom filter or secondary index. High-cardinality databases still need deliberate partitioning, sorting, caching and indexing choices.
Small files increase metadata and object-store overhead
Writing many tiny Parquet files increases listing, metadata decoding and request costs. Ingestion systems need buffering and compaction policies that create useful row-group and file sizes without adding unacceptable latency.
Real-time alerting still needs fresh data
Object storage is well suited to durable history, but dashboards and alerts also need recent samples. A practical architecture often combines an ingestion buffer or hot tier with Parquet-backed history rather than forcing every query through one storage path.
This hot-and-cold pattern is explained further in the observability data lake architecture guide.
Resource limits still exist
High-cardinality grouping can exhaust memory in any engine. Concurrency, spill behavior, query limits, caching and workload isolation remain operational requirements.
How Parseable handles high-cardinality metrics
Parseable writes telemetry to Apache Parquet on object storage and queries it with a columnar execution engine. Metric labels remain available as fields, allowing teams to filter and aggregate them without requiring every historical combination to stay in an in-memory series store.
One production deployment processes approximately 2 million metric data points per second across 34,000 metrics. At a typical point in time, the workload contains the equivalent of 90–100 million unique metric-and-label combinations, including one field with approximately 2.5 million distinct values. The deployment uses approximately 120 vCPUs and 350 GiB of memory and has operated at this scale for more than three months.
These measurements describe one workload, not a universal benchmark. Data shape, label distribution, query concurrency, retention, replication and hardware affect the result.
The production case study on how Parseable handles around 100 million time series follows this workload through ingestion, Parquet conversion, object storage and query pruning.
The High-Cardinality Observability solution explains the product architecture and evaluation path.
How to choose a storage model
The right architecture depends on which costs dominate your workload.
| Requirement | Series-oriented TSDB | Columnar event store | Hybrid architecture |
|---|---|---|---|
| Low-latency scraping and alerting | Strong fit | Requires an ingestion or hot layer | Strong fit |
| Bounded infrastructure labels | Strong fit | Works, but may be unnecessary | Strong fit |
| High-cardinality historical analysis | Can become expensive | Strong fit with good layout | Strong fit |
| Exact lookup by arbitrary identifier | Depends on indexes | Depends on sorting or indexes | Route to the appropriate tier |
| Long retention on object storage | Backend-dependent | Strong fit | Strong fit |
| PromQL compatibility | Native in Prometheus-style systems | Requires a compatible query layer | Can preserve PromQL workflows |
Use representative data to evaluate a candidate system:
- Measure active series, new series per hour and samples per second.
- Test both dashboard queries and worst-case exploratory queries.
- Compare ingest resources, query resources, encoded storage and compaction overhead separately.
- Repeat tests across the retention windows your team actually uses.
- Confirm what happens when queries exceed memory or concurrency limits.
There is no database with “unlimited cardinality.” What matters is choosing where series metadata, encoded samples, indexes and query state should live for your workload.
Conclusion
High-cardinality metrics make series-oriented systems expensive when label combinations and churn create more metadata than the active workload can support. Columnar time-series storage offers a different model: keep labels as columns, store samples in encoded files and defer much of the cost until a query reads or aggregates the data.
That model works well for selective analysis and long retention. It still requires bounded instrumentation, good file layout, resource controls and workload testing. Keep unbounded identifiers out of metric labels when possible. When rich dimensions are necessary, evaluate their incident-investigation value across ingestion, retention and query execution.
Try Parseable with a representative metrics workload and compare ingestion resources, query latency and retained storage.