

Logs are often the first place engineers look during an incident, but they are also one of the easiest telemetry signals to lose control of. Modern teams collect logs from microservices, Kubernetes pods, cloud infrastructure, APIs, databases, queues, and third-party systems. When those logs are spread across disconnected tools, investigations slow down, retention costs rise, and critical signals get buried in noise.
That is why choosing the right logging tool matters. The strongest logging tools do more than collect and store events. They help teams parse, search, query, monitor, alert, visualize, retain, and correlate logs with metrics and traces, so incidents can move from signal to root cause without switching across multiple systems.
This guide compares the 10 best logging tools by features, pricing, deployment model, pros, cons, and best-fit use case. Whether you are evaluating log monitoring tools for a cloud-native environment, looking for open source logging tools to self-host, or comparing centralized logging tools to reduce observability cost, this comparison covers the options that matter in 2026.
10 Best logging tools at a glance
| Tool | Best for | Deployment | Open source | Pricing model | Key strength |
|---|---|---|---|---|---|
| Parseable | Cost-efficient unified observability | Self-hosted, Cloud | Yes | Usage-based, self-hosted | S3-native columnar storage, unified MELT |
| Datadog | Existing Datadog observability users | SaaS | No | Per GB ingested + indexing | Largest integration ecosystem |
| Better Stack | Startups and fast incident response | SaaS | No | Usage-based | Logs + alerting + incident response |
| Elastic Stack | Full-text search and Elastic-native teams | Self-hosted, Cloud | Yes (core) | Open source / subscription | Elasticsearch full-text search |
| Grafana Loki | Grafana and Kubernetes teams | Self-hosted, Cloud | Yes | Open source / usage-based | Label-based cost-efficient log storage |
| Splunk | Enterprise security and large-scale analytics | Self-hosted, Cloud | No | Custom / ingest-based | SPL analytics and SIEM |
| New Relic | APM-led full-stack observability | SaaS | No | 100 GB free, then per GB | APM and log correlation |
| Sumo Logic | Cloud-native security and compliance | SaaS | No | Custom | Security analytics and compliance |
| Graylog | Self-hosted, cost-sensitive teams | Self-hosted, Cloud | Yes (core) | Open source / paid tiers | OpenSearch-backed self-hosted logging |
| Axiom | Long-retention cloud log analytics | SaaS | No | Usage-based | Fast queries and long retention |
Try Parseable for free and see how it performs on your own log data.
What are logging tools?
Logging tools help teams collect, centralize, search, analyze, monitor, and alert on logs from applications, infrastructure, containers, cloud services, APIs, and databases. They serve as the foundation of operational visibility, giving engineering teams the data they need to debug issues, detect anomalies, meet compliance requirements, and understand system behavior.
The category is broad. It includes pure log collectors like Fluent Bit and Logstash, dedicated log monitoring tools like Better Stack, full log management platforms like Graylog and Elastic Stack, and unified observability platforms like Parseable, Datadog, and New Relic that bring logs together with metrics, traces, and events.
This article covers platforms that provide meaningful log management capabilities: tools where teams can ingest, store, search, query, and act on log data as a core part of their workflow. That is why Parseable, Datadog, Better Stack, Elastic Stack, Grafana Loki, Splunk, New Relic, Sumo Logic, Graylog, and Axiom all belong in the same comparison, even though they approach the problem differently.
What logging tools actually do
A logging tool is not just a place to dump log data. At a minimum, the best logging platforms handle:
- Ingestion: Accepting logs from agents, collectors, SDKs, or direct API calls at volume and speed
- Parsing: Extracting structured fields from raw log lines, JSON, or semi-structured formats
- Storage: Persisting logs in a format that balances query speed, cost, and retention length
- Search and querying: Finding specific log entries or aggregating patterns across millions of events
- Dashboards: Visualizing log trends, error rates, and system health over time
- Alerting: Notifying teams when log patterns match anomaly, error, or threshold conditions
- Retention: Keeping logs accessible for the time period required for debugging, compliance, or audit
- Correlation: Linking log events to related metrics, traces, and infrastructure signals for incident investigation
Teams that choose log management tools with all of these capabilities can investigate incidents end to end without leaving the platform. Teams that choose only a basic log collector will need to stitch together additional tools to cover search, dashboards, and alerting.
Logging tools vs log monitoring tools vs log management tools
These terms are often used interchangeably, but they describe different scopes:
- Logging tools is the broad category. It covers any tool involved in collecting, storing, searching, or analyzing log data.
- Log monitoring tools focus on real-time detection, alerting, and operational response. The goal is to surface problems as they happen, not just store data for later.
- Log management tools cover the full lifecycle: ingestion, indexing, storage, retention, governance, compliance reporting, and long-term access. Log management is a broader concern than real-time monitoring alone.
- Observability platforms combine logs with metrics, traces, and events inside a single workflow that includes dashboards, alerting, and incident response. Parseable, Datadog, New Relic, and Sumo Logic all sit in this category.
In practice, the strongest platforms like Parseable handle all of these capabilities together. That is why the logging tools category increasingly overlaps with observability logging tools.
What to look for in the best logging tools
Before comparing specific tools, frame what matters for your environment.
- Log collection and ingestion support: Can the tool receive logs from your actual sources (Kubernetes, AWS, application frameworks, agents like Fluent Bit or Vector) without requiring heavy pipeline engineering?
- Search and query experience: Does the team use keyword search, structured filters, SQL-style querying, or full-text search? The query language matters more than it looks at first glance.
- Real-time monitoring and alerting: Can the tool surface anomalies, trigger threshold alerts, and route notifications to PagerDuty, Slack, or incident workflows?
- Dashboards and visualization: Does the platform include a native dashboard layer, or does it depend on external tools like Grafana?
- Retention and storage cost: What does it cost to keep 30 days, 90 days, or a year of logs searchable? Storage architecture has a bigger impact on long-term cost than the headline per-GB price.
- OpenTelemetry support: Does the tool accept OTLP natively? For teams standardizing on OpenTelemetry pipelines, this matters for both logs and broader telemetry.
- Deployment options: Does the team need SaaS, self-hosted, or a hybrid model? Compliance, data residency, and operational complexity all affect this choice.
- Integration with metrics, traces, and incident workflows: Can the tool correlate a log event with the related metric spike or distributed trace?
- Security, RBAC, SSO, audit logs, and compliance: For regulated environments, governance features are not optional.
- Pricing transparency and scale economics: Many logging tools look affordable at low volume but become expensive at scale. Always model the cost at 10x current ingestion before making a final decision.
Detailed review of the best logging tools
1. Parseable: Best logging tool for cost-efficient unified observability
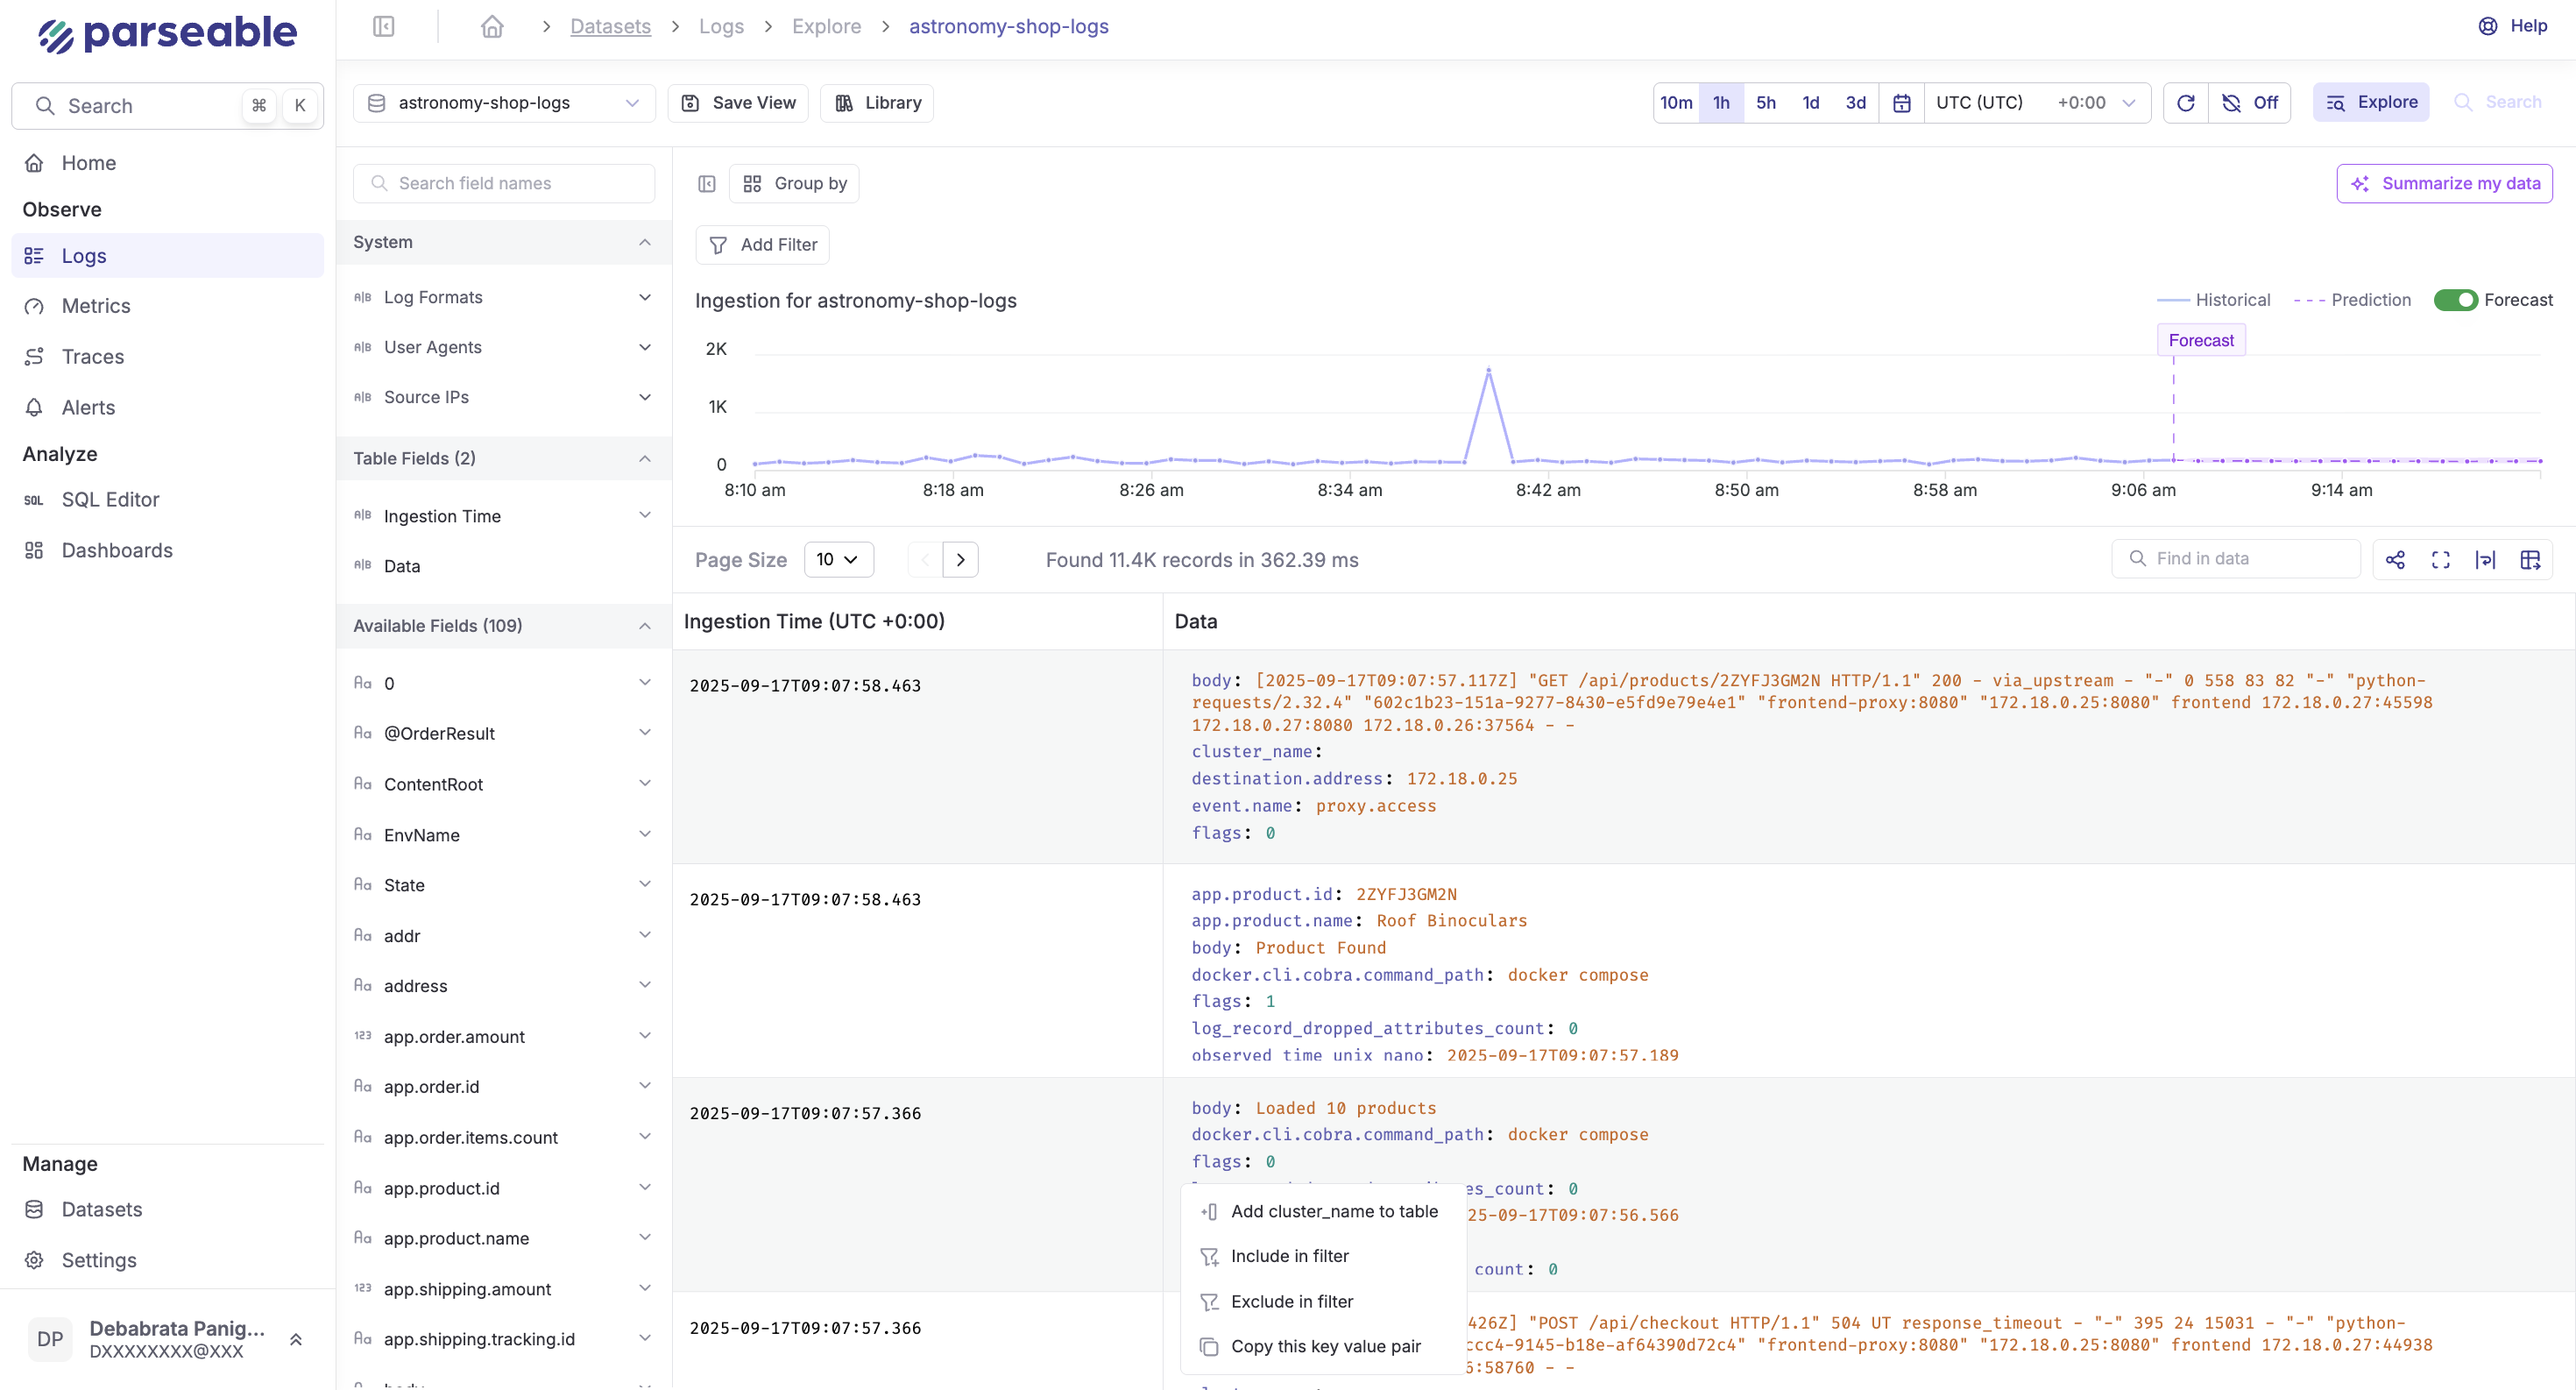
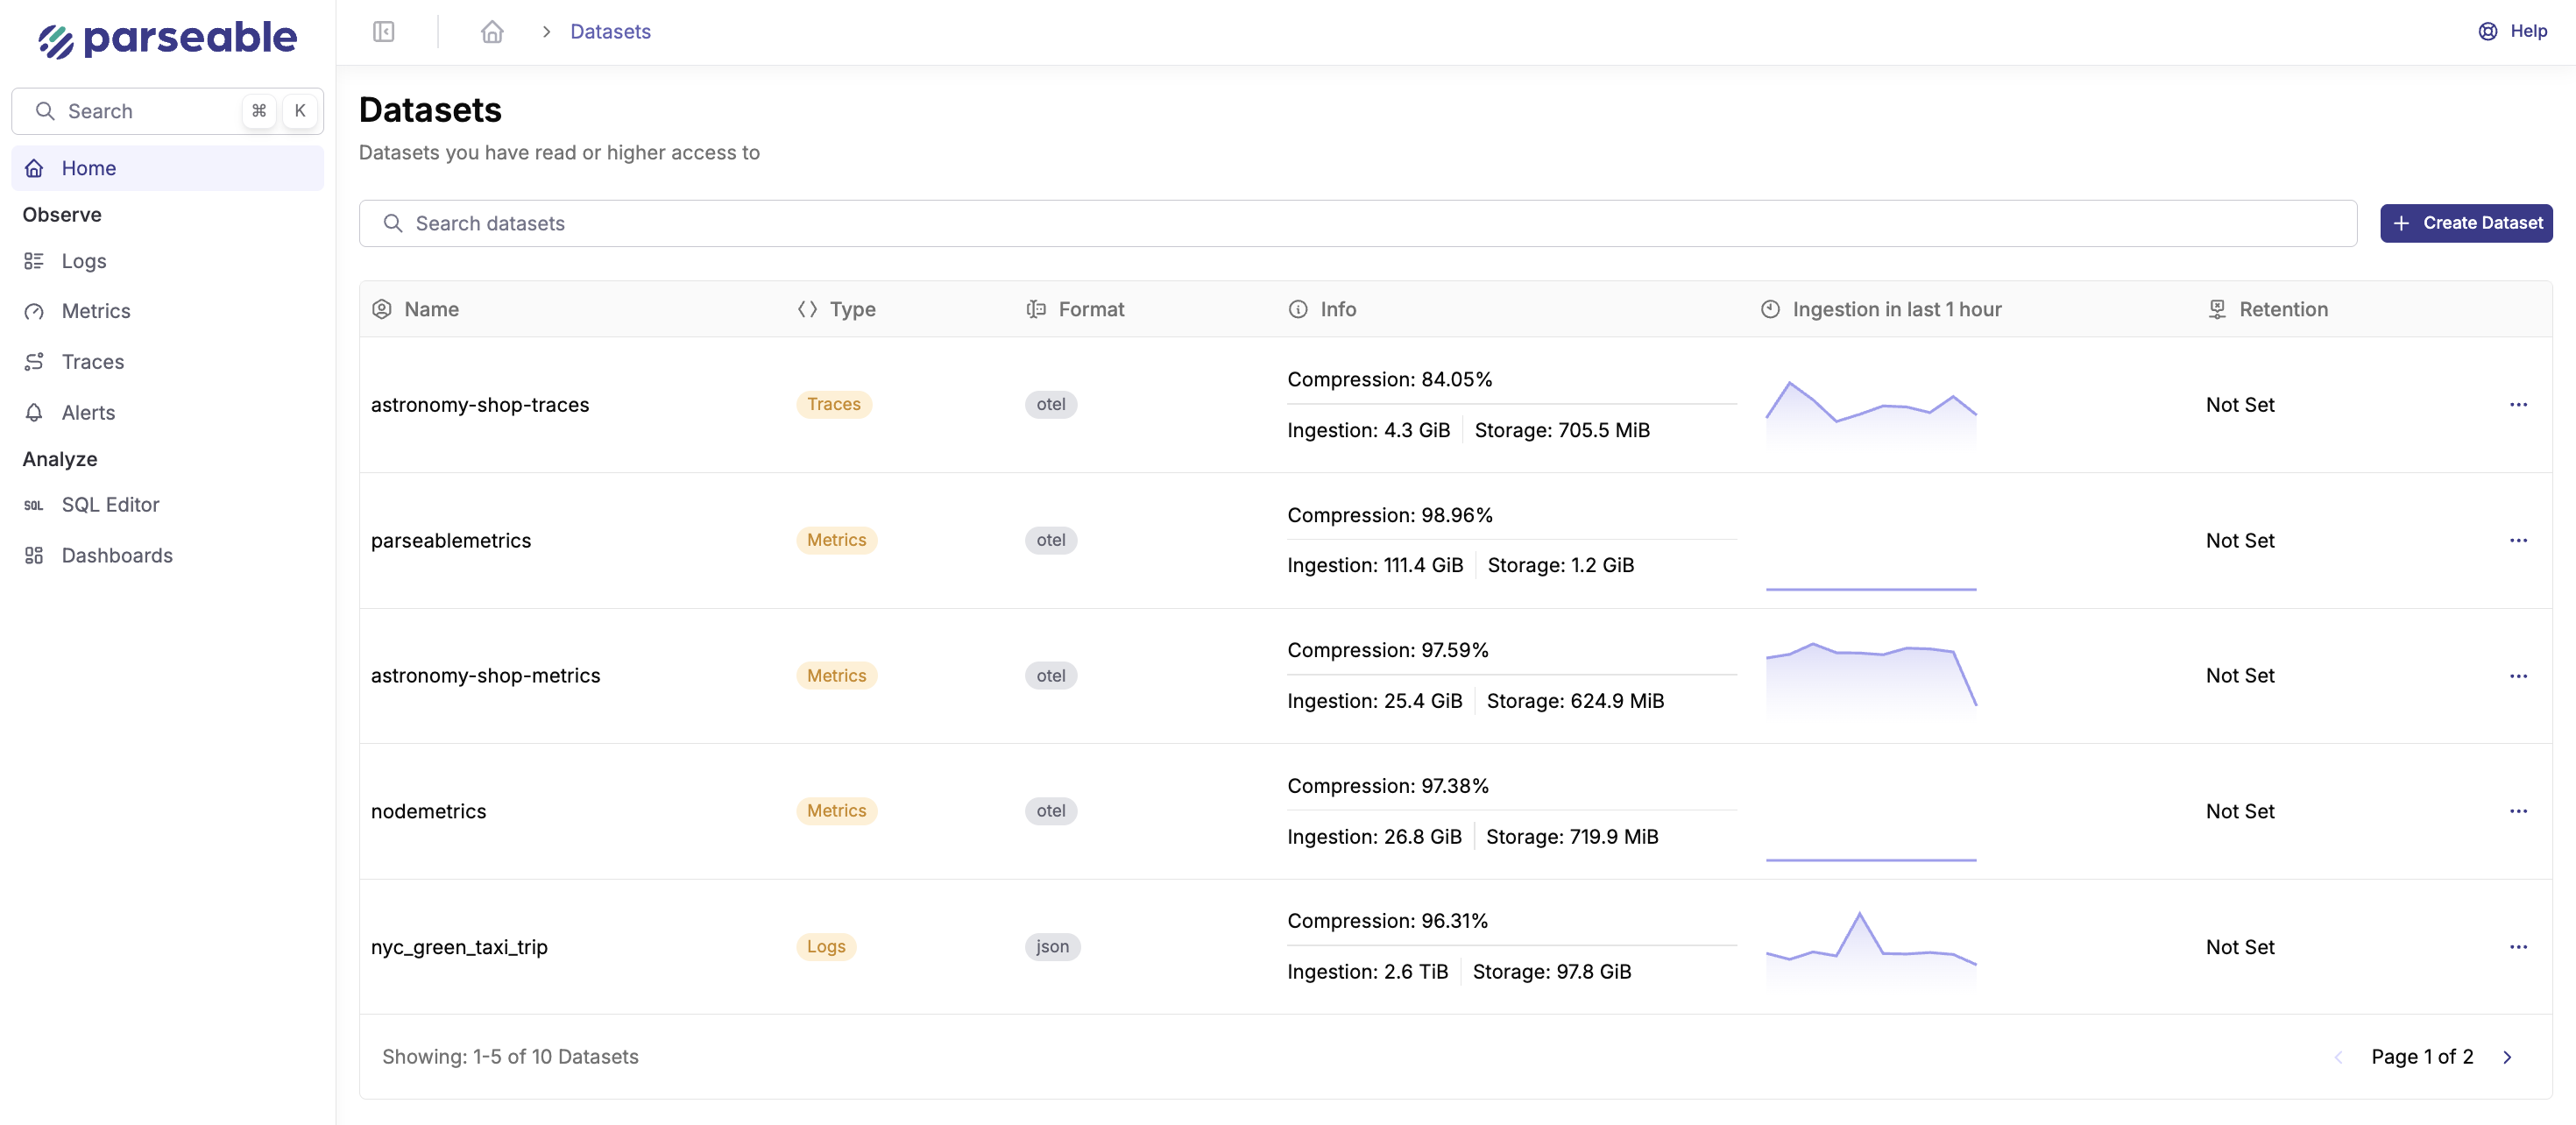
Parseable is the best logging tool for teams that want cost-efficient log management without giving up observability context. Instead of treating logs as a standalone data stream, Parseable brings logs, metrics, events, and traces into one unified platform, so engineering teams can investigate incidents without moving across multiple tools.
Its architecture is built around S3-compatible object storage and open columnar formats like Apache Parquet. That makes Parseable especially useful for teams dealing with growing log volumes, longer retention needs, and rising observability costs. Teams can keep logs searchable for longer while avoiding the heavy indexing and infrastructure overhead that makes traditional logging platforms expensive at scale.
Parseable also supports OpenTelemetry-native ingestion and SQL-based querying, which makes it easier to plug into modern observability pipelines. For teams that want application logging tools that are open, scalable, and built for full-stack observability, Parseable is a strong first choice.
What makes Parseable the best logging tool?
Parseable stands out because it solves the main trade-off in modern logging: teams want complete log data, fast search, long retention, and reasonable cost at the same time. Many traditional logging tools make one of those requirements expensive. Parseable approaches the problem differently by storing telemetry on object storage, querying it through SQL, and unifying logs with metrics, events, and traces in the same platform.
Where most logging software separates the logging layer from the observability layer, Parseable keeps them together. That reduces tool sprawl, simplifies incident workflows, and lowers the total cost of operating an observability stack.
Key features
- Unified observability for logs, metrics, events, and traces: Parseable brings the core observability signals together in one platform, helping teams move from a log entry to the related metric, event, or trace during investigations.
- S3-native storage for lower cost: Parseable stores telemetry on S3-compatible object storage, which helps reduce the cost of retaining large volumes of log data compared to traditional indexing-heavy platforms.
- Open columnar storage with Apache Parquet: Logs and telemetry are stored in an open columnar format, making Parseable more efficient for analytical queries and reducing the risk of proprietary data lock-in.
- SQL-based querying: Teams can query log data using SQL instead of learning a proprietary query language, which makes investigation workflows more accessible across engineering and data teams.
- Plain-English querying: Parseable helps teams ask questions in natural language where relevant, which reduces friction during investigation workflows.
- OpenTelemetry-native ingestion: Parseable works with modern telemetry pipelines through OpenTelemetry, making it easier to collect logs, metrics, and traces from cloud-native systems.
- Deployment flexibility: Parseable can be used as a self-hosted platform or as Parseable Cloud, giving teams flexibility based on compliance, data control, and operational preferences.
- Built for scale and retention: Parseable is a strong fit for teams that need to retain large log volumes for longer periods without moving older data into expensive or hard-to-query archives.
Best for
- Teams that want to reduce observability cost at scale without sacrificing log retention
- DevOps, SRE, and platform teams managing high-volume logs
- Organizations that want unified logs, metrics, events, and traces in one platform
- Teams that prefer SQL-based log querying over proprietary query languages
- Cloud-native teams already using or planning to adopt OpenTelemetry
- Companies that need self-hosted, cloud, or hybrid deployment flexibility
- Teams replacing fragmented logging and observability stacks with a single platform
Pricing
- Parseable is available as an open-source, self-hosted platform and as Parseable Cloud. Self-hosted pricing depends on the infrastructure and object storage the team uses.
- Parseable Cloud provides a managed option for teams that want the same architecture without operating the backend themselves. Parseable Cloud pricing starts from $0.39/GB ingested based on Parseable's published pricing references.
- For enterprise pricing and custom deployments, visit our pricing page.
Pros
- Cost-efficient architecture for high-volume logs and long retention
- Unified logs, metrics, events, and traces in one platform
- SQL-based querying makes log analysis and log analysis tools more accessible across engineering teams
- Plain-English querying helps teams move faster during investigations
- OpenTelemetry-native ingestion fits modern observability pipelines
- S3-compatible storage supports longer retention at lower cost
- Open columnar storage with Apache Parquet reduces lock-in risk
- Self-hosted and managed cloud options give teams deployment flexibility
Cons
- Some enterprise capabilities require the Enterprise plan
- Teams migrating from legacy logging tools may need to rebuild dashboards, alerts, or saved queries
Want to test a logging tool before committing? Send a sample workload to Parseable and compare query speed, retention cost, SQL-based investigation, dashboards, and alerts on your own log data.
2. Datadog: Best logging tool for teams already using Datadog observability
Datadog is the leading SaaS observability platform for teams that want logs, metrics, traces, dashboards, APM, and alerting inside one managed workflow. If a team is already using Datadog for infrastructure monitoring or application performance monitoring, adding log management is straightforward and keeps investigation workflows in one place.
Datadog Log Management includes log ingestion, a live search interface, log pipelines for parsing and enrichment, tiered storage options, and log-to-trace correlation. It integrates with over 600 technologies out of the box and fits naturally into teams that have already standardized on the Datadog agent and dashboard ecosystem.
The main consideration is cost. Datadog's pricing model compounds across ingestion, indexing, retention, and other product modules. Teams with high log volumes need to model costs carefully before committing, especially at scale.
Key features
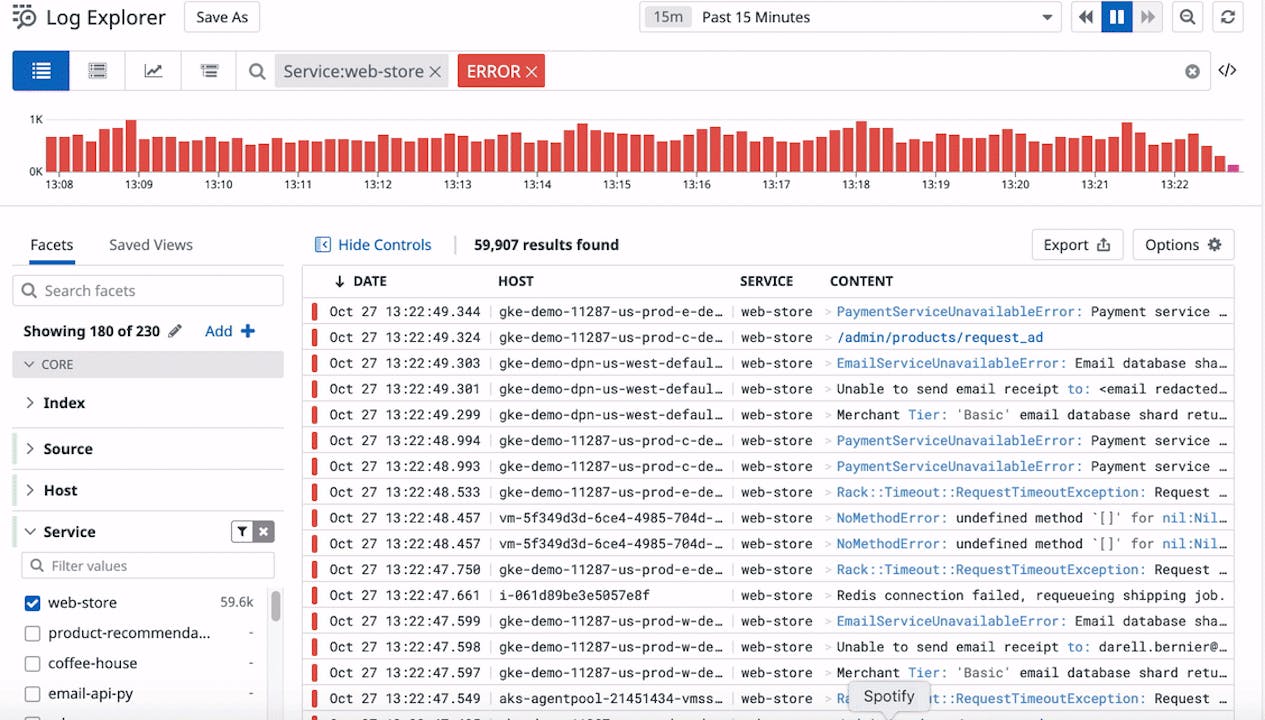
- Log Explorer and live search: Search and filter log streams in real time with flexible query syntax and faceted filtering
- Log pipelines and parsing: Transform raw logs into structured data using processors, grok patterns, and enrichment rules
- Log-to-trace correlation: Move directly from a log entry to the associated distributed trace for faster incident investigation
- Dashboards and alerts: Visualize log-derived metrics and set threshold-based or anomaly alerts with notification routing
Pricing
Datadog charges separately for log ingestion and log indexing. The base ingestion rate starts at $0.10 per GB. Indexing costs and retention pricing vary by tier and volume. Additional Datadog product modules (APM, infrastructure, synthetics) are priced separately. Teams evaluating Datadog should model costs at current and projected ingestion volumes before committing.
For teams considering Datadog, try Parseable for free before making the decision.
Pros
- Unified observability across logs, metrics, traces, APM, and infrastructure in one platform
- Largest integration ecosystem of any commercial logging tool
- Strong log-to-trace correlation for incident investigation
- Well-documented with strong ease of onboarding
- Reliable SaaS platform with strong uptime and global coverage
Cons
- Pricing compounds quickly across ingestion, indexing, retention, and additional modules
- Vendor lock-in is significant once dashboards, alerts, and agents are standardized on Datadog
- Not cost-efficient for teams that need long-retention log analytics without using the broader Datadog platform
- Data residency options are limited compared to self-hosted platforms
3. Better Stack
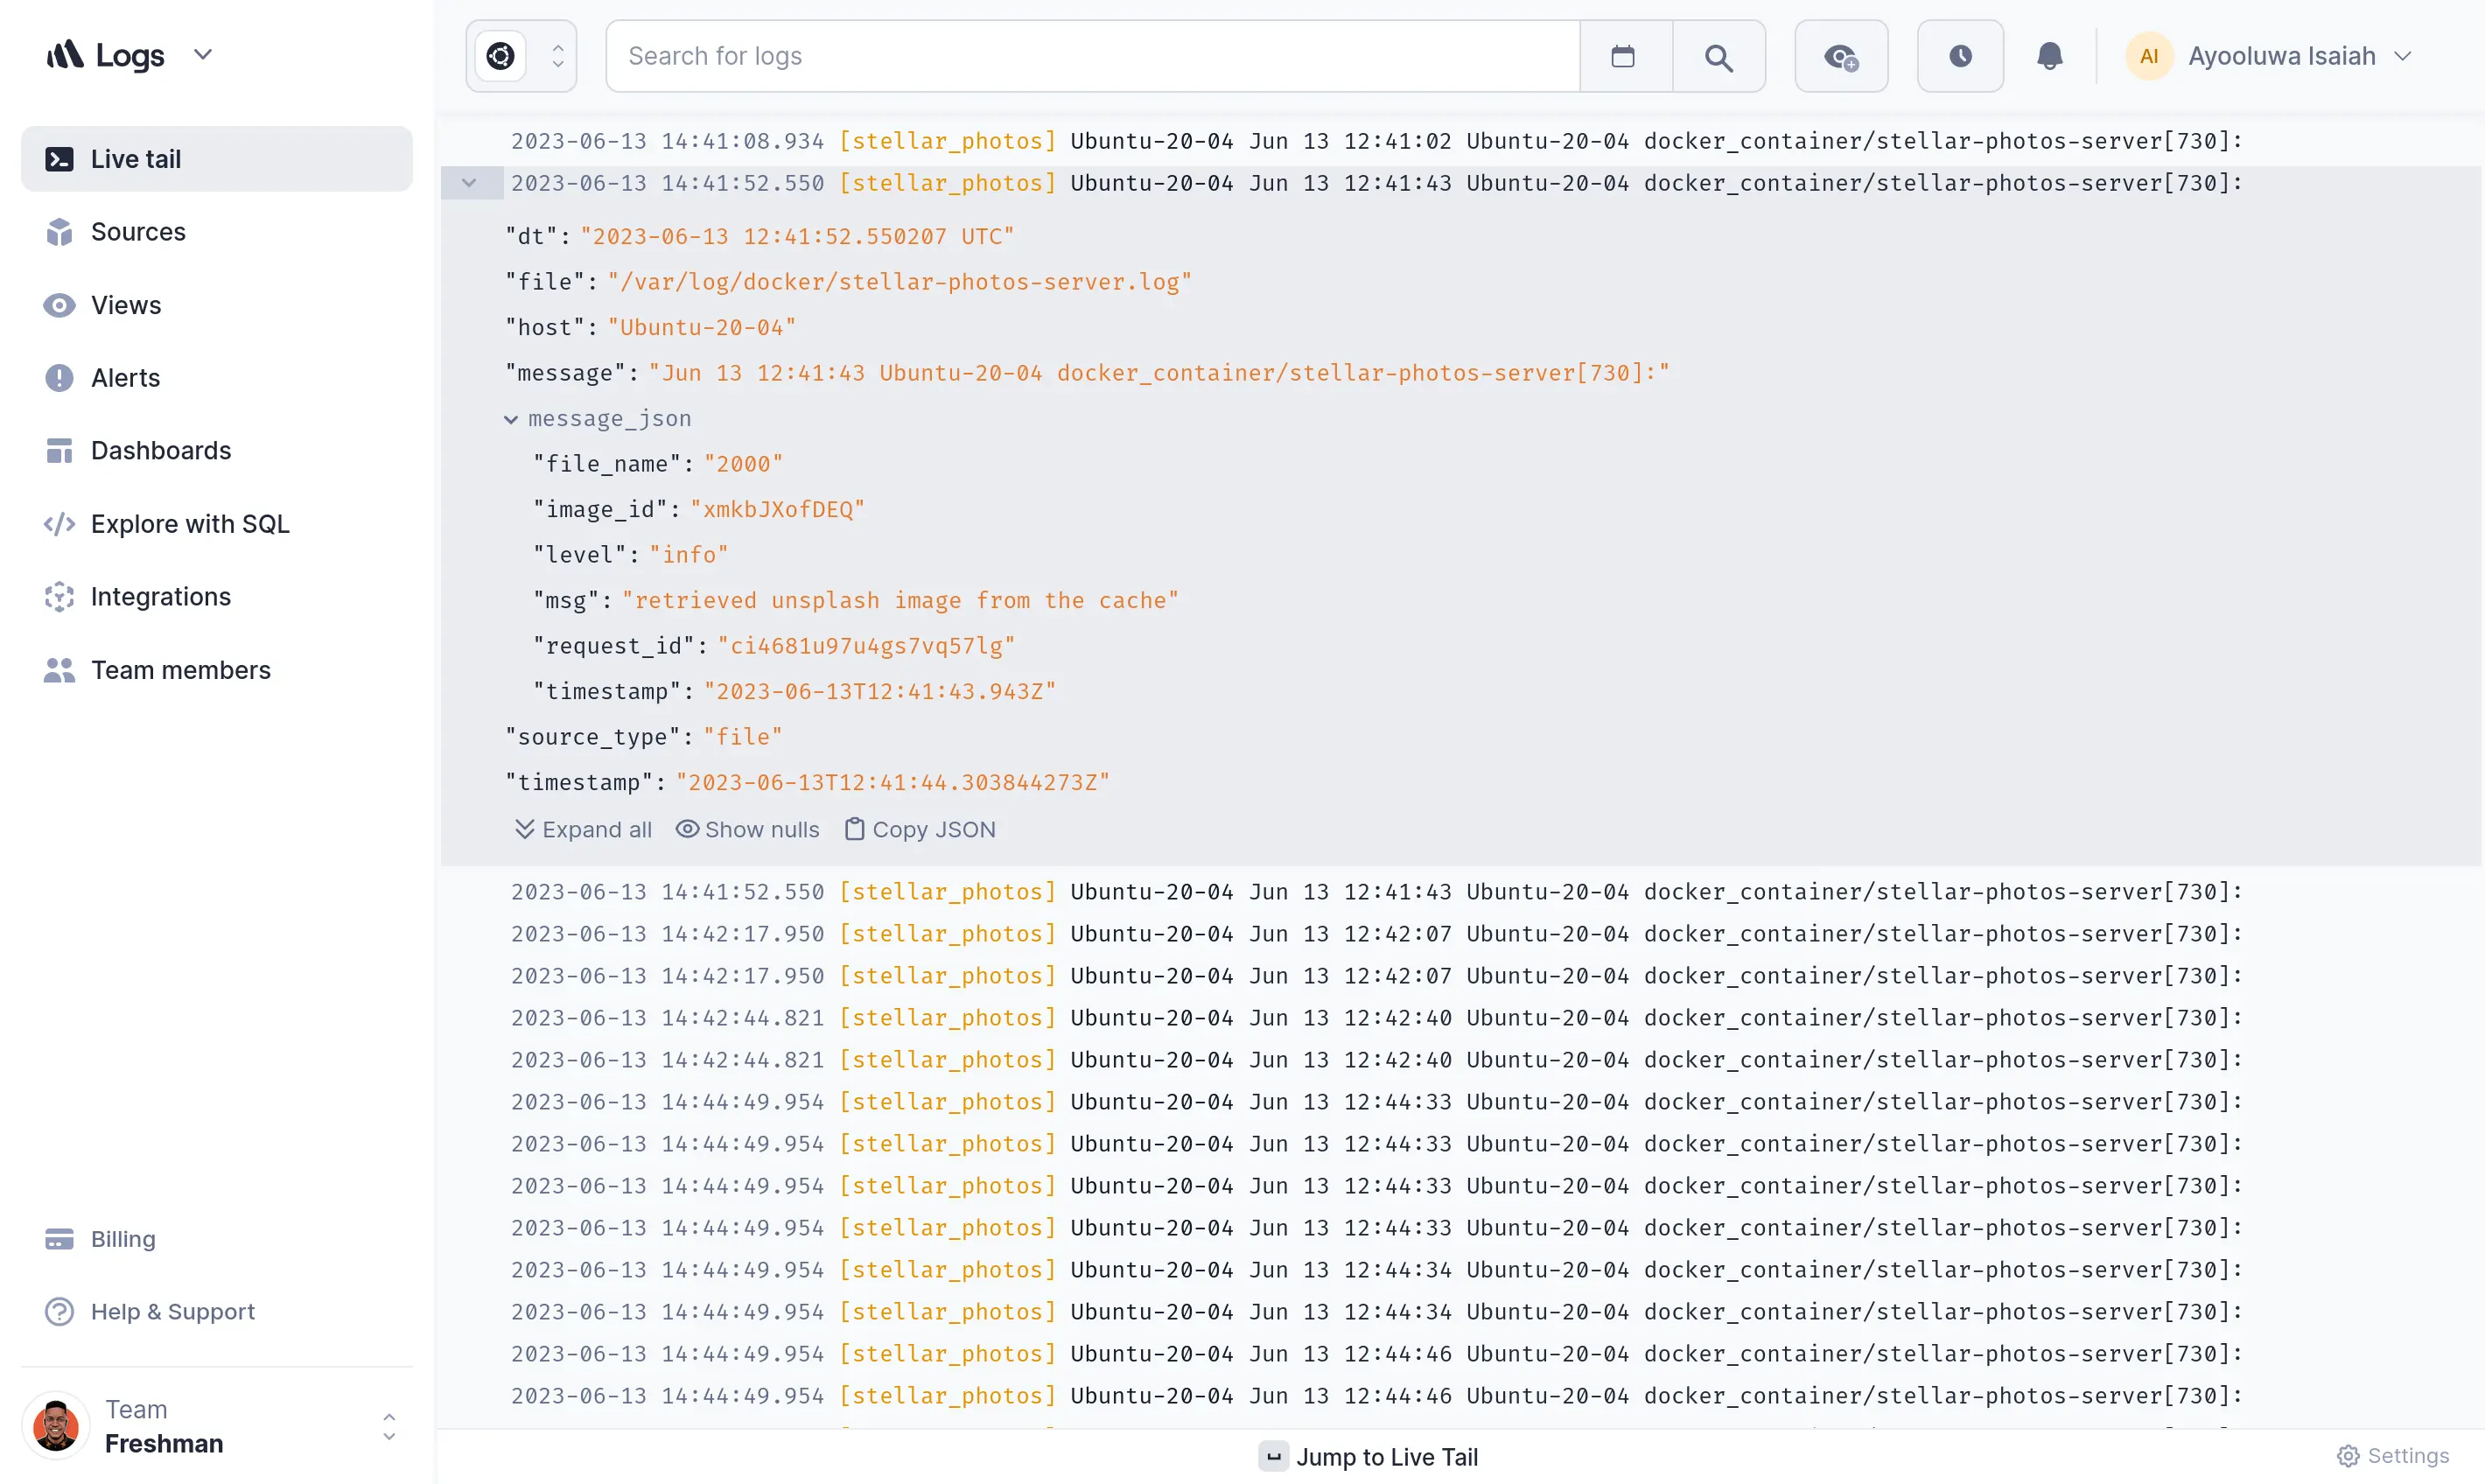
Better Stack is a modern logging and incident response platform designed for teams that want centralized logs, live tailing, SQL-style querying, dashboards, alerting, and on-call workflows in one product. It is particularly popular with startups and developer-focused teams that want fast time to value without managing infrastructure.
Better Stack combines log management with uptime monitoring, incident management, and status page functionality. That makes it a strong choice for teams that want a single platform covering logs, alerts, and incident response rather than integrating separate tools for each layer.
Key features
- Centralized log aggregation: Collect logs from applications, infrastructure, Kubernetes, and cloud services through standard integrations
- SQL-compatible log querying: Query log data using SQL-style syntax, which is accessible to developers and data teams without a proprietary language learning curve
- Live tailing: Monitor log streams in real time for immediate visibility during deployments or active incidents
- Dashboards and alerting: Build dashboards from log data and set threshold or anomaly-based alerts with notification routing
- Incident management and on-call workflows: Route alerts to on-call engineers, manage escalation policies, and track incident timelines
- Uptime monitoring and status pages: Monitor endpoint availability and publish status pages alongside log-based alerting
Pricing
Better Stack offers a free plan that includes limited log ingestion and retention. Paid plans start from $24/month and scale based on ingestion volume, retention length, and team size.
Pros
- Combines log management with incident response and uptime monitoring in one product
- SQL-style querying is accessible without learning a proprietary query language
- Fast setup with standard integrations and no infrastructure to manage
- Strong fit for developer and startup teams that want logs connected to incident workflows
Cons
- Less mature for large-scale enterprise log analytics than Datadog, Splunk, or Elastic
- Fewer integrations than broader observability platforms
- Long-retention log analytics and deep security capabilities are limited compared to specialized cloud logging tools
- SaaS-only deployment may not suit teams with data residency or compliance requirements
4. Elastic Stack: Best logging tool for full-text search and Elastic-based teams
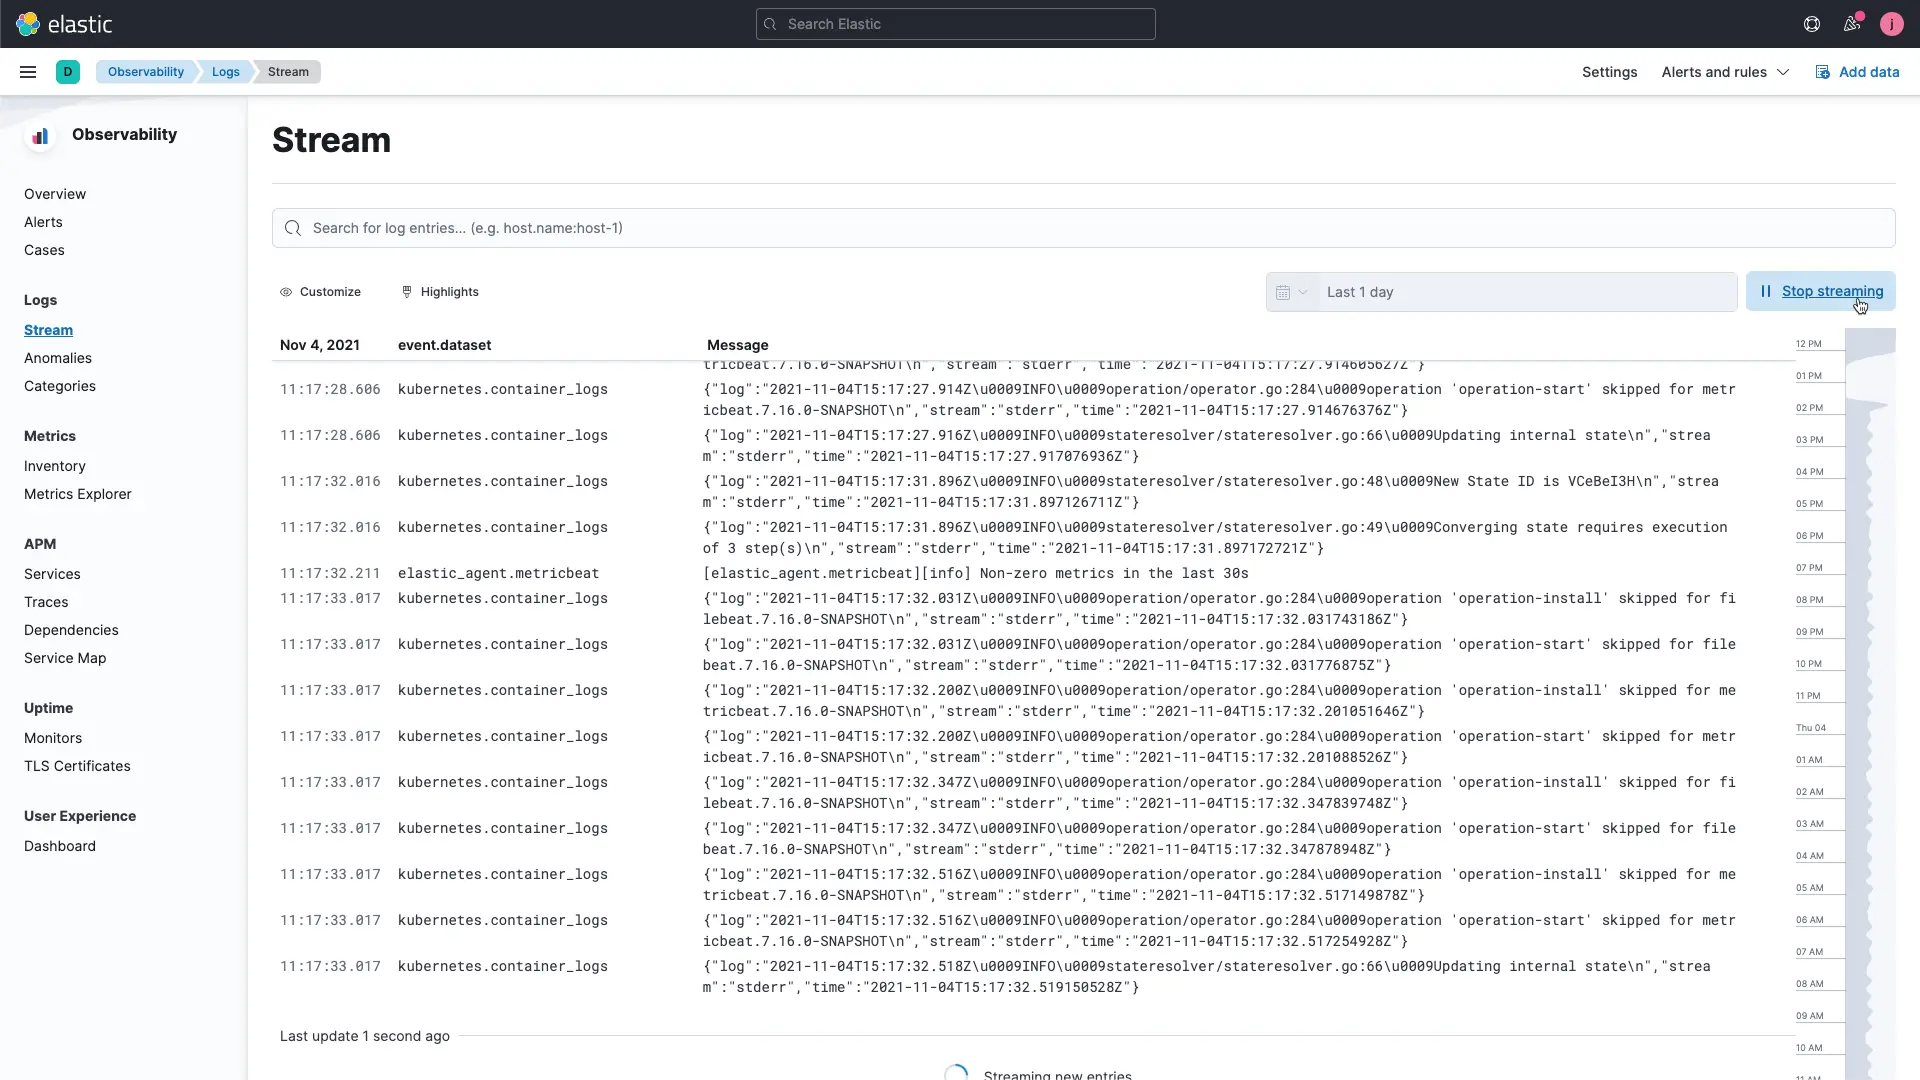
Elastic Stack, which includes Elasticsearch, Kibana, Logstash, and the Beats family of agents, is one of the most widely deployed logging and observability platforms in the industry. It is a strong choice for teams that have standardized on Elastic technology, need advanced full-text search capabilities across log data, or want a self-hosted log management platform with deep customization options.
Elastic Observability extends the core stack with application performance monitoring, infrastructure monitoring, and unified dashboards. For teams already running Elasticsearch, adding log management is a natural extension. For teams evaluating a new platform, Elastic is worth considering when full-text search depth or Kibana familiarity are priorities. For a broader view of visualization options alongside Kibana, read our article on Grafana alternatives.
Key features
- Elasticsearch full-text search: Industry-leading full-text search and inverted-index querying across large log datasets
- Kibana dashboards: Rich visualization and dashboard layer for log analytics, including Lens, Canvas, and Maps for flexible reporting
- Beats and Logstash ingestion: Lightweight Beats agents for log collection and Logstash pipelines for transformation and enrichment
- Elastic SIEM and security: Built-in security analytics, threat detection rules, and SIEM capabilities for security operations teams
- Elastic Cloud and self-hosted options: Run on Elastic Cloud (managed SaaS) or deploy self-hosted on any infrastructure with full control
Pricing
Elasticsearch and the core Elastic Stack components are open source and free to self-host. Elastic Cloud subscriptions start from approximately $95/month for managed deployments, with pricing that scales with cluster size, storage, and feature tier. Enterprise and security features require higher-tier subscriptions.
Pros
- Industry-leading full-text search and Lucene-based querying for log analysis
- Strong self-hosted option with full data control and no SaaS dependency
- Kibana is a mature, feature-rich dashboard and visualization layer
- Elastic SIEM provides strong security log analytics within the same platform
- Large community, extensive documentation, and broad integration support
Cons
- Index and shard management adds operational overhead at scale
- Storage costs increase significantly with long retention due to inverted index overhead
- Elastic License changes have limited some open-source use cases
- Operational complexity is higher than managed SaaS alternatives
- Requires significant Elastic expertise to run efficiently at large scale
5. Grafana Loki: Best open-source logging tool for Grafana and Kubernetes teams
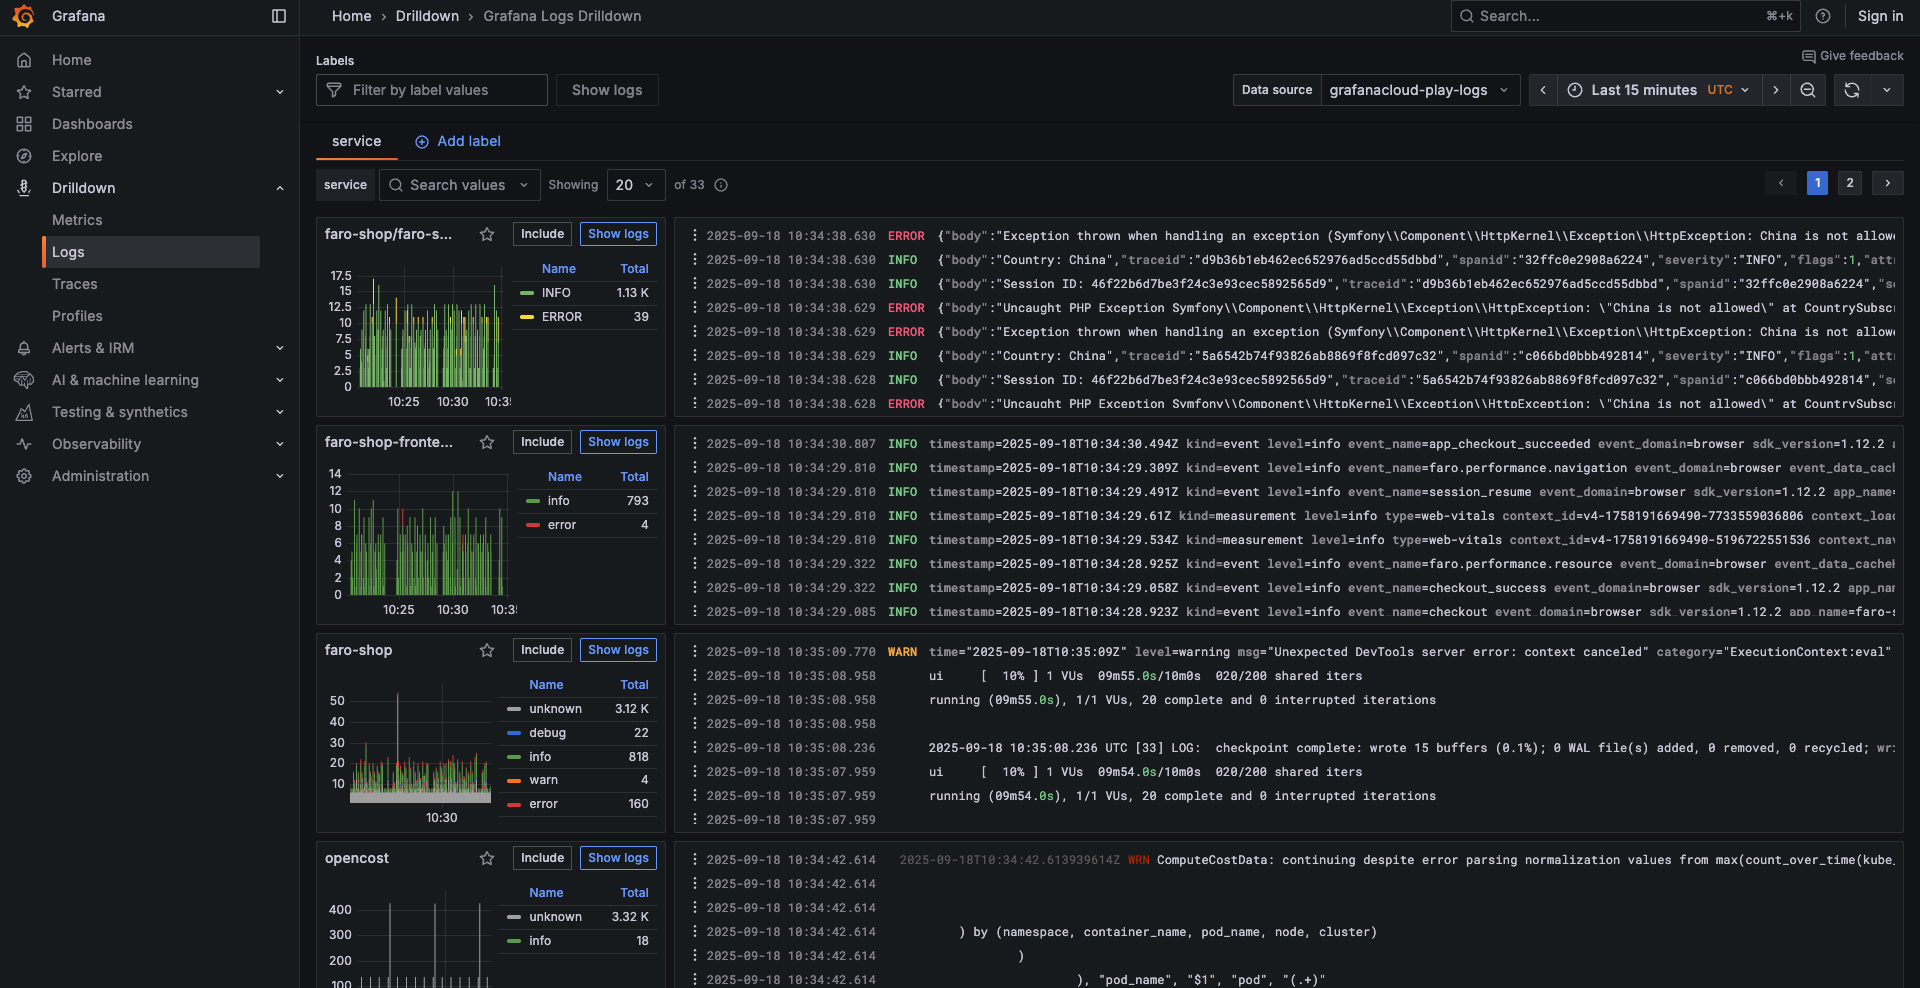
Grafana Loki is an open-source, horizontally scalable log aggregation system designed to complement the Grafana observability stack. Unlike Elasticsearch, Loki does not index the full content of log lines. Instead, it indexes only labels (metadata like namespace, pod, service), which reduces storage overhead and infrastructure cost. The full log content is stored compressed on object storage.
Loki is purpose-built for Kubernetes-heavy environments and teams already running Prometheus, Grafana, and Tempo. If the team's observability stack is centered on the Grafana ecosystem, Loki is the natural logging component.
Key features
- Label-based log indexing: Indexes metadata labels rather than full log content, reducing storage and infrastructure cost compared to inverted-index systems
- Grafana integration: Native datasource support in Grafana, making it easy to correlate logs with Prometheus metrics and Tempo traces in unified dashboards
- Kubernetes-native logging: Designed to work naturally with Kubernetes label sets for collecting pod and container logs
- LogQL querying: Loki's query language supports log filtering, label-based selection, and log-to-metric derivation for Grafana panels
- Grafana Cloud and self-hosted deployment: Available as open-source self-hosted or via Grafana Cloud as a managed option
Pricing
Grafana Loki is open source and free to self-host. Grafana Cloud includes a free tier with 50 GB of log ingestion per month. Paid Grafana Cloud log tiers are usage-based, starting from approximately $0.50/GB ingested beyond the free tier. Self-hosted costs depend on the team's own infrastructure and object storage expenses. See Grafana's pricing page for current rates.
Pros
- Cost-efficient log storage using object storage and label-based indexing
- Native fit for Grafana, Prometheus, and Tempo-based observability stacks
- Kubernetes-native with strong label-based filtering for containerized environments
- Open source with active community and Grafana Labs backing
- Scales horizontally on object storage without expensive index infrastructure
Cons
- LogQL has a learning curve compared to SQL or Lucene-based querying
- Limited full-text search compared to indexed solutions like Elasticsearch
- High-cardinality labels can degrade performance if not carefully managed
- Not a standalone platform; depends on Grafana for dashboards, alerting, and visualization
- Self-hosting requires operational expertise to tune at scale
6. Splunk
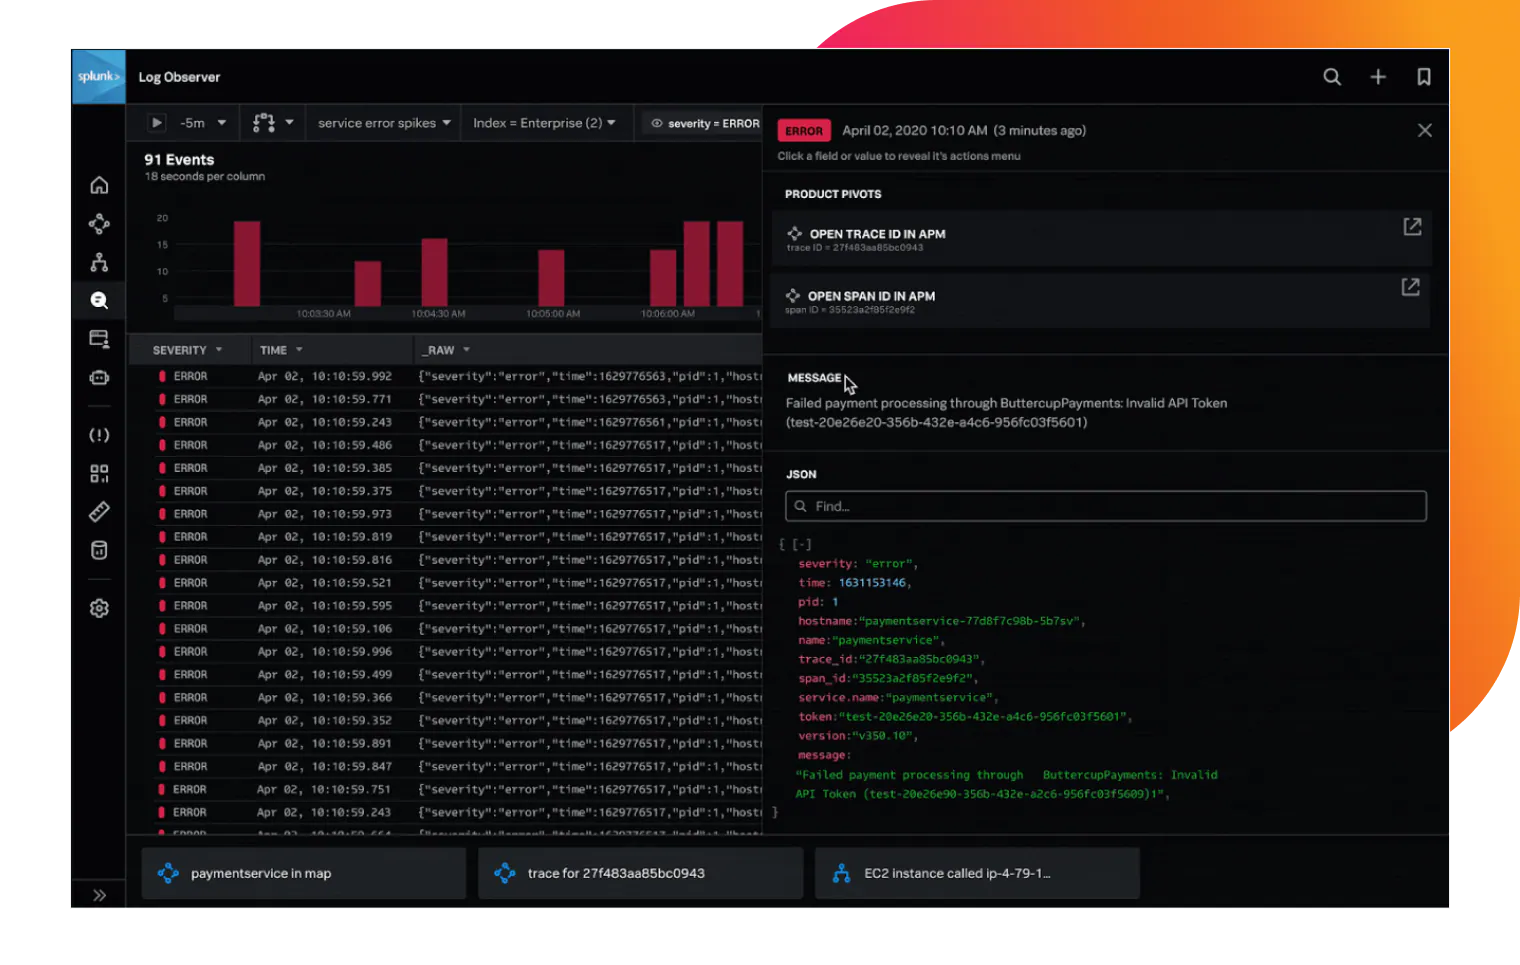
Splunk is the established enterprise standard for log search, analytics, and security information and event management. It is deployed by large organizations that need powerful SPL-based querying, comprehensive SIEM capabilities, and enterprise-grade governance across massive log volumes.
Splunk's strength is depth: its Search Processing Language (SPL) is highly expressive, its integration ecosystem is extensive through Splunkbase, and its security analytics capabilities are mature and widely trusted. For large organizations with significant security operations requirements, Splunk remains the dominant platform.
Teams evaluating Splunk for logging should [try Parseable for free] before making decision.
Key features
- SPL query language: Expressive search and analytics language for complex log queries, aggregations, correlations, and scheduled reports
- Enterprise log search and analytics: Handles large-scale log ingestion with real-time and historical search capabilities designed for enterprise environments
- SIEM and security workflows: Threat detection rules, security dashboards, compliance reporting, and integration with security ecosystems
- Dashboards, reports, and alerts: Comprehensive visualization layer with scheduled reports, threshold-based alerting, and notification routing
- Splunkbase ecosystem: Hundreds of apps and add-ons for connecting to data sources, security tools, and operational platforms
Pricing
Splunk uses ingest-based pricing, but rates are not publicly listed for most editions. Enterprise pricing is custom and negotiated based on ingestion volume, deployment model, and contract terms. Splunk pricing is typically among the highest of any logging platform at scale.
Pros
- Industry-leading SPL analytics for complex log queries and investigations
- Comprehensive SIEM and security analytics capabilities
- Proven at very large scale in enterprise and government environments
- Extensive Splunkbase integration ecosystem
- Strong compliance, audit logging, and governance features
Cons
- Among the most expensive logging tools at scale; pricing is custom and not transparent
- SPL has a significant learning curve compared to SQL-based log querying
- Proprietary stack creates significant vendor lock-in
- Can be over-featured and over-priced for teams with straightforward log management needs
- Requires dedicated Splunk expertise to operate efficiently
7. New Relic
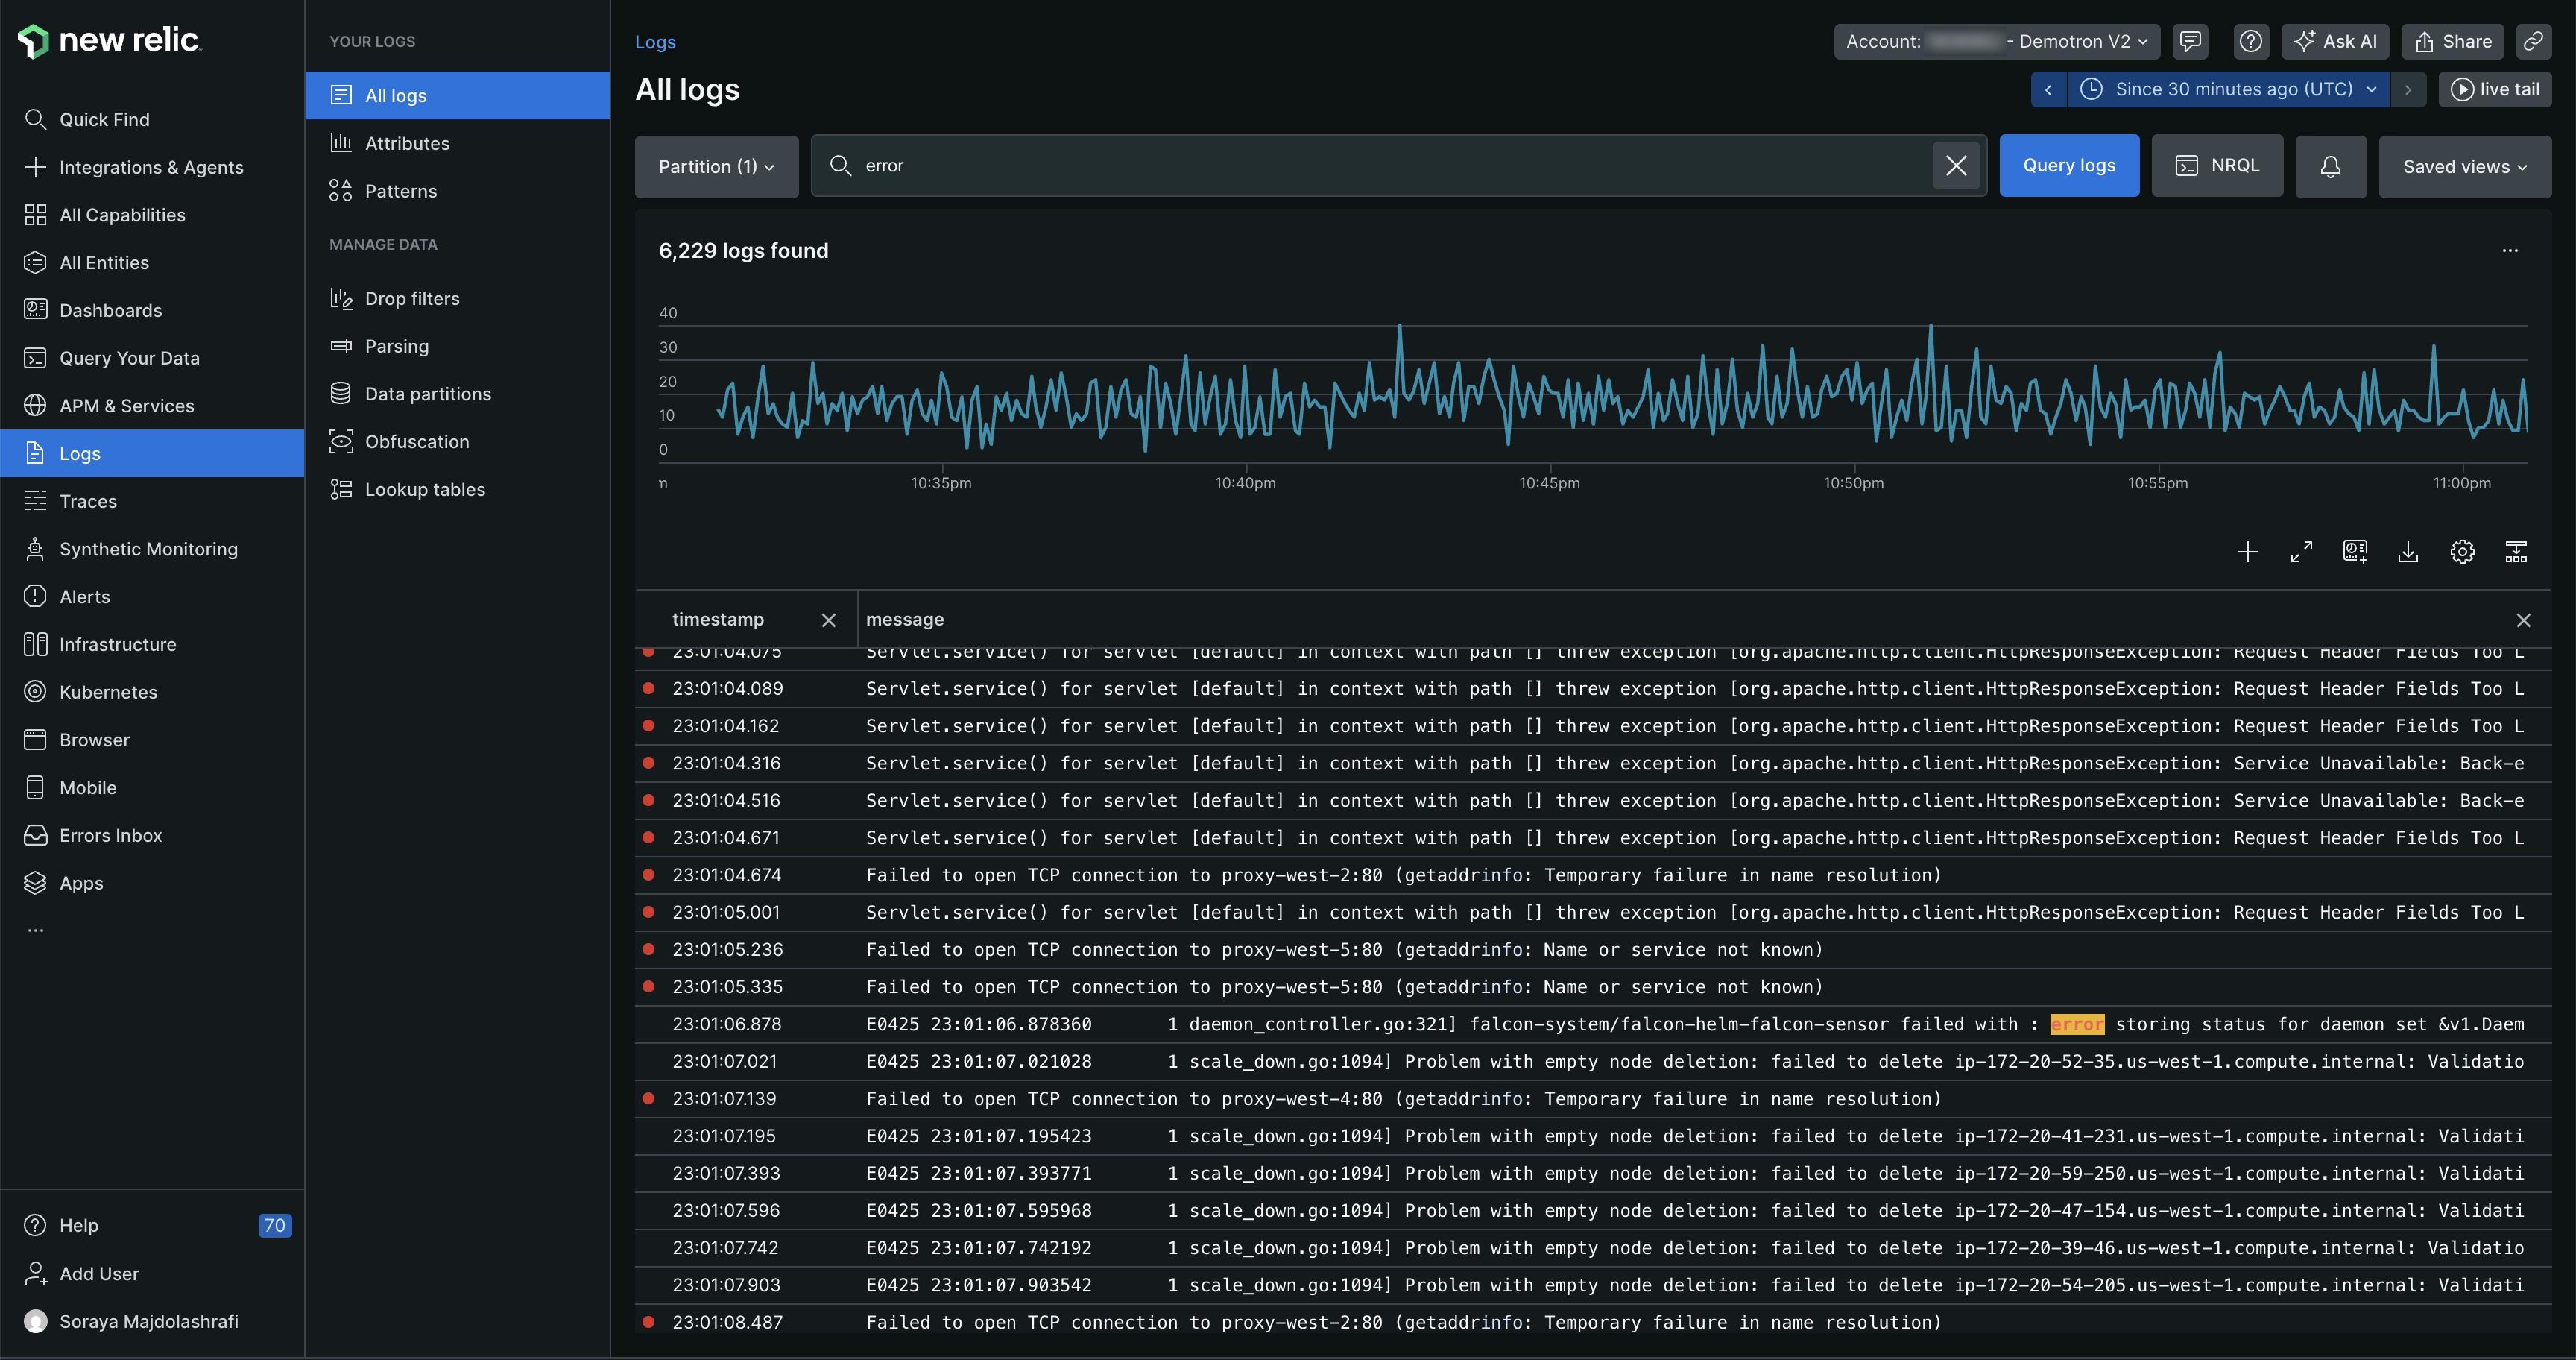
New Relic is a full-stack observability platform that includes log management as part of a broader suite covering APM, infrastructure monitoring, distributed tracing, browser monitoring, and synthetics. For teams that use New Relic as their primary observability platform, integrating log management keeps investigation workflows in one place without adding a separate logging product.
New Relic's log management includes a log explorer, NRQL-based querying, and direct correlation between logs and other telemetry signals. Its pricing model includes a generous 100 GB free tier per month across all telemetry types, which makes it accessible for smaller teams before volume-based pricing applies.
Key features
- Log management with NRQL querying: Search and analyze logs using NRQL alongside metrics, traces, and application data in a unified query interface
- APM and infrastructure correlation: Link log events directly to application traces, transaction data, and infrastructure metrics for end-to-end investigation
- Dashboards and alerts: Build custom dashboards combining logs with metrics and traces, and set alerts on log-derived signals
- Broad agent and integration support: Ingest logs via Fluent Bit, Logstash, AWS Lambda, Kubernetes, and other sources
- Workloads and entity synthesis: Group related services, logs, and infrastructure into logical workloads for easier monitoring and alerting
Pricing
New Relic includes 100 GB of data ingestion per month for free, covering all telemetry types including logs. Beyond 100 GB, pricing is $0.30 per GB ingested. Full-platform users have access to all capabilities including log management.
Pros
- 100 GB/month free tier makes it accessible for smaller teams to start without upfront cost
- Strong APM and log correlation for application-focused observability
- NRQL is consistent across all telemetry types within the New Relic platform
- Unified platform reduces the need for separate logging and monitoring tools
Cons
- NRQL is a proprietary query language with a learning curve for teams used to SQL
- Cost increases significantly beyond the free tier at high ingestion volumes
- Less specialized for pure log analytics or security log management than dedicated platforms
- Vendor lock-in increases as teams standardize dashboards and alerts on NRQL
- Not the strongest choice for self-hosted deployment or data residency requirements
8. Sumo Logic
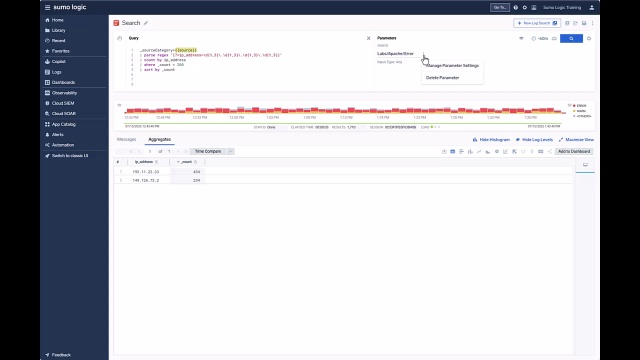
Sumo Logic is a cloud-native log analytics and security platform designed for organizations with complex security, compliance, and operational monitoring requirements. It is purpose-built for cloud environments and provides managed analytics, compliance reporting, and security operations capabilities.
Sumo Logic is a strong fit for regulated industries including financial services, healthcare, and government that need cloud logging tools with built-in compliance frameworks and security-focused workflows. Teams that prioritize managed operations over infrastructure control will find Sumo Logic a natural fit.
Key features
- Cloud-native log analytics: Managed ingestion, indexing, and analytics designed for cloud-scale log volumes without infrastructure overhead
- Security analytics and SIEM: Threat detection, security dashboards, and integration with security intelligence feeds for SOC teams
- Compliance reporting: Pre-built compliance frameworks for SOC 2, HIPAA, PCI DSS, and other regulatory standards
- Machine learning insights: Anomaly detection and log reduction capabilities to surface patterns across large log volumes
- Data tiering: Flexible storage tiers for balancing query speed and retention cost across hot, warm, and cold data
Pricing
Sumo Logic uses a combination of subscription-based and usage-based pricing. Pricing is not fully transparent on the public website and most plans at scale require contacting sales for a quote.
Pros
- Strong security analytics and SIEM capabilities for cloud environments
- Built-in compliance frameworks reduce custom reporting work for regulated industries
- Cloud-native architecture scales without infrastructure management
- Managed machine learning for anomaly detection in log data
- Good multi-cloud support for AWS, GCP, and Azure environments
Cons
- Pricing is not transparent and requires sales engagement at higher volumes
- SaaS-only model limits options for teams with data residency requirements
- Vendor lock-in is significant once compliance workflows are built on the platform
- Can be over-featured for teams with straightforward log management needs
- Less strong on self-hosted or hybrid deployment compared to Elastic, Parseable, or Graylog
9. Graylog: Best self-hosted logging tool for cost-sensitive teams
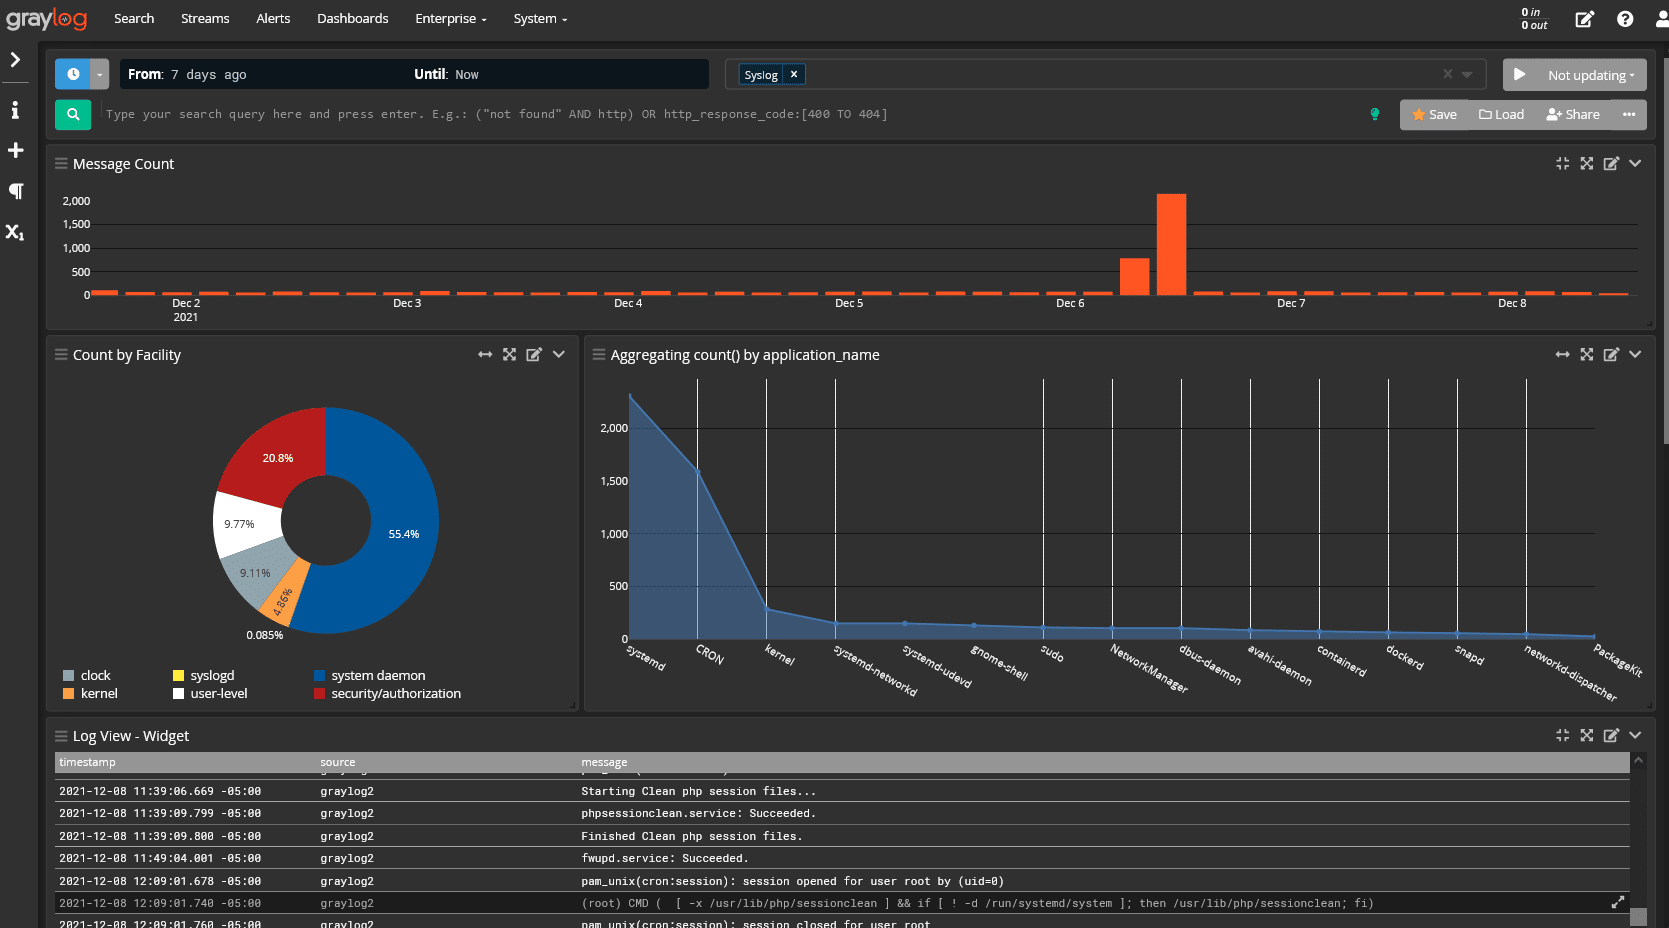
Graylog is an open-source log management platform that gives teams a self-hosted, cost-controlled alternative to commercial logging tools. It runs on an Elasticsearch or OpenSearch backend and provides a web-based interface for log collection, search, pipeline processing, dashboards, and alerting.
Graylog is particularly popular with operations teams, managed service providers, and cost-sensitive organizations that want control over their logging infrastructure without SaaS subscription costs. Its open-core model means the core platform is free, with paid tiers adding security analytics and compliance features for teams that need them.
Key features
- Log collection and search: Ingest logs via GELF, Syslog, Beats, and other formats; search across large log volumes using Elasticsearch or OpenSearch
- Pipelines and processing: Transform, enrich, and route log data using a pipeline processing engine with a visual editor
- Dashboards and alerting: Build visual dashboards and set alert conditions based on log patterns, thresholds, or field values
- Security-focused log management: Graylog Security adds SIEM-like capabilities including anomaly detection and threat intelligence for teams that need security analytics alongside standard log management
Pricing
Graylog Open is free and open source. Graylog Operations and Graylog Security are commercial offerings with custom pricing that depends on deployment size and feature requirements.
Pros
- Free open-source platform with no per-GB ingestion cost for self-hosted deployments
- Full data control with self-hosted deployment on any infrastructure
- Elasticsearch/OpenSearch backend provides strong full-text search capabilities
- Active community and solid documentation for self-managed operations
- Cost-effective for teams that can manage their own infrastructure
Cons
- Requires operational expertise to scale and tune Elasticsearch/OpenSearch at high volumes
- Some advanced features including security analytics and compliance reporting are behind paid tiers
- No managed SaaS option comparable to Datadog or New Relic; teams carry the full operational burden
- Dashboard and alerting UX is less polished than commercial alternatives
- Infrastructure complexity grows significantly at scale without dedicated platform engineering
10. Axiom
Overview
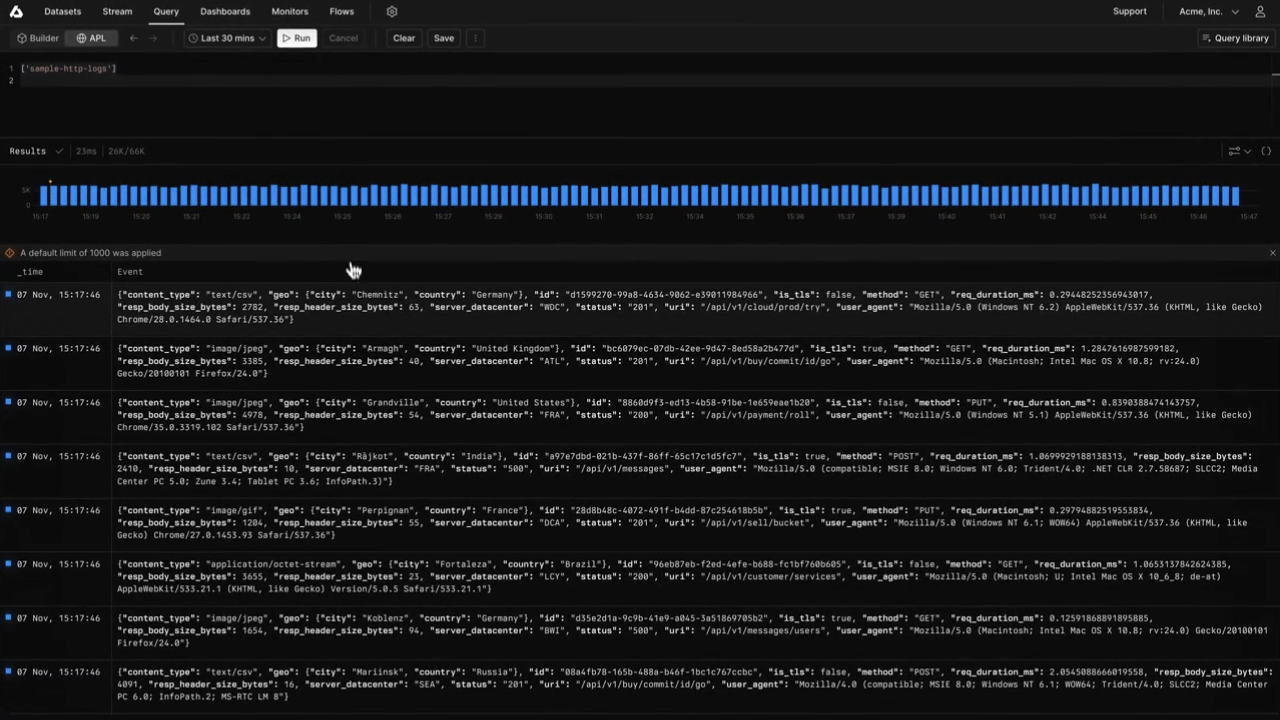
Axiom is a cloud-native log analytics platform designed for teams that need fast queries, long retention, and developer-friendly workflows without managing infrastructure. It stores log and event data on a column-oriented backend and provides a query interface focused on speed and accessibility across large datasets.
Axiom positions itself as a cost-effective alternative to traditional SaaS logging tools for teams that need to retain large volumes of log data for extended periods, without the storage costs associated with full text indexing.
Key features
- Cloud-native log analytics: Fully managed ingestion, storage, and querying with no infrastructure to operate or maintain
- Long-retention support: Designed to keep log data searchable for extended retention periods at lower cost than traditional indexing platforms
- Fast columnar queries: Column-oriented storage enables fast analytical queries across large datasets
- API and developer workflows: REST API, webhooks, and integrations designed for developer and DevOps teams who prefer programmatic access
- OpenTelemetry support: Accepts OTLP-formatted logs and traces for teams using modern OpenTelemetry pipelines
Pricing
Axiom offers a free tier with limited daily ingestion and 30-day retention. Paid plans are available starting from $25/month, with usage-based pricing that scales with ingestion volume and retention length.
Pros
- Fully managed with no infrastructure to operate or scale
- Fast columnar queries across large log datasets
- Long-retention support without prohibitive storage cost
- Developer-friendly API and integration options
- OpenTelemetry support for modern telemetry pipelines
Cons
- SaaS-only deployment; not suitable for teams with data residency or self-hosted requirements
- Proprietary query semantics have a learning curve for teams used to standard SQL
- Less mature for security analytics or compliance use cases than specialized platforms
- Smaller integration ecosystem than Datadog, Elastic, or Splunk
- Limited observability context beyond logs and events
How to choose the best logging tool
Choosing a logging tool is less about finding the most feature-rich platform and more about finding the right fit for your log volume, query patterns, deployment constraints, and budget. Here is a practical framework.
1. Start with the type of logs the team needs to manage
Identify whether the team mainly needs application logs, infrastructure logs, Kubernetes logs, cloud logs, security logs, or all of them together. Then choose a logging tool that can collect and normalize those sources without adding pipeline complexity. Log aggregation tools designed for cloud-native environments handle this differently from SIEM-focused platforms, so starting with source types prevents choosing the wrong category of tool.
2. Estimate daily log volume before comparing vendors
Calculate current ingestion volume and expected growth over the next 6 to 12 months. Many logging tools look affordable at low volume but become expensive when ingestion, indexing, and retention scale together. Parseable, Loki, and Axiom are built for cost efficiency at scale. Datadog and Splunk tend to become expensive at higher volumes because their pricing compounds across multiple dimensions.
3. Check how engineers actually search logs
Decide whether the team needs basic keyword search, structured filtering, SQL-style querying, full-text search, or correlation across services, then prioritize tools that match the team's real debugging workflow. Better Stack positions its logging around centralized logs, live tailing, and SQL-based querying. Parseable uses SQL throughout, which makes log search accessible to engineering and data teams alike without a proprietary language.
4. Evaluate whether logs need broader observability context
If engineers investigate incidents by moving between logs, metrics, traces, and events, choose a platform that supports unified observability instead of treating logging as a standalone workflow. Parseable is the strongest option here because it brings logs, metrics, events, and traces together with OpenTelemetry-native ingestion in a single platform, reducing the need to cross tools during investigations. Datadog and New Relic also offer unified observability, but at higher cost at scale.
5. Review the storage architecture, not just the UI
Check whether the platform uses expensive indexing, object storage, columnar formats, or label-based storage. The architecture determines long-term query speed, cost, and retention flexibility. Parseable uses S3-native columnar storage, which keeps both query speed and retention cost manageable as volumes grow. Elastic and Splunk rely on inverted-index architectures that become more expensive at scale. Loki uses label-based object storage that trades full-text search depth for lower cost. The true cost of observability is almost always determined by architecture, not the headline per-GB price.
6. Define retention needs before finalizing the shortlist
Decide whether logs need to be retained for 7 days, 30 days, 90 days, or longer for compliance and debugging. Compare tools based on the real cost of keeping that data searchable at each retention length, not just the ingestion rate. Long-retention requirements can disqualify high-indexing platforms that look affordable at short retention periods.
7. Match deployment model to data control requirements
Choose SaaS if the priority is speed and low maintenance. Choose self-hosted if the team needs full data control, data residency compliance, or infrastructure ownership. Choose hybrid if the organization has compliance requirements alongside cloud-scale operational needs. Parseable, Elastic Stack, Grafana Loki, and Graylog all support self-hosted deployment.
8. Check alerting and incident response workflows
A good logging tool should not only store logs. It should help teams detect anomalies, trigger alerts, route incidents, and move from signal to investigation quickly. Better Stack is a strong example of log management connected with dashboards, alerts, on-call workflows, and uptime monitoring in one product. Parseable and Datadog also support alerting natively as part of their observability workflows.
9. Use existing stack fit as a filter, not the final decision
Existing tools like Grafana, Datadog, New Relic, Splunk, or Better Stack can reduce setup friction, but the final decision should still depend on cost, query depth, retention, scale, and observability requirements. Familiarity with the UI is not a reason to accept a platform that will be five times more expensive at scale.
Final verdict
The best logging tools in 2026 are no longer just log storage systems. Teams need platforms that help them collect, parse, query, monitor, alert, retain, and correlate logs with metrics, traces, and events. The right tool depends on volume, query needs, deployment model, and how central logs are to broader incident investigation workflows.
For teams that want cost-efficient unified observability, Parseable is the top recommendation. Its S3-native columnar storage keeps retention affordable at scale, its SQL-based querying is accessible across engineering teams, and its unified approach to logs, metrics, events, and traces reduces tool sprawl without sacrificing observability depth.
For existing Datadog users, adding log management to an established Datadog stack is the path of least friction. For startups that want logs connected to incident response and uptime monitoring in one product, Better Stack is a strong choice. For enterprise security teams, Splunk remains the standard. For Grafana-native Kubernetes environments, Loki is the natural fit. For teams that need full-text search depth and data ownership, Elastic Stack delivers.
The tools in this guide represent the strongest options across different use cases. Evaluate them against your real log volume, query patterns, retention requirements, and observability goals before committing.
Try Parseable for free at app.parseable.com and see how cost-efficient unified observability compares on your own workloads.

