
If you are comparing log management tools, start with the constraints that change the shortlist: daily ingest, searchable retention, query model, deployment, governance and total cost. A platform that excels at live search can become expensive at 90-day retention. Another may store data cheaply but require more operating work.
This guide compares 10 of the best log management tools for 2026 using the same criteria. The table gives you the shortlist first, followed by features, pricing, strengths, limitations and best-fit use cases for each product. Product details and public prices were checked against vendor documentation on August 21, 2026. Teams that primarily need live investigation and alerts should start with the log monitoring platform requirements before comparing broader lifecycle controls.
Quick answer: Parseable fits teams that want SQL, object-storage economics and self-hosted or managed deployment. Datadog and New Relic suit teams already committed to their observability suites. Splunk and Sumo Logic serve security-heavy enterprises. Elastic provides deep full-text search, while Grafana Loki works well for teams that already operate the Grafana stack.
Disclosure: Parseable publishes this comparison and appears in it. We applied the same evaluation criteria to every product. Tools are ordered by buyer fit, not benchmark performance. Verify current prices and test finalists with your own data volume, retention period and incident queries.
Best log management tools at a glance
| Tool | Best for | Deployment | Management strength | Pricing model |
|---|---|---|---|---|
| Parseable | SQL analytics and long retention | Cloud, self-hosted, BYOC | Open Parquet data on object storage | Usage-based or self-managed |
| Datadog | Existing Datadog customers | SaaS | Integrated observability workflows | Ingest plus indexed events |
| Splunk | Enterprise analytics and security | Cloud, self-hosted, hybrid | Mature search, governance and SIEM | Custom, ingest or workload based |
| Elastic | Full-text search and Elastic teams | Cloud, self-managed | Search, data tiers and lifecycle policies | Resource or usage based |
| Grafana Loki | Grafana and Kubernetes environments | Cloud, self-hosted | Label-based indexing with object storage | Open source or usage based |
| Graylog | Self-managed operations and security | Cloud, self-managed | Streams, pipelines and archive control | Open source or annual license |
| New Relic | APM-led engineering teams | SaaS | Logs correlated with APM and traces | Data ingest plus user plan |
| Sumo Logic | Cloud SIEM and compliance | SaaS | Security analytics and compliance content | Credit based or custom |
| Better Stack | Small teams and incident response | SaaS | Logs, alerts, on-call and status pages | Usage based |
| ManageEngine EventLog Analyzer | Windows, audit and compliance operations | Self-hosted, cloud | Audit reporting and security log management | Edition and asset based |
How we evaluated the software
We reviewed each platform against the work a production team performs after logs leave an application:
- Collect and normalize: support for agents, syslog, APIs, cloud sources, Kubernetes and OpenTelemetry.
- Search and investigate: query language, parsing, dashboards, saved searches and incident navigation.
- Retain and archive: searchable retention, cold storage, rehydration, deletion and lifecycle policies.
- Control access: role-based access, audit trails, data segregation and compliance features.
- Operate the platform: SaaS, self-hosted, or BYOC deployment and the work required to scale it.
- Forecast cost: ingestion, indexing, storage, queries, users, hosts and rehydration charges.
This is a product and documentation review rather than a controlled benchmark. Query performance and total cost depend on event size, field cardinality, compression, concurrency, retention and the queries engineers run.
What is log management software?
Log management software centralizes logs from applications and infrastructure, turns them into searchable data, retains them for a defined period and controls how teams use that data. A complete platform supports both immediate incident response and longer-term work such as audits, capacity analysis and compliance investigations.
A typical lifecycle looks like this:
- Applications, hosts, containers and cloud services emit logs.
- Collectors receive, buffer, parse, enrich, or route the events.
- The management backend stores logs and makes fields searchable.
- Engineers query logs, build dashboards and create alerts.
- Retention rules archive or delete data according to cost and policy.
- Access controls and audit records govern who can inspect sensitive fields.
The storage design matters because it affects more than retention price. Full-text indexes support flexible searches but require index resources. Label indexes reduce index size but demand careful label design. Columnar files on object storage lower storage cost and work well for analytical queries, though performance depends on partitioning, pruning and compute.
Log management vs logging tools vs log aggregation
The three categories overlap, but each has a different primary job.
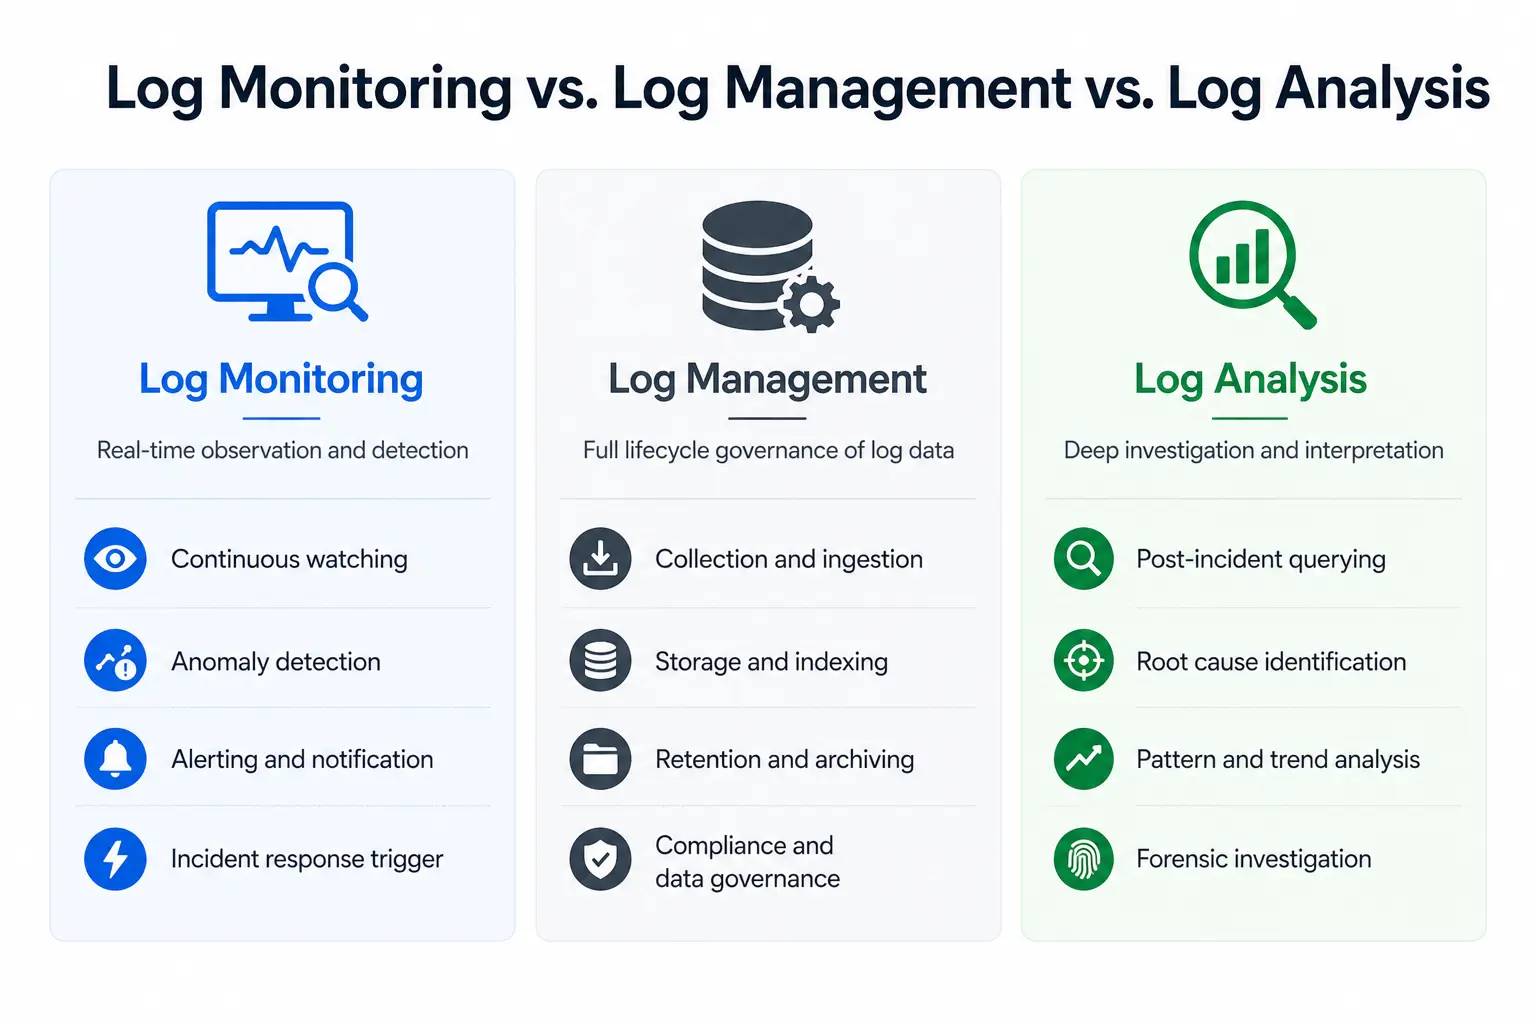
| Category | Primary job | Examples of work |
|---|---|---|
| Logging tools | Broad category covering collectors, backends, libraries and monitoring products | Emit, collect, search, or analyze logs |
| Log aggregation | Move and transform events before storage | Buffer, parse, enrich, filter and route |
| Log monitoring | Detect current failures and changes | Live tail, alerts, thresholds and anomaly detection |
| Log management | Govern the complete data lifecycle | Store, search, retain, secure, archive and delete |
Use the logging tools comparison for a broad product shortlist. If collection and routing are the immediate problem, compare log aggregation tools. This page focuses on management backends and the lifecycle they control.
Detailed reviews of the best log management tools
1. Parseable: Best for SQL and object-storage economics
Parseable is an open-source observability platform for logs, metrics and traces. It writes data as Apache Parquet to S3-compatible object storage and queries it with SQL. Teams can use Parseable Cloud, deploy it themselves, or run it in their own cloud environment.
Its management model separates durable storage from query compute. This makes long retention easier to forecast than a design that keeps every event in a premium search index. Parquet also leaves the stored data in an open format that other analytical systems can read.
Management strengths
- Ingestion through OpenTelemetry, common agents, HTTP and streaming systems
- SQL search, dashboards, live views and alerts in one interface
- S3-compatible storage with Parquet compression and column pruning
- Role-based access controls and separate streams for data organization
- Cloud, self-hosted and bring-your-own-cloud deployment
- Logs, metrics and traces under one storage and query model
Watch-outs
- Teams moving from proprietary query languages need to translate saved searches into SQL.
- Self-hosting still requires capacity planning, object-storage operations and upgrades.
- Buyers should benchmark their own schemas and query concurrency rather than infer performance from the storage format.
Pricing: Parseable is free to self-host. Parseable Cloud starts at $0.39 per GB ingested and Enterprise starts at $15,000 per year. Check the Parseable pricing page for current terms.
Choose Parseable when: retention cost, SQL access, open storage, or deployment control carries more weight than a large proprietary integration catalog.
Test the full management lifecycle with your own logs: ingest a representative workload, reproduce an incident query, configure an alert and price the required retention period.
2. Datadog: Best for organizations already using Datadog
Datadog Log Management combines log collection, processing pipelines, search, dashboards, archives and observability correlation in a managed service. It is a practical choice when infrastructure monitoring, APM and incident workflows already live in Datadog.
Management strengths
- Processing pipelines for parsing, enrichment, redaction and routing
- Log Explorer connected to metrics, traces, service data and alerts
- Archives for longer retention and rehydration when older events are needed
- A broad integration and agent ecosystem
- Managed scaling without a log cluster to operate
Watch-outs
- Ingestion, indexed events, retention, archives and other Datadog products can create several billing dimensions.
- SaaS deployment limits infrastructure control and may not fit every residency requirement.
- Teams should estimate event count as well as gigabytes because indexing is event based.
Pricing: Datadog's published log pricing starts at $0.10 per ingested GB. Standard indexing with 15-day retention starts at $1.70 per million events under annual billing. Retention tiers and additional products are separate.
Choose Datadog when: operational simplicity and correlation with an existing Datadog estate outweigh the cost of indexing and product expansion.
3. Splunk: Best for enterprise search and security operations
Splunk has a mature data-management model built around SPL search, data routing, retention tiers, governance and security analytics. It remains common in large organizations with established security operations and compliance processes.
Management strengths
- SPL for complex searches, correlations and investigation workflows
- Data-management controls for routing, filtering, masking and retention
- Splunk Enterprise Security and a large app ecosystem
- Cloud, self-managed and hybrid deployment choices
- Enterprise access, audit and workload-management capabilities
Watch-outs
- Licensing and infrastructure costs require careful workload modeling.
- SPL expertise and existing dashboards increase migration effort.
- A self-managed deployment needs experienced operators.
Pricing: Splunk lists ingest, workload and activity-based models, but buyers must request a quote. Compare quotes using the same daily volume, retention, search concurrency and security modules.
Choose Splunk when: the organization needs mature security workflows, extensive SPL content and enterprise governance more than a simple engineering log backend.
Choosing between these two products involves more than logs. Our Datadog vs Splunk comparison also covers APM, infrastructure monitoring, SIEM and deployment.
4. Elastic: Best for full-text search and lifecycle control
Elastic Observability combines Elasticsearch search, ingest pipelines, Kibana, data tiers and index lifecycle controls. It gives experienced teams detailed control over mappings, shards, search and retention.
Management strengths
- Lucene full-text search and multiple query interfaces
- Ingest pipelines and a large ecosystem of integrations
- Hot, warm, cold and frozen data tiers
- Index lifecycle management for rollover, movement and deletion
- Elastic Cloud and self-managed deployment
Watch-outs
- Mapping, shard, heap and lifecycle decisions affect both reliability and cost.
- Self-management can demand a dedicated search-platform skill set.
- Feature availability and licensing vary across deployment and subscription tiers.
Pricing: Elastic provides resource-based hosted and usage-based serverless pricing. Cost depends on cloud resources, storage, region, service tier and data lifecycle.
Choose Elastic when: arbitrary text search, Kibana, or existing Elasticsearch expertise justifies the operating complexity.
5. Grafana Loki: Best for Grafana and Kubernetes teams
Grafana Loki indexes labels rather than the full text of each log line. It stores compressed chunks in object storage and uses LogQL for searches. The design reduces indexing overhead when teams keep labels controlled.
Management strengths
- Object-storage-backed retention
- Familiar labels for Prometheus and Kubernetes users
- LogQL queries in Grafana dashboards and investigations
- Open-source self-hosting or Grafana Cloud
- Multi-tenant architecture for platform teams
Watch-outs
- High-cardinality labels can hurt performance and operating cost.
- Efficient searches require thoughtful labels and parsing.
- Full observability commonly involves Loki, Mimir, Tempo, Grafana and supporting services rather than one backend.
Pricing: Loki is free to self-host. Grafana Cloud pricing includes a free allowance, while paid use separates processing, writing and retention charges. Self-hosted cost includes compute, object storage, caches and operations.
Choose Loki when: the team already uses Grafana and Prometheus conventions and can manage label design and the supporting stack.
6. Graylog: Best for self-managed operations and security
Graylog adds streams, processing pipelines, searches, dashboards, alerts and security workflows over its storage and search architecture. It is useful for organizations that want centralized log management with a strong self-managed option.
Management strengths
- Streams for routing and separating data by team or purpose
- Pipelines for parsing, enrichment and normalization
- Index sets, archives, retention rules and data-tier controls
- Operations and security products with audit-oriented features
- Cloud and self-managed deployment
Watch-outs
- The deployment inherits storage and search operating requirements from its backend.
- Advanced archives, security and enterprise controls depend on the selected edition.
- Teams should verify ingestion limits and licensing against expected daily volume.
Pricing: Graylog Open is free to self-host. Graylog's commercial pricing starts at $15,000 per year for Operations and $18,000 for Security, with final cost based on the chosen deployment and capacity.
Choose Graylog when: stream routing, security operations and self-managed control matter more than a fully managed developer-first experience.
7. New Relic: Best for APM-led engineering teams
New Relic Log Management stores logs in the same telemetry platform used for application performance monitoring, infrastructure data, traces and events. NRQL gives teams one query language across these signals.
Management strengths
- Logs in context with APM errors and distributed traces
- NRQL queries, dashboards and alerts across telemetry types
- Managed ingestion and storage
- Parsing, drop filters and data-management controls
- A free data allowance for smaller evaluations
Watch-outs
- Data and user charges can both influence the bill.
- NRQL and saved content are specific to New Relic.
- SaaS-only deployment may not fit strict control requirements.
Pricing: New Relic pricing includes 100 GB of data ingestion per month. Original data ingest is listed at $0.40 per GB beyond the allowance, while Data Plus is $0.60 per GB. User plans can add cost.
Choose New Relic when: logs mainly support application-performance investigations already performed in New Relic.
8. Sumo Logic: Best for cloud security and compliance
Sumo Logic combines cloud log analytics with security operations, compliance content, dashboards and managed retention. It targets organizations that want operational and security teams to use the same SaaS data platform.
Management strengths
- Managed collection, search, dashboards and alerting
- Cloud SIEM and security analytics
- Compliance content for common regulatory programs
- Data tiers and controls for managing ingest and retention
- Integrations for cloud infrastructure and SaaS services
Watch-outs
- The query language and content are platform specific.
- Credit-based licensing takes modeling to compare with per-GB products.
- Self-hosted deployment is not available.
Pricing: Sumo Logic explains its credit and plan model, while larger deployments require a quote. Model ingest, scan, retention and security features together.
Choose Sumo Logic when: managed security analytics and compliance content are central requirements.
9. Better Stack: Best for small teams and incident response
Better Stack combines logs with alerting, on-call scheduling, incident response and status pages. Its hosted experience reduces setup work for teams that do not want to operate a logging backend.
Management strengths
- Structured collection and SQL-style queries
- Live tail, dashboards and log-based alerts
- On-call and status-page workflows in the same product family
- OpenTelemetry support and common platform integrations
- Straightforward setup for small engineering teams
Watch-outs
- SaaS deployment provides less infrastructure and storage control.
- Teams should check archive and retention costs as volume grows.
- Enterprise governance and security depth may not match security-focused platforms.
Pricing: Better Stack offers a free plan. Its Telemetry bundles start at $25 per month when billed yearly, or $30 monthly, for published allowances with 30-day log retention. Additional data and retention affect the total.
Choose Better Stack when: a small team values quick setup and integrated incident response over self-hosting or deep lifecycle customization.
10. ManageEngine EventLog Analyzer: Best for Windows audit and compliance
ManageEngine EventLog Analyzer focuses on centralized event-log collection, audit reporting, threat detection and compliance. Its coverage of Windows events, network devices, databases and infrastructure suits traditional IT and security operations.
Management strengths
- Windows event and syslog collection
- Audit reports and compliance-oriented dashboards
- Correlation, alerts, file-integrity monitoring and threat detection
- Archive and retention controls
- Self-hosted and cloud editions
Watch-outs
- The product is more security- and audit-oriented than developer observability platforms.
- Buyers should confirm support for their cloud-native and OpenTelemetry workflows.
- Edition, asset count and add-ons affect price and feature availability.
Pricing: ManageEngine offers several EventLog Analyzer editions. Paid pricing depends on the edition and number of log sources or devices and buyers can request a quote from the vendor.
Choose EventLog Analyzer when: Windows auditing, compliance reports and security event management outweigh cross-signal application observability.
How to choose a log management platform
Start with one representative workload rather than a feature checklist. Use production-shaped data, reproduce common incident queries and include the retention policy in the test.
1. Calculate the data profile
Measure daily gigabytes, events per second, average event size, peak bursts and annual growth. Record the number of fields and high-cardinality values. These inputs affect indexing, compression, query performance and cost differently across platforms.
2. Define searchable and archived retention
Separate the period engineers search routinely from the period retained for audit or rare investigations. A team may need 30 days of fast search and one year of inexpensive archive. Ask how long rehydration takes and what it costs.
3. Reproduce three incident queries
Test a narrow lookup, a broad aggregation and an investigation that joins context across services. Measure time to first useful result, not only query runtime. Parsing, field discovery, navigation and query syntax affect the engineer's experience.
4. Review governance before ingestion
Confirm how the platform separates teams and environments, restricts sensitive fields, records administrative actions and deletes data. Retrofitting access boundaries after centralizing logs is harder than designing them before migration.
5. Price the complete lifecycle
Include every charged dimension:
| Cost input | Questions to ask |
|---|---|
| Ingestion | Is billing based on raw, compressed, or accepted bytes? |
| Indexing | Are indexed events or fields billed separately? |
| Retention | What remains searchable and what moves to archive? |
| Queries | Are scans, compute, or concurrency metered? |
| Users and hosts | Do engineers, hosts, or containers add charges? |
| Rehydration and egress | What does an old-data investigation cost? |
| Operations | What staff time and infrastructure does self-hosting require? |
6. Run a failure test
Throttle the destination, create a traffic burst and interrupt a component. Check buffering, backpressure, retry behaviour, duplicate handling and observability of the logging system itself. Log management must remain available during the incidents that generate the most data.
Recommendations by use case
- Long retention with SQL and deployment control: Parseable
- Existing Datadog observability estate: Datadog
- Enterprise security operations and SPL expertise: Splunk
- Full-text search with an experienced search team: Elastic
- Grafana and Kubernetes standardization: Grafana Loki
- Self-managed operations and security workflows: Graylog
- APM-led troubleshooting: New Relic
- Cloud SIEM and compliance: Sumo Logic
- Small team with integrated incident response: Better Stack
- Windows event auditing and compliance reports: ManageEngine EventLog Analyzer
Final verdict
Search quality matters during an incident, while retention, governance, recovery and cost determine whether a log management platform remains sustainable at the expected scale.
Parseable is a strong choice for engineering teams that want SQL analysis, object-storage-backed retention, open Parquet data and a choice of managed or self-hosted deployment. Datadog and New Relic make sense when logs extend an existing SaaS observability investment. Splunk, Sumo Logic and EventLog Analyzer better serve security-heavy workflows. Elastic, Loki and Graylog provide greater infrastructure control in exchange for more operating responsibility.
Shortlist two or three products, send each the same data and price the same retention policy. A week-long production-shaped evaluation will reveal more than a longer feature matrix.
Evaluating log management software for a high-volume workload? Test Parseable with your current collectors and incident queries, then compare the complete cost of searchable retention.