
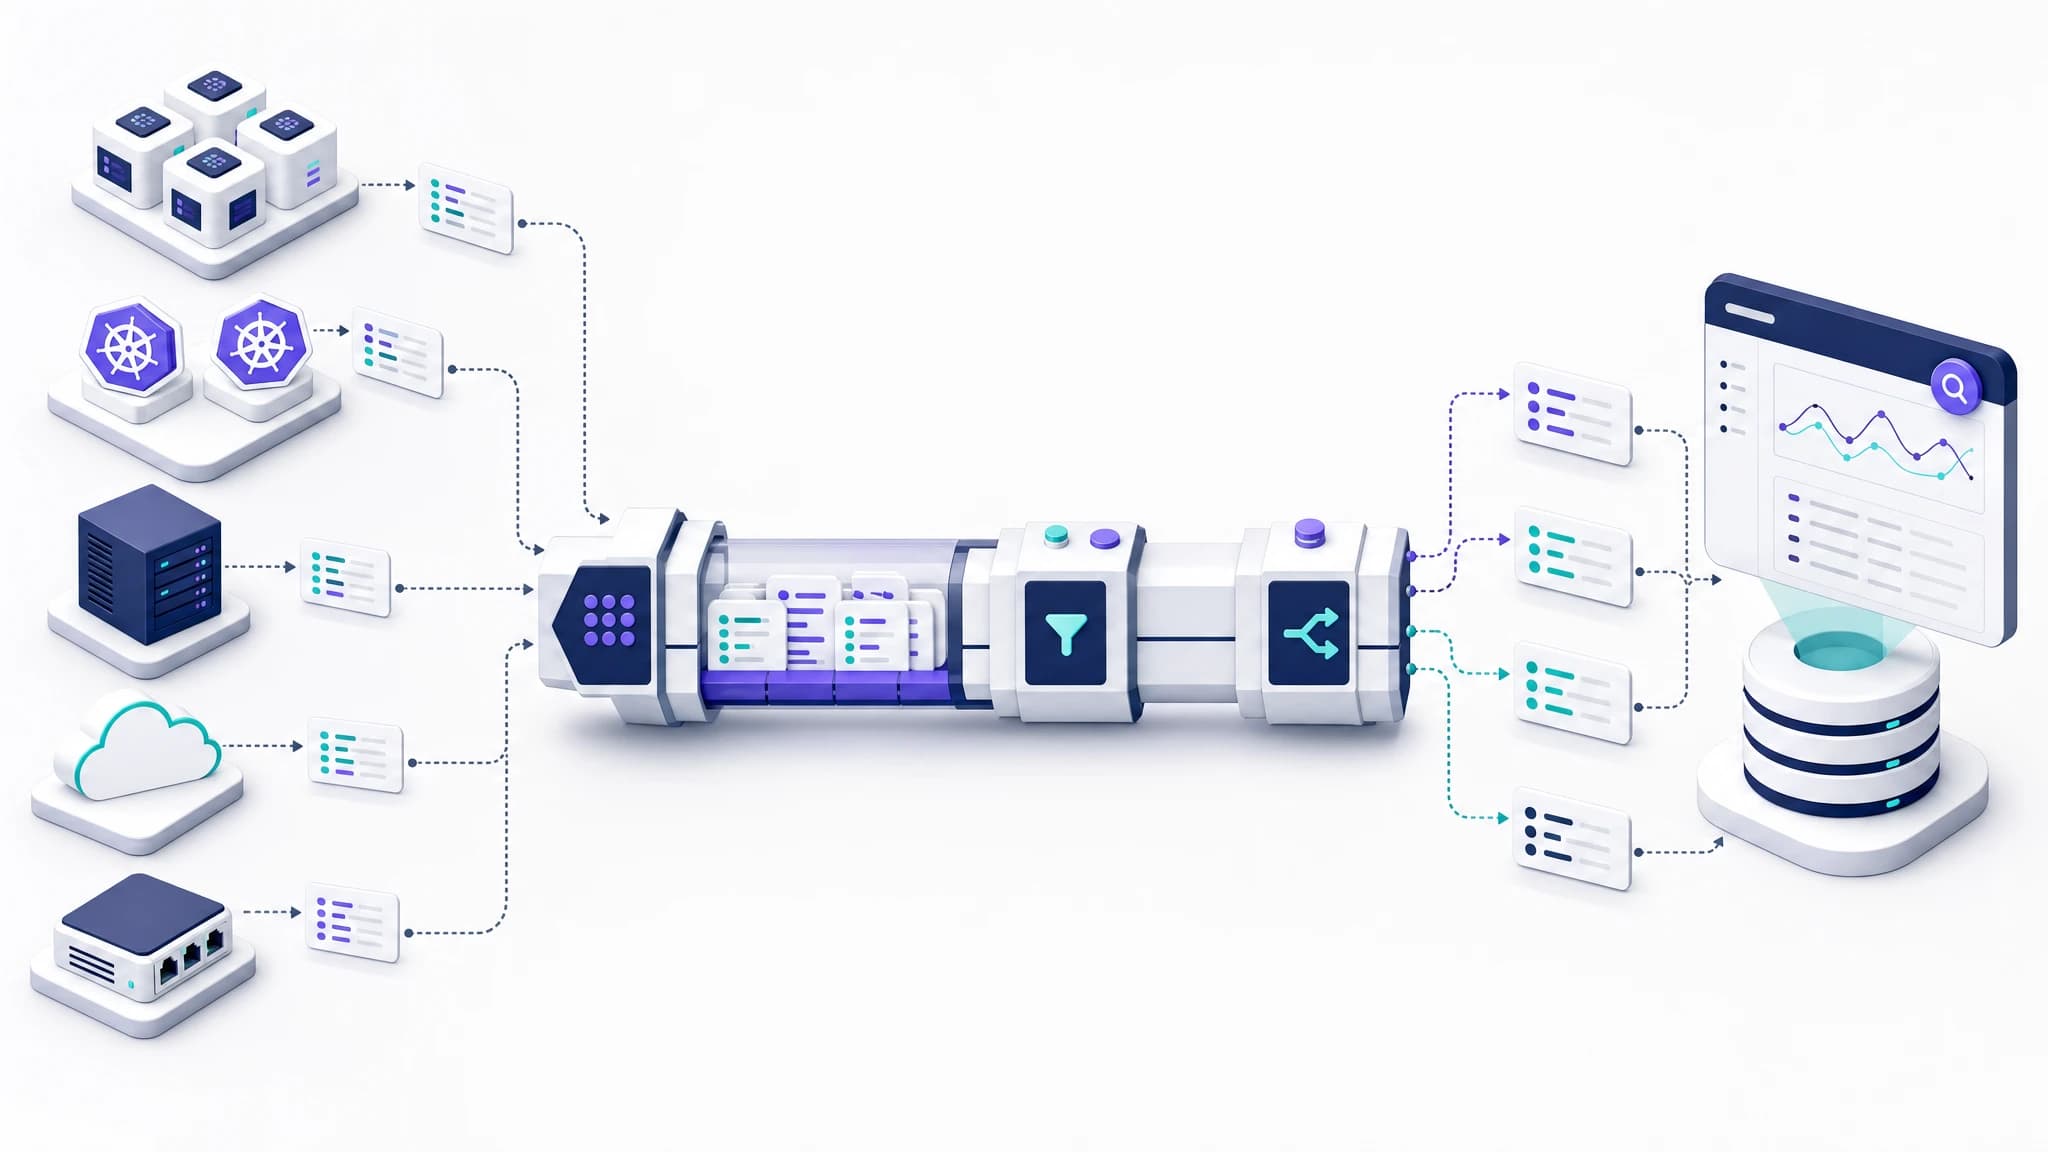
A log aggregation pipeline moves logs from many sources to the right destination. Its design determines where data is collected, buffered, transformed and routed, as well as what survives a downstream outage.
This guide compares ten tools built for those pipeline stages. It does not rank storage and analysis platforms as if they were interchangeable with collectors. If you need to compare searchable backends, read our guides to logging tools and log management tools.
Quick answer: For Kubernetes, use Fluent Bit as a lightweight node-level collector. Add the OpenTelemetry Collector when the pipeline also carries metrics and traces, or Vector when you need centralized transformations and multi-destination routing. Small deployments can send directly from the edge collector to the backend.
Disclosure: Parseable publishes this comparison. Parseable is a destination for the collectors and pipelines reviewed here, not one of the ranked aggregation tools. Products are ordered by common buyer fit, not by a controlled performance benchmark. Test finalists with your own formats, traffic bursts and failure conditions.
Best log aggregation tools at a glance
| Tool | Pipeline role | Best for | Persistent buffering | Deployment |
|---|---|---|---|---|
| Fluent Bit | Edge collector and processor | Lightweight Kubernetes and host collection | Filesystem buffering | Open source; self-hosted |
| OpenTelemetry Collector | Agent or gateway | Vendor-neutral logs, metrics and traces | File-backed sending queues | Open source; self-hosted |
| Vector | Processor and router | Complex log and metric routing | Disk buffers | Open source; self-hosted |
| Grafana Alloy | Agent or gateway | Grafana-centric multi-signal pipelines | Depends on configured components | Open source; self-hosted |
| Fluentd | Collector and router | Plugin-heavy or legacy log pipelines | File buffers | Open source; self-hosted |
| Logstash | Processor and router | Elastic deployments and complex event parsing | Persistent queues | Elastic-licensed; self-hosted |
| Filebeat | Edge shipper | Shipping host logs into Elastic | Disk queue | Elastic-licensed; self-hosted |
| Cribl Stream | Central routing tier | Enterprise multi-signal routing | Disk-backed queues | Commercial; cloud or self-managed |
| Mezmo Telemetry Pipeline | Central processing tier | Visual telemetry transforms and routing | Depends on deployment | Commercial; managed or customer-hosted |
| BindPlane | Collector control plane | Centrally managed multi-signal collector fleets | Provided by managed collectors | Commercial; cloud or self-hosted |
The list separates pipeline software from downstream storage. A collector can buffer and forward logs, but it does not automatically provide durable retention, fast historical queries, dashboards or alerts.
Best open-source log aggregation tools
The best open-source log aggregation tool depends on the pipeline role. Fluent Bit is the lightest starting point for Kubernetes and host collection. The OpenTelemetry Collector is better when one vendor-neutral pipeline carries logs, metrics and traces. Vector provides richer transformation, routing and delivery controls.
Grafana Alloy fits Grafana and Prometheus environments, while Fluentd remains useful when its mature plugin ecosystem covers an unusual source or destination. All five can run inside infrastructure you control. Logstash and Filebeat publish their source, but current Elastic licensing differs from the Apache 2.0 and MPL 2.0 licenses used by the projects above.
What is log aggregation?
Log aggregation is the process of collecting events from applications, servers, containers, network devices and cloud services, then sending them through a common pipeline to centralized storage or analysis.
A production log aggregation pipeline usually performs five steps:
- Collect: Read files, journald, syslog, container output, cloud services, or OTLP endpoints.
- Enrich: Add context such as service, environment, cluster, namespace and region.
- Process: Parse formats, redact sensitive fields, filter noise and normalize schemas.
- Buffer and route: Absorb short destination failures, batch events and send each stream to the required backend.
- Store and analyze: Retain, query, visualize and alert on the data in a separate log platform.
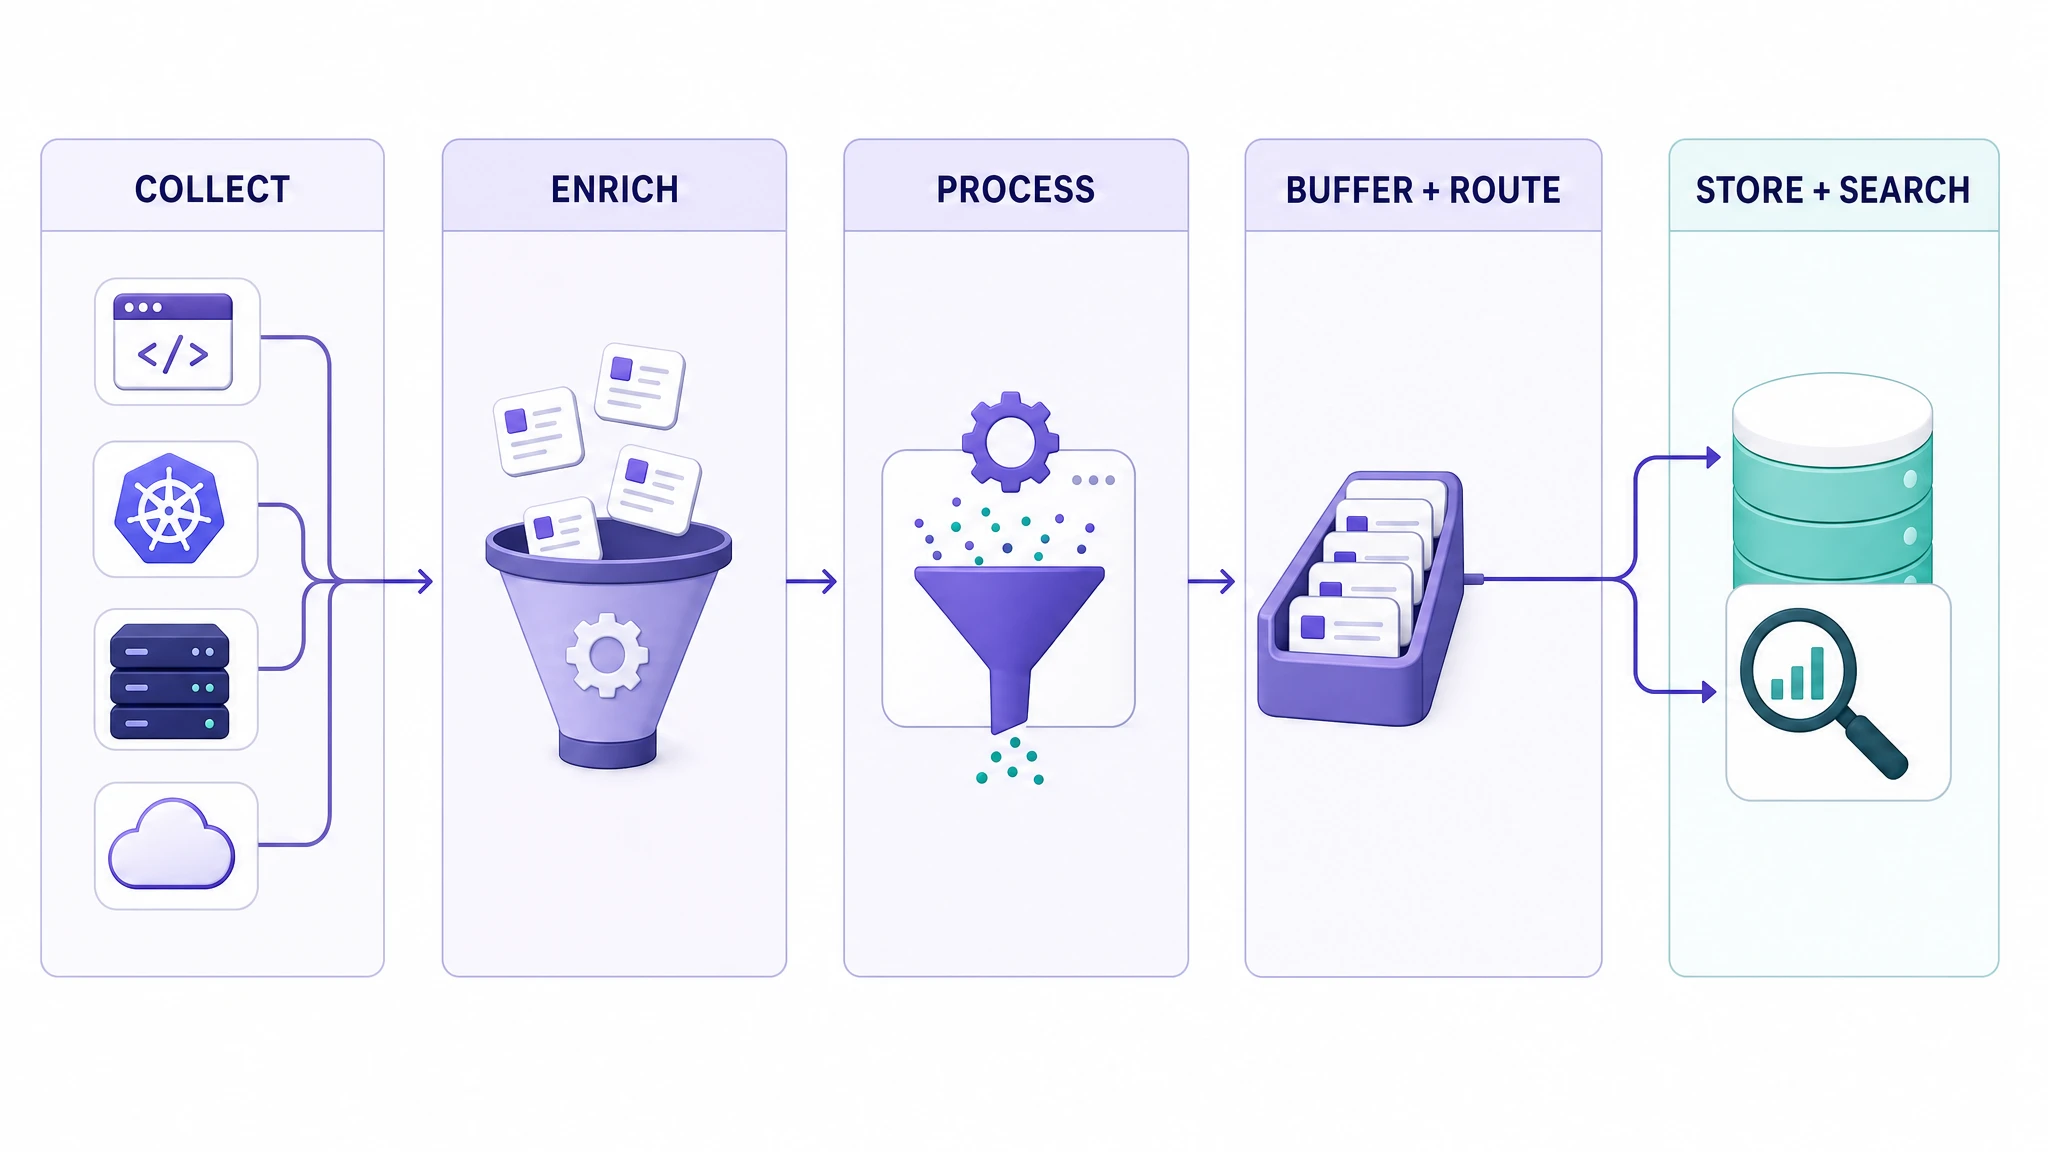
Fluent Bit, for example, is primarily a collector and processor. Parseable is a searchable storage and analysis destination. They can occupy different stages of the same pipeline.
How log aggregation enables centralized logging
Centralized logging starts by moving records from scattered applications, hosts, containers and cloud services into a shared destination. The aggregation layer makes that possible: collectors read each source, attach operational context, normalize incompatible formats and buffer data before delivery.
The destination then stores and indexes, or otherwise organizes, those records for search, dashboards and alerts. Keeping these responsibilities separate makes failures easier to diagnose. If logs stop appearing, teams can determine whether the source stopped producing them, the collector lost its position, a routing tier filled its buffer, or the destination rejected a batch.
This separation also avoids unnecessary lock-in. A team can replace its storage platform without changing every application, or adopt a different collector for one environment while retaining the same central backend.
Log collection vs log aggregation vs log management
Log collection tools read events from their original sources and forward them. Lightweight agents such as Fluent Bit and Filebeat are designed primarily for this edge role.
Log aggregation tools cover the wider in-transit path: collection, enrichment, processing, buffering and delivery. Their operational questions concern source coverage, backpressure, retries, transformations and routing.
Log management covers the longer data lifecycle: indexing or columnar organization, search, retention, access controls, dashboards, alerts, governance and archive policy.
Some vendors bundle both layers. Even then, evaluate them separately. A convenient built-in agent may lack the routing controls you need, while a capable collector cannot compensate for an expensive or slow storage backend.
How we evaluated the tools
We reviewed each product against the following criteria:
- Source and destination support: Can it read the formats you produce and write to the backends you use?
- Buffering and failure behavior: What happens when a destination slows down or becomes unavailable?
- Processing: Can it parse, enrich, sample, redact and transform events before delivery?
- Routing: Can one event stream fan out to multiple destinations with different rules?
- Security and governance: Can it redact sensitive values, encrypt traffic and keep processing inside the required boundary?
- Operational cost: How much configuration, memory and fleet management does the pipeline require?
- Ecosystem fit: Does the tool align with Kubernetes, OpenTelemetry, Elastic, Grafana, or a broader commercial platform?
This is a product and documentation review, not a throughput benchmark. Results from synthetic events rarely predict the effect of your parsers, cardinality, batch sizes, network path and destination latency.
We verified product capabilities against official documentation on August 21, 2026. We did not run a controlled throughput benchmark and the criteria are not weighted into a numerical score.
Detailed comparison of the best log aggregation tools
1. Fluent Bit: Best lightweight collector for Kubernetes
Fluent Bit is a compact telemetry agent commonly deployed as a DaemonSet so each Kubernetes node can collect container logs. Its input, parser, filter and output plugins cover the core path from files or sockets to a central backend.
The project documents filesystem buffering and backpressure controls, which matter when a destination cannot accept data at the incoming rate. Its small operational footprint makes it a sensible first choice for log-only collection at the edge.
Best fit: A lightweight agent on every node when the pipeline is primarily logs and the required input/output plugins already exist.
Limitations: Complex multi-stage transformations can become difficult to reason about in configuration files. If the pipeline also carries metrics and traces, compare it with the OpenTelemetry Collector.
Learn more in the Fluent Bit buffering documentation and our Fluent Bit vs OpenTelemetry Collector comparison.
2. OpenTelemetry Collector: Best vendor-neutral multi-signal pipeline
The OpenTelemetry Collector receives, processes and exports telemetry without tying applications to one backend. A pipeline connects receivers to processors and exporters. The same service can carry logs, metrics and traces, although component maturity varies.
The Collector works well when teams use OTLP as a common transport or expect to change destinations later. Processors can batch, filter, transform and redact telemetry. It can run beside a service, as a node agent, or as a central gateway.
Best fit: Vendor-neutral, multi-signal collection. A dedicated log shipper may be simpler for a log-only pipeline.
Limitations: Core, contrib and vendor distributions include different components. Check the stability level of every receiver, processor and exporter you enable. Configure sending queues, retries and persistent storage according to your loss tolerance.
See the official Collector component model and Collector resiliency guidance.
3. Vector: Best for programmable routing and delivery controls
Vector combines sources, transforms and sinks in one topology. Its Vector Remap Language (VRL) supports structured event transformations, while routing components can direct subsets of traffic to different destinations.
Vector suits aggregation layers that do more than forward data. Disk buffers can preserve queued events across restarts, and supported sources and sinks can participate in end-to-end acknowledgements. These controls need careful configuration; Vector does not claim exactly-once delivery.
Best fit: Conditional routing, substantial transformations, fan-out, or explicit buffer and acknowledgement behavior.
Limitations: Complex topologies have more failure modes. Test each source-to-sink path, including what happens when only one branch of a fan-out fails.
Read Vector's documentation on delivery guarantees and disk buffering.
4. Grafana Alloy: Best for Grafana-centric telemetry collection
Grafana Alloy is Grafana Labs' OpenTelemetry Collector distribution with a component-based configuration model. It can collect logs for Loki, scrape Prometheus metrics and process OpenTelemetry data in the same agent.
Alloy fits teams already invested in Grafana Cloud, Loki, Mimir, Tempo, or Prometheus-compatible workflows. Its Kubernetes components discover pods, attach metadata, process entries and forward them to a Loki endpoint.
Best fit: Grafana-centric observability stacks that need one collector for Grafana and OpenTelemetry pipelines.
Limitations: Alloy is broader than a dedicated log shipper. Teams moving from Promtail or Grafana Agent should account for configuration migration and confirm that each required component is supported.
See Grafana's guide to collecting Kubernetes logs with Alloy.
5. Fluentd: Best for mature plugin-based routing
Fluentd has a long-established plugin ecosystem and a tag-based routing model. It can receive many formats, transform records and forward them to one or more destinations. It remains useful in heterogeneous or older environments.
Compared with Fluent Bit, Fluentd usually belongs at an aggregation tier where richer plugins matter more than a minimal node footprint. The two tools can also be paired: Fluent Bit at the edge and Fluentd centrally.
Best fit: Environments where an existing plugin solves an unusual integration requirement or a team already operates a stable Fluentd pipeline.
Limitations: Plugin quality and maintenance vary. Ruby runtime and plugin behavior can add operational overhead, so load-test the exact configuration rather than relying on generic benchmark claims.
Use the official Fluentd event lifecycle guide to understand its event, tag, and routing model.
6. Logstash: Best for complex parsing in Elastic pipelines
Logstash builds pipelines from input, filter and output plugins. Grok patterns and its filter ecosystem make it effective when teams must parse irregular text or perform several enrichment steps before indexing events in Elasticsearch.
It is usually deployed as a central processing service rather than a lightweight agent on every host. Filebeat often collects at the edge and forwards to Logstash for heavier processing.
Best fit: Elastic pipelines that need mature parsing or enrichment before indexing.
Limitations: JVM sizing, pipeline tuning and regex-heavy filters can raise resource use and latency. Remove transformations that provide no clear downstream value.
See the Logstash processing pipeline.
7. Filebeat: Best lightweight shipper for Elastic users
Filebeat tails files and forwards events to Elasticsearch or Logstash. Its modules package inputs, ingest pipelines and dashboard assets for common services, which reduces setup work in an Elastic environment.
It is intentionally narrower than Vector, Fluentd or the OpenTelemetry Collector. That focus is useful when the requirement is to ship file-based logs into an existing Elastic pipeline.
Best fit: Shipping file-based logs to an established Elasticsearch deployment.
Limitations: Filebeat is not a general vendor-neutral router. Elastic now recommends its broader Elastic Agent for many new deployments, so confirm the long-term collection model before expanding a large Filebeat fleet.
Read the Filebeat overview and current Elastic guidance before choosing it for a new architecture.
8. Cribl Stream: Best for enterprise routing control
Cribl Stream is a commercial telemetry pipeline for parsing, filtering, enriching, sampling and routing data to several destinations. Its visual management and policy controls are designed for large organizations that need a routing layer between many sources and observability or security platforms.
It can reduce or reshape events before costly downstream ingestion and can support phased backend migrations by sending data to old and new destinations at the same time.
Best fit: Central platform teams that need governed multi-destination routing and commercial support.
Limitations: Cribl Stream introduces another licensed control plane and processing tier. Model that cost against the downstream savings and operational control it provides. Verify current limits on the Cribl pricing page.
9. Mezmo Telemetry Pipeline: Best visual pipeline for in-flight data control
Mezmo Telemetry Pipeline provides visual routes for transforming, reducing and delivering telemetry before storage. It targets teams that want pipeline controls without maintaining every transform as hand-written agent configuration.
Teams can use it to suppress noisy events, redact fields, reshape records or route datasets to different analysis platforms.
Best fit: Teams that prefer a visual commercial workflow and centralized control over managing only open-source collectors.
Limitations: Evaluate worker placement, supported sources and destinations and the behavior of queued data during control-plane or destination outages. Review the current capabilities on the Mezmo Telemetry Pipeline page and verify costs on its pricing page.
10. BindPlane: Best for centrally managed OpenTelemetry fleets
BindPlane manages OpenTelemetry Collector configurations and deployments from a central control plane. It helps platform teams apply sources, processors and destinations across a collector fleet without distributing and tracking YAML by hand.
BindPlane manages the fleet; the collectors still receive, process and export the data.
Best fit: OpenTelemetry pipelines that need centralized rollout, policy and fleet visibility.
Limitations: Confirm which features belong to its hosted and self-hosted offerings, then test upgrade and rollback procedures. Include the control plane in failure testing and verify current limits on the BindPlane pricing page.
Review the BindPlane documentation and our guide to a BindPlane and Parseable observability stack.
Honorable mentions and adjacent pipeline components
rsyslog and syslog-ng remain practical choices for established syslog estates. Elastic Agent fits deployments where Elastic is already the destination and a broader agent is preferable to Filebeat. Kafka and Redpanda can provide a durable buffer between collection and storage, but they are brokers rather than log aggregators and add another system to operate.
Edge collector vs aggregation gateway
An edge collector runs beside the workload that produces the logs. A gateway receives data from several edge collectors and applies shared processing before delivery.
| Architecture | Use it when | Main trade-off |
|---|---|---|
| Edge collector only | One lightweight agent can send directly to a reliable backend | Configuration and routing rules are repeated |
| Edge collector + gateway | Many sources need shared redaction, normalization, routing, or credentials | The gateway adds capacity planning and another hop |
| Gateway only | Applications already emit OTLP or another supported protocol over the network | A gateway outage can affect every connected source |
Keep collection close to the source when files, journald, or container output must be tailed reliably. The edge agent owns file positions and can buffer through a short network failure.
Add a gateway when several collectors need the same transformations, when backend credentials should remain centralized, or when data must fan out to observability, security, and archive destinations. Give the gateway enough persistent buffering for the destination outage you intend to survive.
Skip the gateway when it only forwards unchanged batches to one backend. The extra hop adds latency, resource use, and another failure mode without improving control.
Common pipeline patterns include:
Kubernetes nodes → Fluent Bit → Parseable: Fluent Bit owns collection and short-term buffering, while Parseable handles retention, search and alerts. See the Fluent Bit ingestion documentation.Applications and infrastructure → OpenTelemetry Collector → Parseable: The Collector receives multi-signal telemetry, applies shared processing and exports it through a vendor-neutral pipeline.Sources → Vector, Cribl, or Mezmo → Parseable + SIEM + archive: A routing tier prepares different copies for observability, security and lower-cost storage.
Which log aggregation tool should you choose?
Shortlist tools by pipeline role.
| Requirement | Shortlist | Why |
|---|---|---|
| Lightweight Kubernetes log collection | Fluent Bit, Filebeat | Small edge-focused agents |
| Vendor-neutral logs, metrics and traces | OpenTelemetry Collector, Grafana Alloy | Multi-signal pipelines and OTLP |
| Complex transforms and multi-destination routing | Vector, Cribl Stream, Mezmo | Rich routing and processing controls |
| Existing Elastic deployment | Filebeat and Logstash | Native Elastic collection and parsing path |
| Broad legacy source coverage | Fluentd | Mature plugin ecosystem |
| Centrally managed OpenTelemetry fleet | BindPlane | Collector configuration and fleet management |
Using Parseable as the destination: Pair Fluent Bit with Parseable for a lightweight Kubernetes log pipeline. Use the OpenTelemetry Collector when the same pipeline carries logs, metrics and traces. Put Vector, Cribl Stream, or Mezmo in front of Parseable when events need heavier processing or must be routed to several destinations. Parseable then handles storage, search, dashboards and alerts rather than duplicating the collector's job.
Then test the shortlist with production-like failure cases:
- Stop the destination and measure how long the pipeline can buffer.
- Restart the collector and check which queued events survive.
- Send malformed and oversized records through every parser.
- Confirm that redaction happens before data leaves the required boundary.
- Measure CPU, memory, disk and network use during a real traffic burst.
- Verify duplicates and loss using source IDs instead of relying on dashboard counts.
- Test configuration rollout and rollback across the fleet.
Where Parseable fits
Parseable sits after the aggregation layer. Fluent Bit, the OpenTelemetry Collector, Vector and other compatible shippers send events to Parseable, which stores telemetry in Apache Parquet on S3-compatible object storage and provides SQL search, dashboards and alerts.
Teams can choose a collector based on source and routing needs without coupling it to the storage engine. For a simple log-only Kubernetes pipeline, pair Fluent Bit with Parseable. For a vendor-neutral multi-signal pipeline, send OTLP through the OpenTelemetry Collector.
Explore the Parseable log monitoring platform, follow the ingestion documentation, or try Parseable Cloud.