
A database can be available and still make an application miserable. One query changes plans, a connection pool fills, or replication falls behind. CPU may look fine while users wait.
That is why the best database monitoring tools go beyond uptime and host metrics. They show which queries consume time, where sessions wait, when plans change and whether the problem began in the database, application, or infrastructure around it.
Our short answer: pganalyze is the strongest specialist for PostgreSQL, Redgate Monitor fits DBA teams running several major database engines, Datadog and Dynatrace provide the broadest application context, Percona PMM is the strongest open-source option and Parseable fits teams that want to retain and correlate database telemetry with logs, metrics and traces without a separate per-database license.
This is a fit-based comparison, not a claim that one tool wins every workload. Parseable is included because this is the Parseable blog, but each product is judged by the same practical questions: query depth, database coverage, deployment, operational effort and how its bill grows.
Database monitoring tools at a glance
| Tool | Best for | Query depth | Deployment | Pricing shape | Main tradeoff |
|---|---|---|---|---|---|
| Parseable | Unified, long-retention database telemetry | Telemetry dependent | Cloud, self-hosted, BYOC | Per GB or self-hosted | Not a dedicated query tuner |
| Datadog | Database-to-application correlation | Deep on supported engines | SaaS | Per database host and normalized query | Cost grows across product modules |
| SolarWinds DPA | Wait-time and SQL tuning analysis | Deep | Self-managed | Per monitored instance; quote | Adds another specialist console |
| Redgate Monitor | DBA teams managing mixed estates | Deep, engine dependent | Self-managed or cloud | Per server or cloud instance | Depth differs by database engine |
| Dynatrace | AI-assisted full-stack diagnosis | Deep on supported engines | SaaS or managed deployment | Platform consumption | More platform than small teams need |
| IBM Instana | Automatic discovery in dynamic estates | Application-centric | SaaS or self-hosted | Per managed virtual server | Less DBA-specific than specialists |
| Site24x7 | Small teams needing broad monitoring | Moderate | SaaS | Plan and monitor based | Shallower query diagnostics |
| ManageEngine Applications Manager | On-premises enterprise monitoring | Moderate | Self-managed | Per monitor | More administration and older workflows |
| pganalyze | PostgreSQL query and plan analysis | Very deep | SaaS or enterprise self-hosted | Plan and server based | PostgreSQL only |
| Percona PMM | Open-source MySQL, PostgreSQL and MongoDB monitoring | Deep | Self-hosted | Free software; infrastructure and labor | You operate the monitoring system |
Do not choose from this table alone. “Supports PostgreSQL” can mean a connection-count dashboard or automatic EXPLAIN plan collection. Those are not the same product.
What are database monitoring tools?
Database monitoring tools continuously collect database health and workload data so teams can detect slowdowns, explain their cause and verify a fix. Useful tools track both the server layer - CPU, memory, storage, connections, replication - and the query layer - latency, throughput, wait events, locks, deadlocks, execution plans and index behavior.
A basic database monitoring system tells you that latency rose. A stronger one tells you which normalized query drove the load, what it waited on, whether its plan changed after a deployment and which services or users were affected.
Database performance monitoring is not the same as database activity monitoring. Performance tools diagnose reliability and speed. Activity monitoring focuses on access, audit trails, suspicious behavior and compliance. Some products cover parts of both, but this guide evaluates performance monitoring.
How we evaluated the tools
We reviewed current product documentation and pricing pages, then compared each tool on five questions:
- Can it diagnose query problems? We looked for normalized queries, wait events, locks, plans and regression history - not only server gauges.
- Which engines get native depth? A generic integration does not count as equivalent to engine-specific analysis.
- Can it connect database symptoms to the application? Traces, deployment events, logs and service dependencies shorten investigations.
- Who operates it? SaaS, self-hosted and BYOC products create different security and maintenance burdens.
- What makes the bill grow? Hosts, database instances, monitored queries, telemetry volume, retention and staff time all matter.
We did not run a controlled performance benchmark, so the order below is not an aggregate ranking. The list groups the main buying models: unified telemetry, commercial database monitoring software, specialist analysis and open source.
Pricing and packaging change. The links below point to vendor pages; verify a quote against your engine count, retention and expected telemetry volume.
What to look for in the best database monitoring tools
Query-level evidence
Host CPU cannot tell you whether one expensive query or a million cheap queries caused the load. Ask to see normalized query statistics, total time, calls, wait events, lock chains, plan history and an example regression investigation.
Native engine coverage
Build a row for every engine and hosting model you run: PostgreSQL, MySQL, SQL Server, Oracle, MongoDB, Redis, RDS, Aurora, Cloud SQL and the rest. Then make the vendor demonstrate the depth of each integration. Product-wide claims can hide important gaps.
Collection cost and safety
Check whether collection is agent-based, agentless, log-based, extension-based, or driven by database system views. Confirm required privileges, sampling behavior, query obfuscation and overhead. A monitor that exposes literals from production SQL creates a security problem while solving a performance one.
Application context
Database incidents rarely stop at the database boundary. Traces reveal the affected endpoint. Deployment events explain when a regression began. Logs carry errors that a metric cannot. If SREs own incidents, this context may matter more than a DBA-only tuning workflow.
Retention and pricing shape
An incident from three weeks ago cannot be investigated with seven days of history. Historical baselines should also expose storage growth, connection pressure and replication trends for capacity planning and useful alerts. Price the same scenario across vendors: actual database hosts, query count, ingestion, retention and environments. Also count the infrastructure and staff time required by open-source tools.
For the operating practices behind the tool, our guide to proactive database monitoring covers baselines, capacity signals and alert design.
The 10 best database monitoring tools in 2026
1. Parseable: best database monitoring tool for cost-efficient unified observability
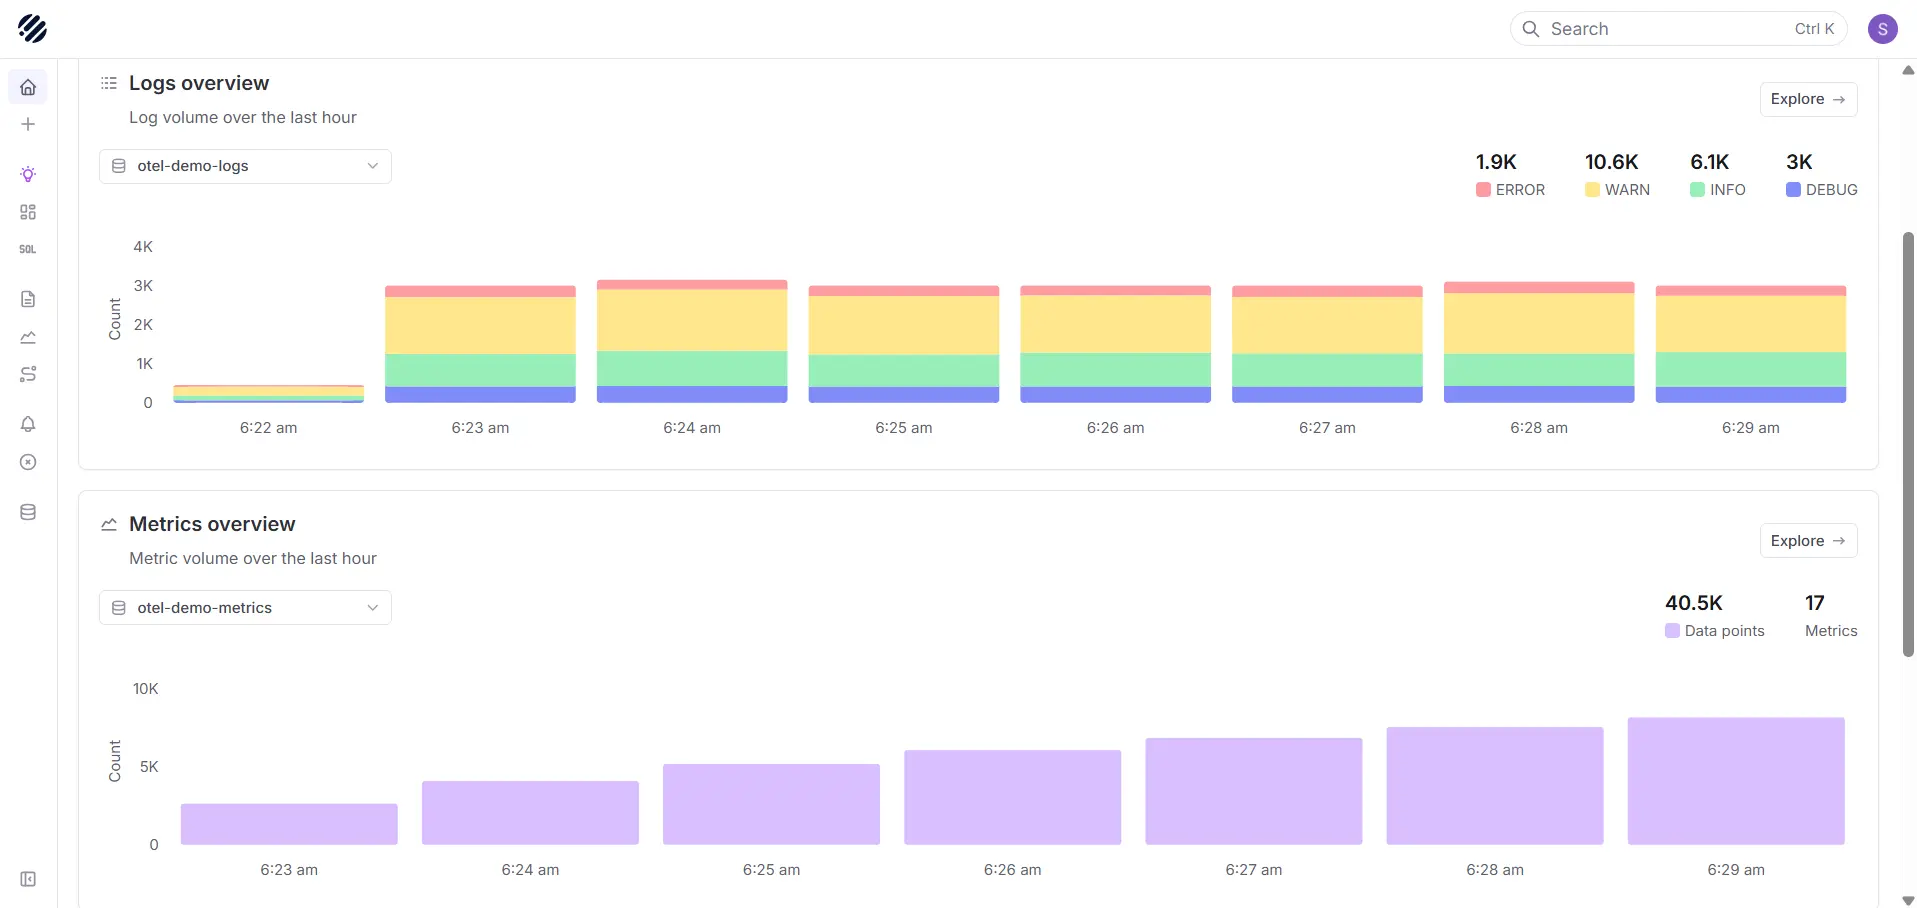
Parseable is a unified observability platform for teams that want database logs, OpenTelemetry metrics, traces and application telemetry in one system with object storage underneath. It does not offer specialist SQL tuning.
That distinction matters. If you need automatic PostgreSQL plan advice, start with pganalyze. If the harder problem is retaining high-volume database telemetry, querying it with SQL and correlating it with the service and deployment around an incident, Parseable is the better fit.
Best for: platform and SRE teams that already collect database telemetry and want open ingestion, long retention and deployment control.
What stands out:
- Logs, metrics and traces can be queried and correlated in one platform.
- OpenTelemetry support avoids tying collection to one proprietary agent.
- S3-compatible object storage makes long retention practical for high-volume telemetry.
- Cloud, self-hosted and BYOC options cover different sovereignty requirements.
- SQL-based analysis is familiar to database and data-platform teams.
Watch for: Parseable does not currently replace engine-specific plan advisors, index recommendations, or automatic query tuning. Collection depth depends on the database telemetry and OpenTelemetry pipeline you configure.
Pricing: Parseable is free to self-host. Parseable Cloud pricing is based on ingestion volume and Enterprise pricing is custom.
2. Datadog
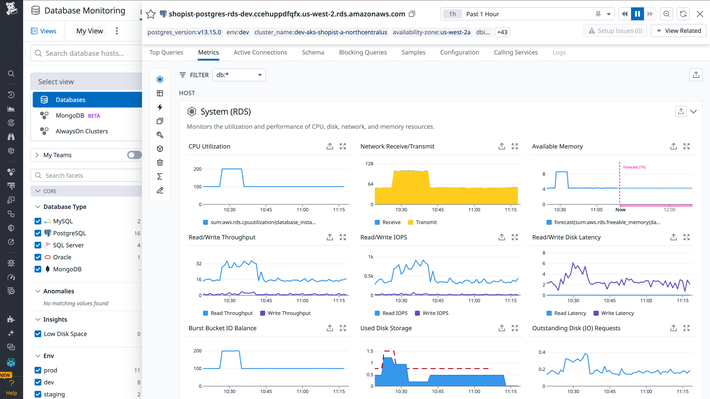
Datadog Database Monitoring combines query metrics, explain plans, wait-event analysis, blocking-query views and application context. Its advantage is the investigation path from a slow endpoint to the trace, database host and normalized query in the same platform.
Best for: teams already using Datadog APM and infrastructure monitoring across supported database engines.
What stands out:
- Query metrics and samples sit beside traces, logs and host telemetry.
- Wait-event and blocking-query analysis help separate contention from resource pressure.
- Managed database services are covered without losing application context.
- Monitors, dashboards and service maps reduce the need to build the first view yourself.
Watch for: support and depth vary by engine. The commercial model also has several dimensions. Datadog's billing documentation says Database Monitoring meters database hosts and configured normalized queries; adjacent APM and log products are billed separately.
3. SolarWinds Database Observability
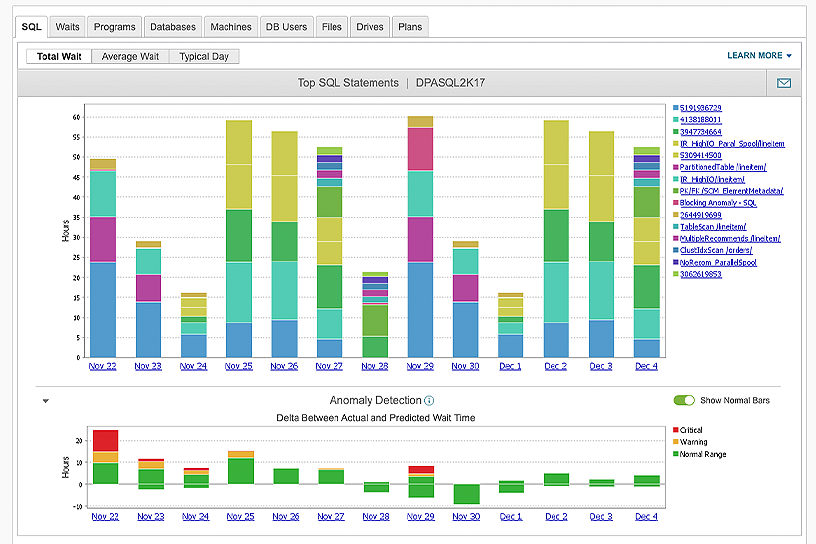
SolarWinds Database Performance Analyzer is built around wait-time analysis. Instead of stopping at “the query is slow,” it shows where time is spent across CPU, storage, locks and other waits. That makes it useful for DBA teams troubleshooting expensive SQL across self-managed and cloud databases.
Best for: teams that want cross-engine SQL analysis and database tuning without buying a full observability suite.
What stands out:
- Agentless collection and wait-based analysis focus attention on the work delaying queries.
- Historical query and anomaly views support regression analysis.
- The product covers major commercial and open-source engines across cloud and on-premises deployments.
- Tuning advisors connect wait evidence to queries and indexes.
Watch for: DPA is a database specialist, so application traces and logs may still live elsewhere. Licensing is tied to monitored database instances and editions. Use the vendor's current quote rather than old list prices copied into comparison pages.
4. Redgate Monitor: best DB monitoring tool for SQL Server and PostgreSQL teams
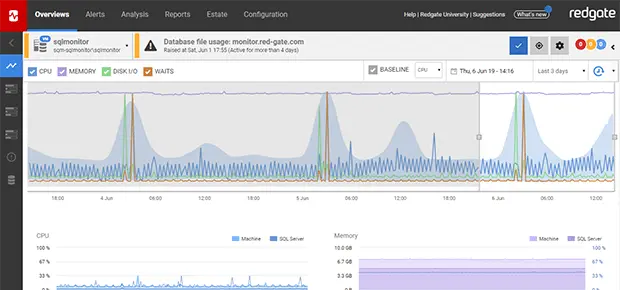
Redgate Monitor grew from deep SQL Server monitoring and now covers PostgreSQL, Oracle, MySQL and MongoDB. It gives DBAs fleet health, query investigation, alerting, blocking analysis and deployment context in one operational console.
Best for: DBA teams that want a database-first workflow and need more than one engine in the same estate.
What stands out:
- Strong SQL Server diagnostics, blocking views and alert workflows.
- Fleet-level health helps a small DBA team manage many instances.
- Deployment markers make it easier to connect a performance change to a release.
- Cloud and self-managed database environments are supported.
Watch for: capabilities are not identical across engines. Redgate's own engine comparison shows that query tracking and search are deeper for SQL Server and PostgreSQL than for some newer integrations. Price the exact mix you operate; licensing varies by server and cloud instance.
5. Dynatrace
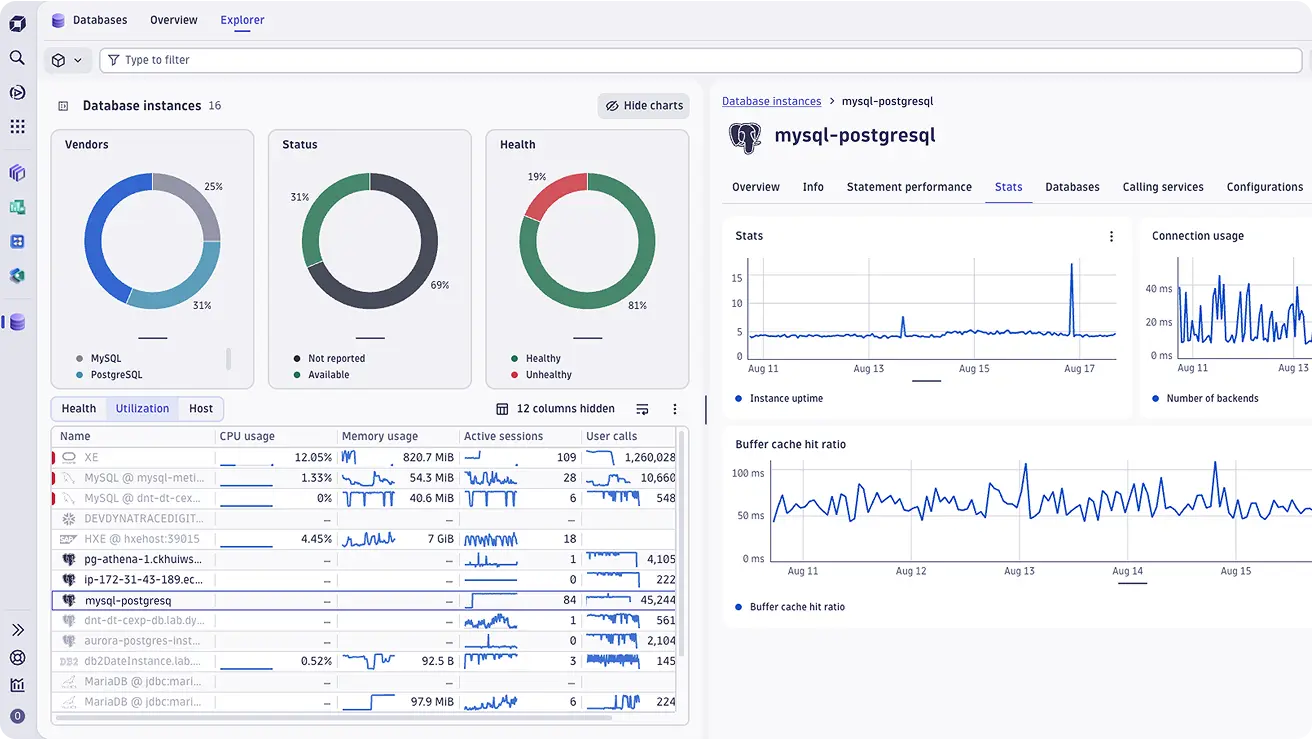
Dynatrace Database Monitoring treats databases as part of a larger causal graph. It combines fleet health, statements, execution plans, blocking queries, deadlocks, logs, metrics, traces and service-level impact.
Best for: large application estates where automated topology and cross-stack root-cause analysis matter more than a standalone DBA console.
What stands out:
- Database health is connected to services, infrastructure, SLOs and user impact.
- Automatic discovery reduces manual inventory work in dynamic environments.
- Query and plan analysis can be investigated alongside application behavior.
- SaaS and managed deployment choices suit enterprise operations.
Watch for: Dynatrace is a broad platform with platform-level packaging and administration. It can be excessive for a team that needs one PostgreSQL advisor or a few database dashboards. Verify current engine support and estimate the full platform consumption, not only the database feature.
6. IBM Instana
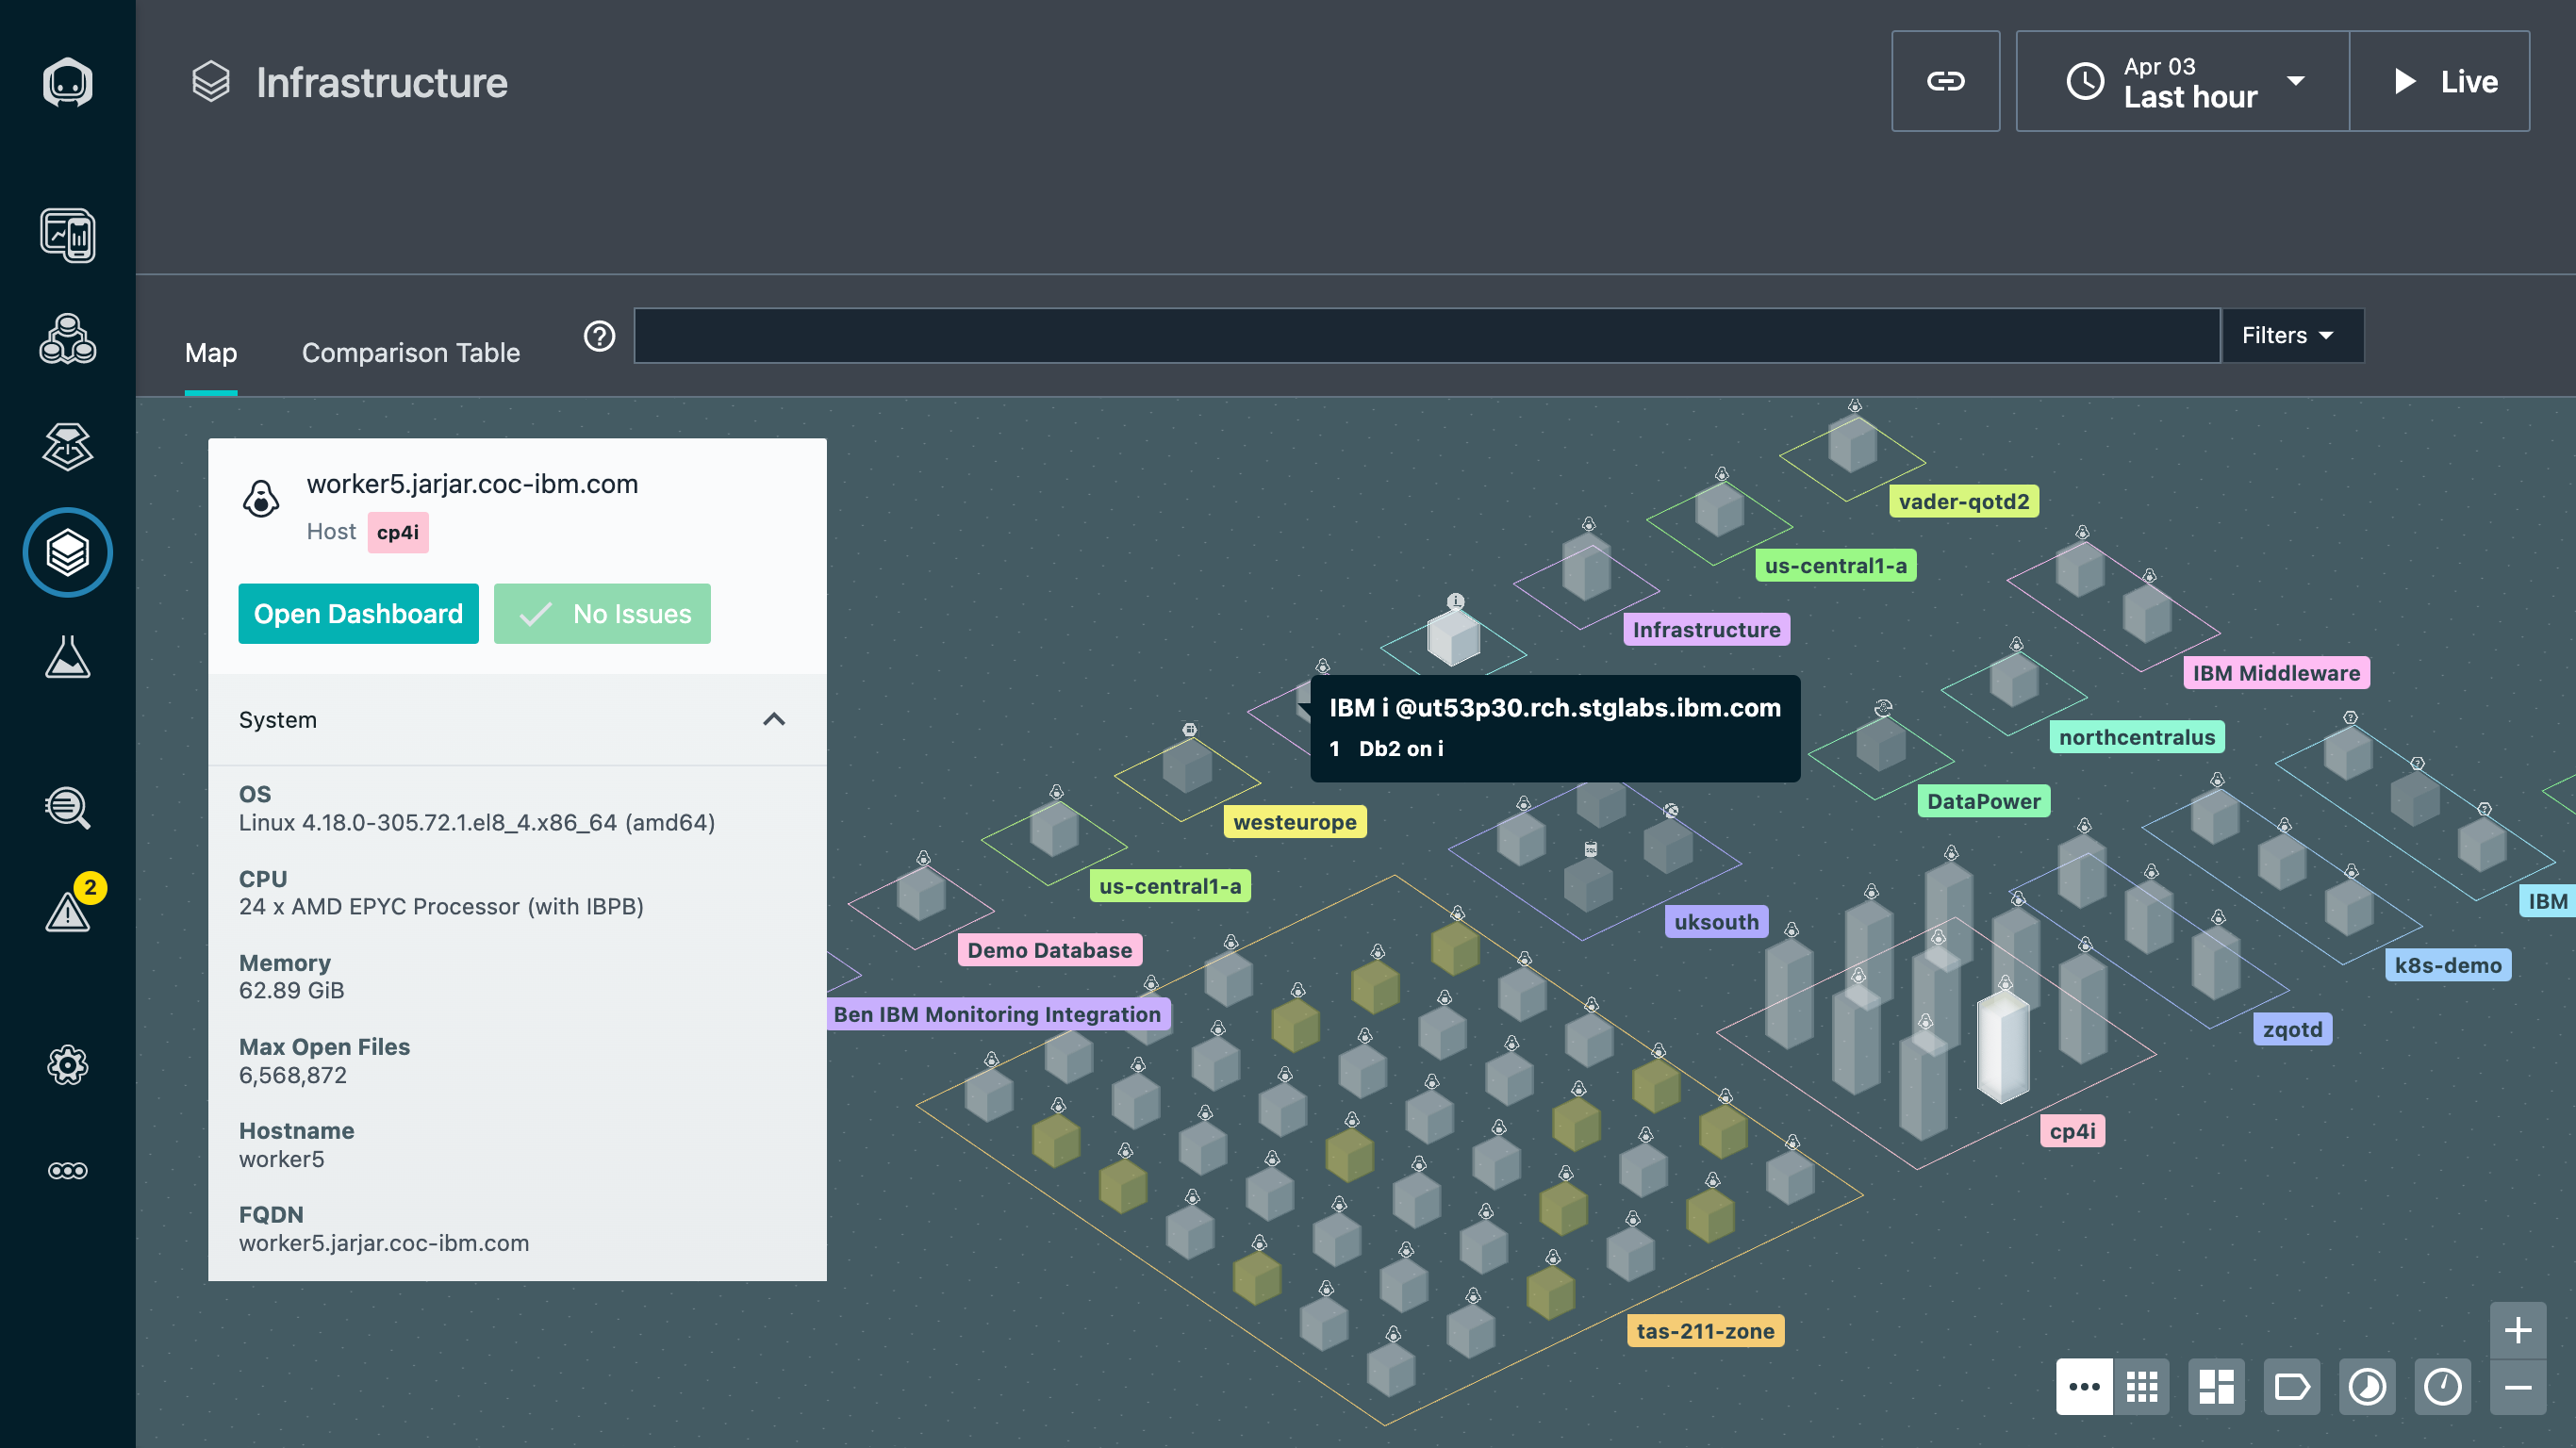
IBM Instana automatically discovers application dependencies and database technologies, then connects database latency and errors to upstream requests. Its database story is strongest when the question is “which service and request caused this?” rather than “which index should the DBA create?”
Best for: enterprises running dynamic microservice environments that value low-configuration discovery and application context.
What stands out:
- Automatic discovery and dependency mapping reduce setup across changing estates.
- Database telemetry is correlated with unsampled application traces and infrastructure.
- SaaS and self-hosted plans address different governance requirements.
- Broad technology coverage fits heterogeneous enterprise environments.
Watch for: query-tuning depth is not the same as a dedicated DBA tool and IBM licenses Instana by managed virtual server. Review the current Instana pricing and data-ingestion terms against your topology.
7. Site24x7: best for SMB teams needing multi-database monitoring
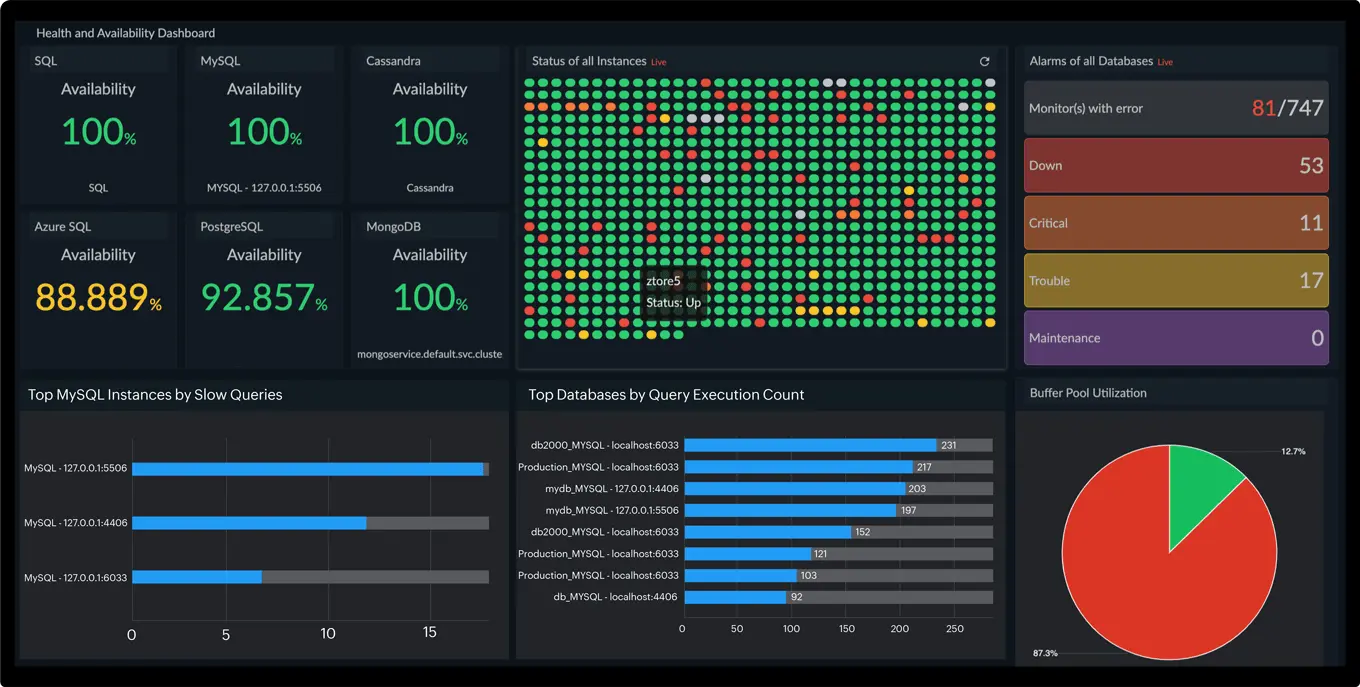
Site24x7 Database Monitoring covers availability, health, resource usage, alerts and selected query insights for SQL Server, MySQL, MariaDB, PostgreSQL, Oracle, RDS and Aurora. It packages this with server, application, website and cloud monitoring.
Best for: small teams that need broad operational coverage and quick setup more than specialist query tuning.
What stands out:
- Prebuilt monitors cover common relational databases and managed cloud variants.
- Infrastructure, application and database signals share one subscription and alert path.
- Configuration rules help apply monitor settings across similar resources.
- A low entry tier makes evaluation easy.
Watch for: query and plan analysis are shallower than pganalyze, Redgate, or SolarWinds DPA. The advertised platform starting price is not the cost of every database scenario; Site24x7 pricing grows with plan allowances, monitor types and add-ons.
8. ManageEngine Applications Manager
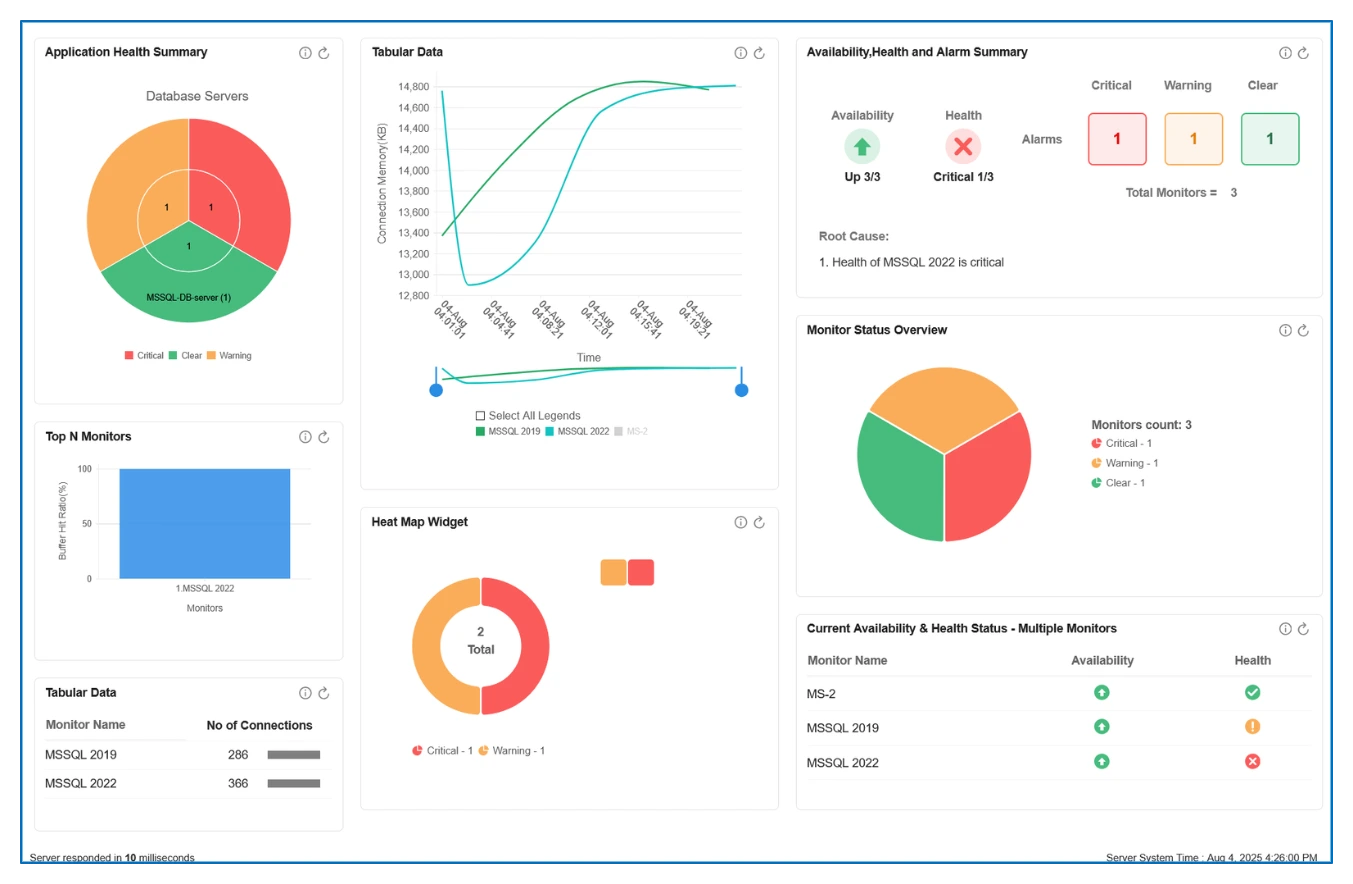
ManageEngine Applications Manager is a self-managed application and infrastructure monitoring platform with database monitors for Oracle, SQL Server, MySQL, PostgreSQL, Db2, Sybase and other enterprise systems.
Best for: IT operations teams that require on-premises monitoring and already use ManageEngine workflows.
What stands out:
- One console covers applications, servers, databases, middleware and cloud resources.
- Database monitors include availability, health, resource, session and query signals.
- Alert actions and reporting fit traditional enterprise operations.
- A free edition supports a small evaluation environment.
Watch for: this is a platform you operate, upgrade and scale. It offers broad coverage, but database-specific analysis is not as deep as a specialist for every engine. Applications Manager pricing is based on monitored resources and edition, so map every database instance before comparing quotes.
9. pganalyze: best for deep PostgreSQL query analysis
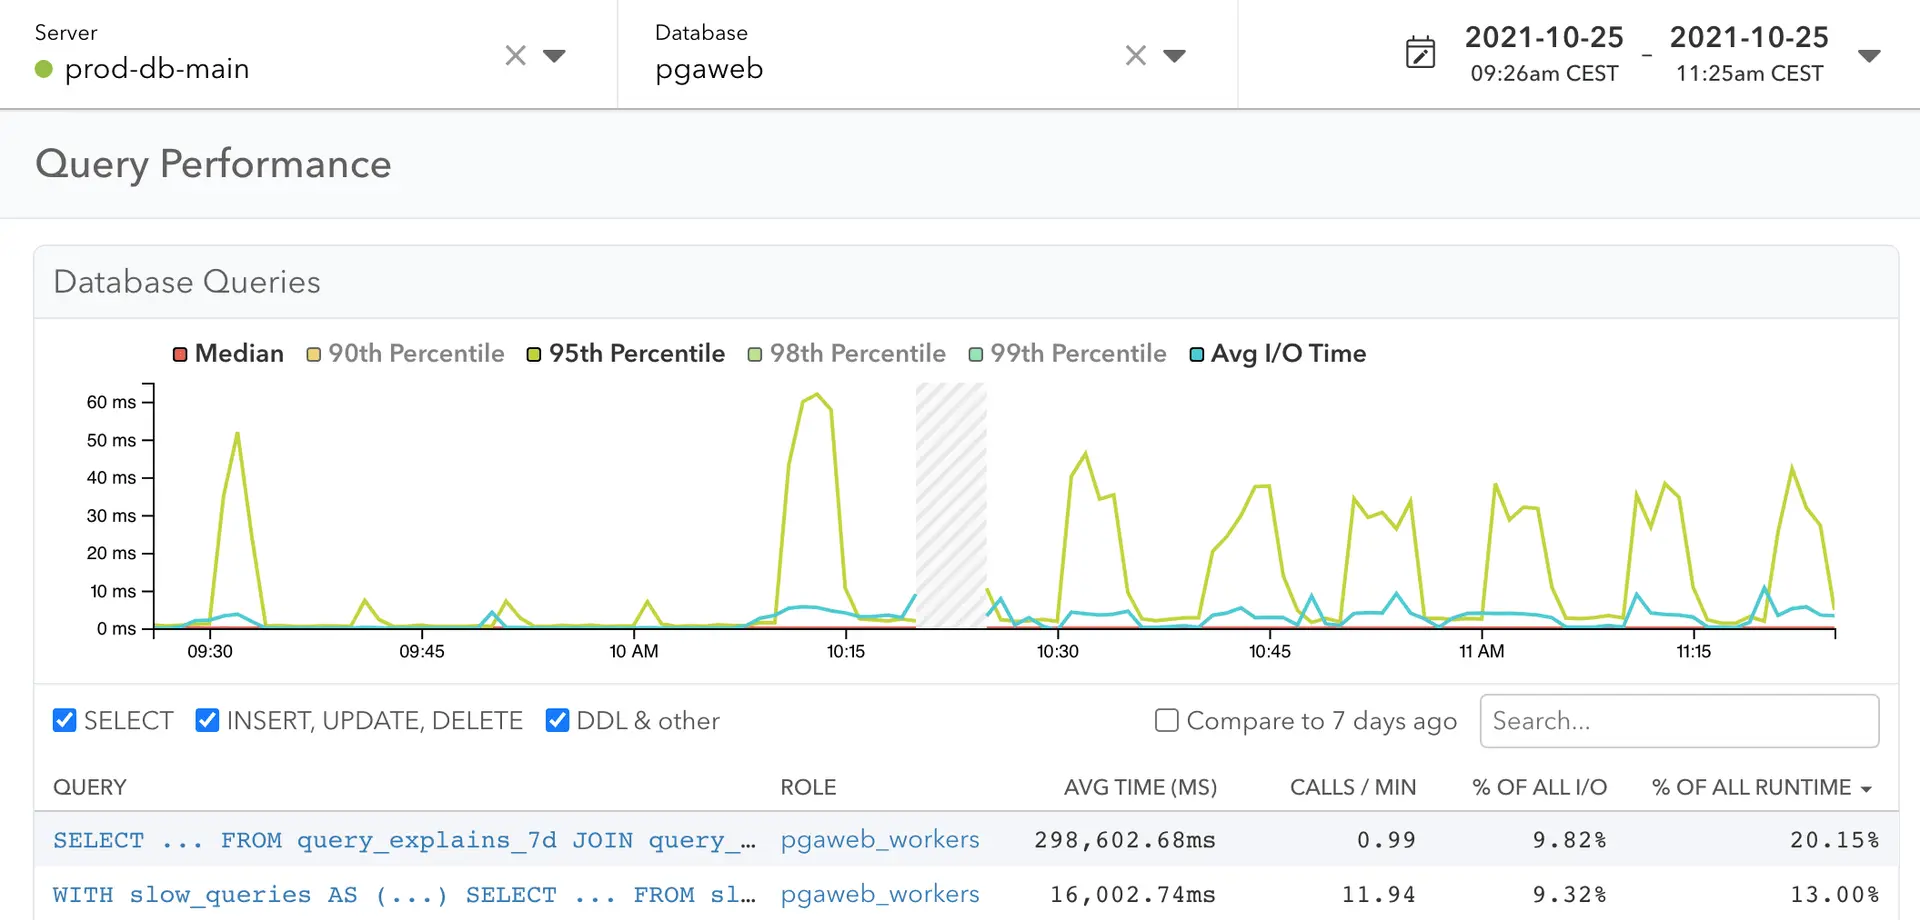
pganalyze is focused on PostgreSQL and that narrow scope is its advantage. It collects pg_stat_statements data, wait events, logs, schema statistics and EXPLAIN plans, then turns them into query, index and vacuum investigation workflows.
Best for: teams whose important databases are PostgreSQL and whose main problem is query performance rather than cross-engine coverage.
What stands out:
- Per-query history shows total load, latency, calls and plan changes.
- Automatic plan collection and visualization expose planner regressions.
- Index Advisor and Query Advisor turn evidence into concrete tuning work.
- Hosted and enterprise self-hosted deployments cover cloud and regulated environments.
Watch for: pganalyze monitors PostgreSQL, not a mixed MySQL, MongoDB and SQL Server estate. It can complement a wider observability platform rather than replace it. Review the collector permissions and automatic EXPLAIN settings before enabling them in production.
10. Percona Monitoring and Management (PMM): best open-source database monitoring tool
Percona Monitoring and Management is an open-source database observability platform for MySQL, PostgreSQL, MongoDB and the servers beneath them. PMM combines database metrics, Query Analytics, advisors, alerts and Grafana-based dashboards.
Best for: database teams that want deep open-source monitoring and are prepared to operate the monitoring stack.
What stands out:
- Query Analytics links statement fingerprints to latency and resource use.
- Prebuilt dashboards cover database, operating-system and replication health.
- PMM works across self-managed and managed database deployments.
- The software has no license fee and is backed by Percona's database expertise.
Watch for: free software does not mean zero cost. Your team owns upgrades, access control, storage, backups and the availability of PMM itself. It also does not provide the same application-wide trace context as a full observability platform.
How to choose the right database monitoring tool
Start with the failure you cannot explain today.
- A PostgreSQL query changed plans: shortlist pganalyze, then compare it with the PostgreSQL depth in Redgate or your existing observability platform.
- A mixed database estate needs one DBA console: compare Redgate Monitor and SolarWinds DPA engine by engine.
- An application incident crosses services and databases: compare Datadog, Dynatrace, Instana and Parseable on correlation and retention.
- A small team needs one broad monitor: evaluate Site24x7 before accepting the operational weight of a larger platform.
- Licensing cost is the blocker: compare Percona PMM's operating cost with Parseable's ingestion model and the per-host or per-instance commercial quotes.
- Data must stay in your environment: shortlist self-hosted or BYOC options first; features cannot rescue a product that fails the governance review.
Then run the same proof of concept in every finalist. Introduce one slow query, one lock chain, one connection spike and one plan change. Ask a developer who did not configure the tool to diagnose each event. A useful demo gets your team from symptom to evidence with the fewest guesses.
For PostgreSQL specifically, pg_stat_statements is often the starting point for query statistics. Our PostgreSQL query insights guide explains what that data can and cannot tell you. If you are standardizing collection across services, the OpenTelemetry Collector guide covers the pipeline between sources and a backend.
Conclusion
The right tool depends on the investigation. Database specialists go deeper on plans, waits and indexes. Full-stack observability platforms provide better service context. Open-source tools trade license fees for operating work.
Choose pganalyze for PostgreSQL tuning depth, Redgate or SolarWinds for DBA-led multi-engine analysis, Datadog or Dynatrace for application correlation, Site24x7 for a simpler broad monitor and Percona PMM when open-source control matters most. Choose Parseable when your database investigation depends on retaining and correlating open telemetry across the wider system - not when you need an automatic index advisor.