
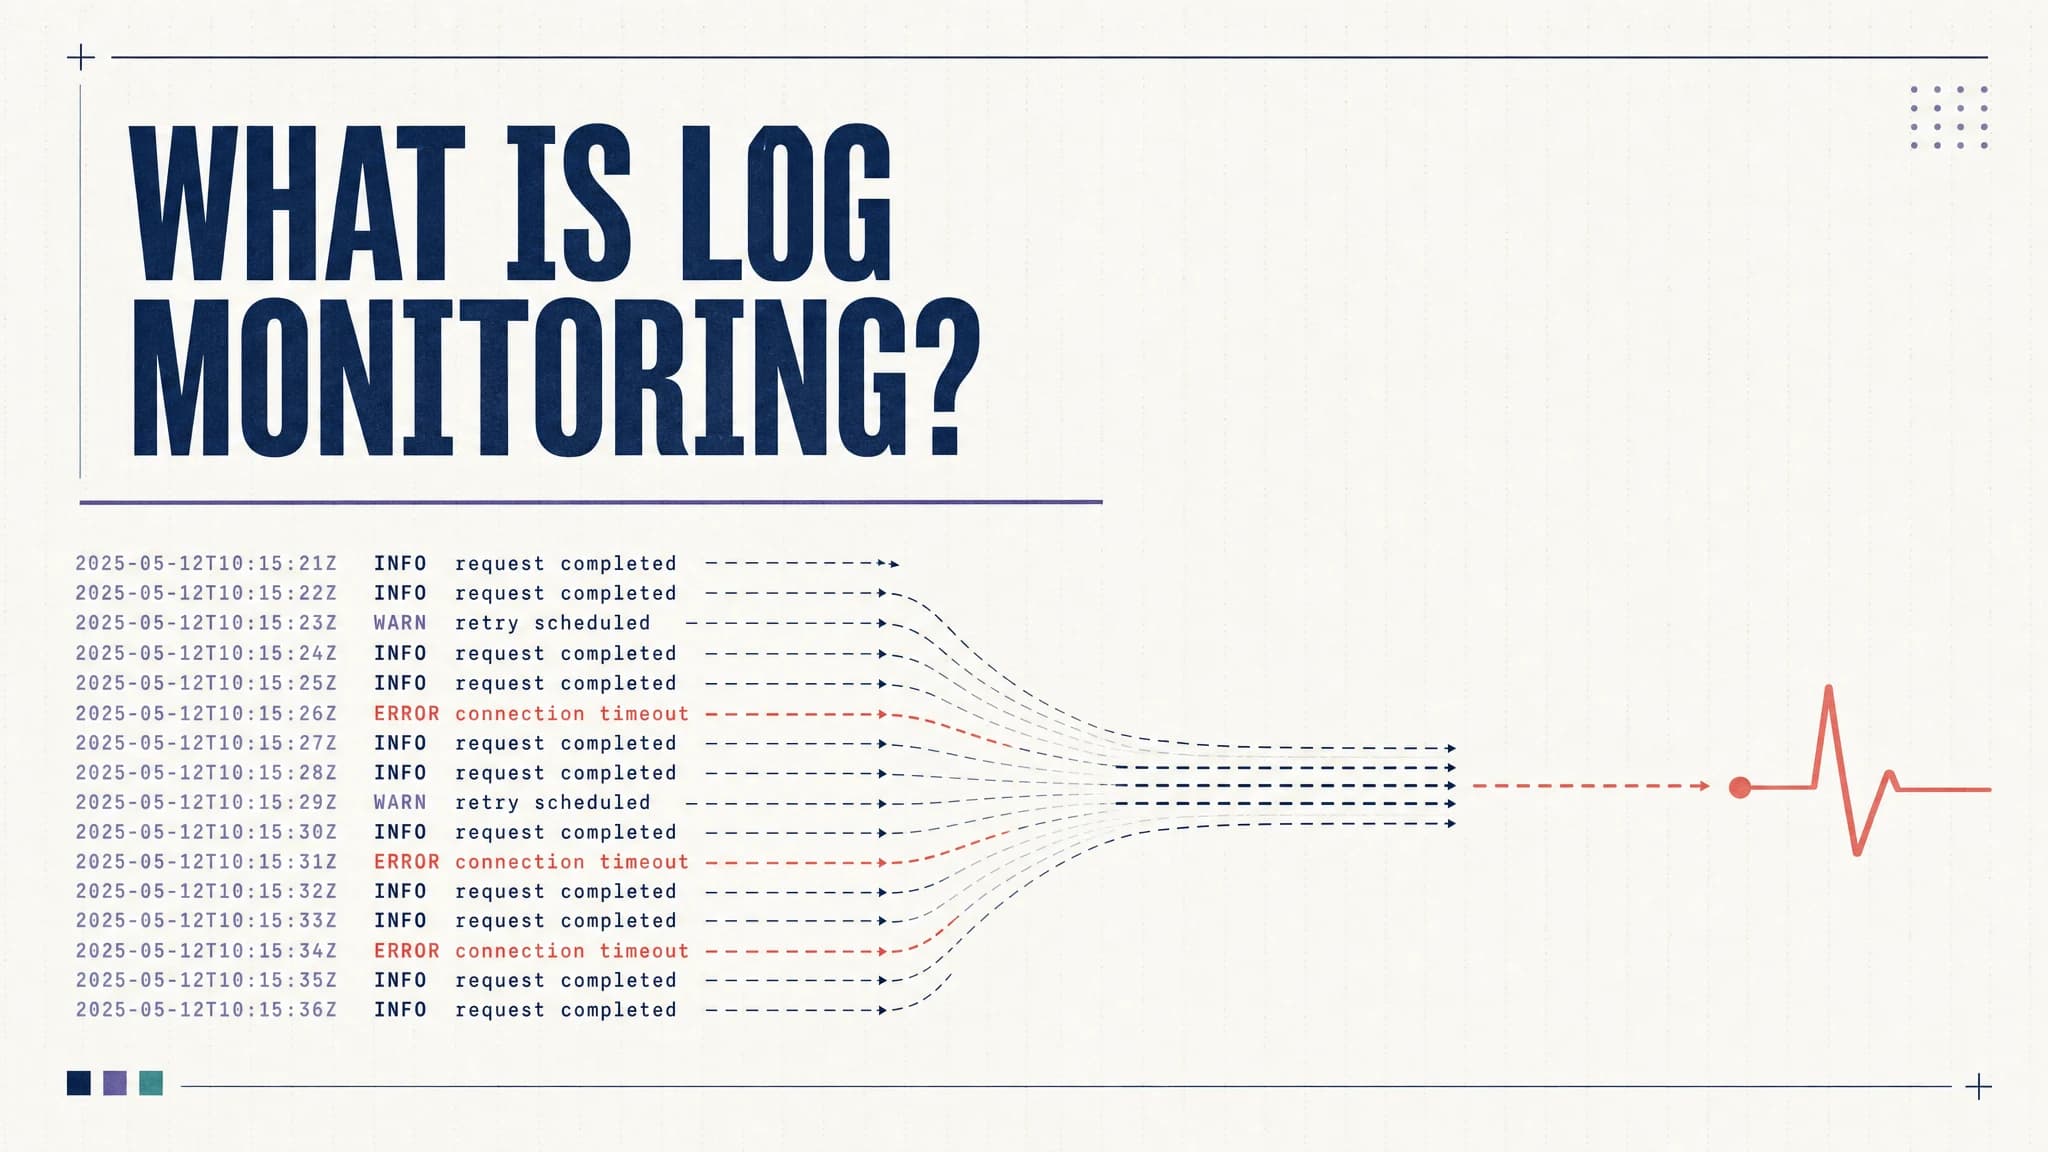
Log monitoring is the continuous collection and review of log events so teams can detect failures, investigate incidents and respond while a system is running. It turns logs from scattered files into searchable operational data with dashboards and alerts.
For a single server, monitoring may mean following one file. Once an application spans containers, services, databases and cloud infrastructure, engineers need one place to search the same time window and correlate events by service, request, or trace.
What is log monitoring?
Log monitoring is the process of collecting logs from applications and infrastructure, converting them into consistent fields, storing them centrally and evaluating them for conditions that need attention.
A useful log record identifies when an event happened, where it came from, its severity and what occurred. Application logs often add fields such as service.name, environment, request_id, trace_id, HTTP status, or customer-safe business context. The OpenTelemetry Logs Data Model defines common fields for timestamps, severity, resource identity, trace context, attributes and the event body.
Rules and queries turn this data into useful signals. A team can receive an alert when checkout errors cross a threshold, find every event for one request, or see that a server began rejecting connections after a deployment.
Logging vs monitoring: what is the difference?
Logging records individual events produced by an application or system. Monitoring evaluates signals such as logs, metrics, traces and health checks to detect conditions that need attention. Log monitoring is the overlap: it continuously evaluates log events for failures, security signals and operational changes.
| Practice | Primary job | Typical question |
|---|---|---|
| Logging | Create event records in an application or system | What should this service record? |
| Monitoring | Evaluate system signals and detect conditions that need action | Does the system need attention? |
| Log monitoring | Watch incoming events and alert on meaningful conditions | Is something failing now? |
| Log analysis | Query and correlate events during an investigation | Why did this request fail? |
| Log management | Govern collection, access, retention, archiving and deletion | How should we control logs throughout their lifecycle? |
Log monitoring handles live detection from event data. Log analysis supports investigation, while log management covers the complete lifecycle. Most production platforms support all three, but the distinction helps teams choose the right tool for each job.
How does log monitoring work?
A production log monitoring system has five stages. Some stacks combine several stages in one product, while larger systems separate them for scale or control.
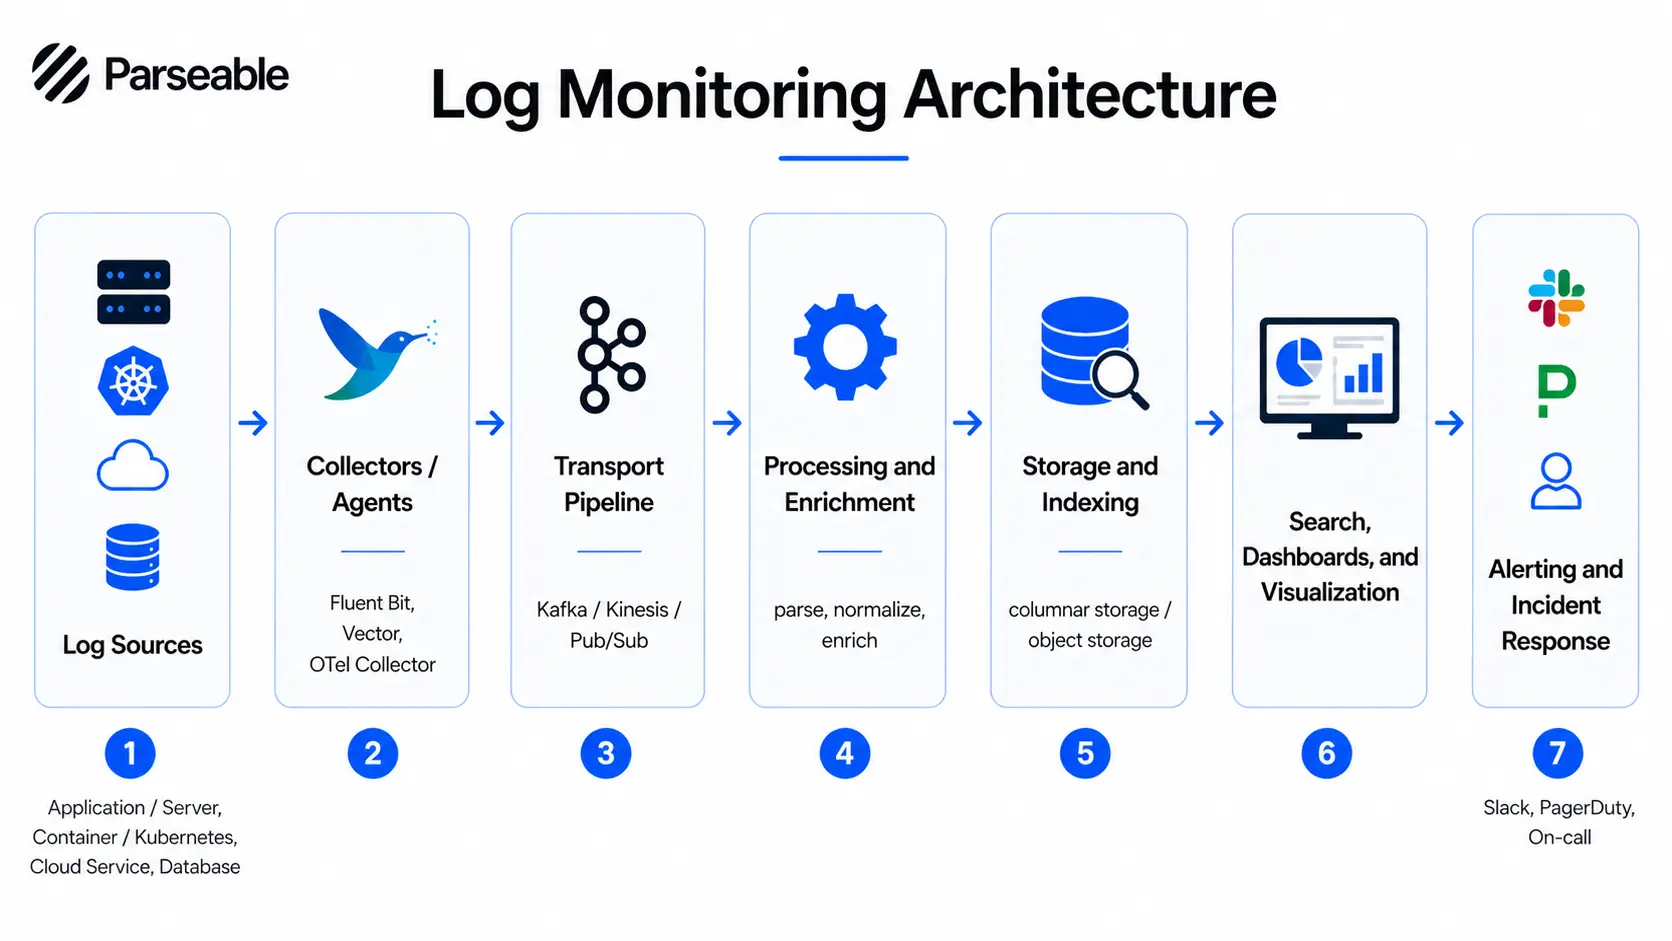
1. Generate useful events
Applications, operating systems, containers, databases, identity providers and cloud services emit logs. Structured events are easier to monitor than free-form strings because fields such as severity, service, request ID and duration remain queryable.
Each event needs enough context for the investigation or alert it supports. OWASP recommends consistent application logging and sufficient event information for subsequent monitoring and analysis in its Logging Cheat Sheet.
2. Collect and transport logs
Agents such as Fluent Bit, Vector and the OpenTelemetry Collector read files, container output, journald, or platform APIs. They add resource metadata and forward events to a central destination.
Collectors can send data directly to the backend. High-volume or failure-sensitive pipelines may add Kafka, Pub/Sub, or another durable buffer between collection and storage. A buffer is an architectural choice, not a requirement for every deployment.
3. Parse, normalize and protect the data
Processing converts raw text into fields, aligns inconsistent names, enriches events with service or environment metadata and removes sensitive values. For example, one source may emit level=error while another uses severity=ERROR; normalization gives queries one stable field.
Redact credentials, tokens and personal data before central storage. Filtering low-value events at this stage can reduce downstream cost without discarding signals needed for incident response.
4. Store and search centrally
Central storage gives engineers one query surface across ephemeral containers and distributed services. The backend must support the required retention period and return results quickly enough for active incidents.
Storage design affects cost. Index-heavy systems can provide fast search but create large indexing overhead. Object-storage and columnar designs keep more data in open formats and read only relevant columns or partitions when a query runs. The right trade-off depends on query frequency, retention and operational constraints.
5. Build dashboards and alerts
Dashboards summarize recurring signals such as errors by service, authentication failures, slow endpoints, or dropped events. Alerts evaluate incoming data and notify the right team when a sustained condition crosses an actionable threshold.
Every alert should give the responder somewhere useful to start. Include the affected service, environment, time window and a link to filtered logs. Paging on every ERROR line creates noise because applications often retry or recover without affecting users.
Which logs should you monitor?
Start with sources tied to user impact, security and critical dependencies. Connecting every available source before defining a purpose increases volume without improving visibility.
| Log source | Useful signals | Example monitoring condition |
|---|---|---|
| Application logs | Exceptions, business events, request outcomes | Checkout failures exceed the normal rate |
| Server and system logs | Service restarts, disk errors, memory pressure | A system service repeatedly exits |
| Kubernetes logs | Pod crashes, scheduling failures, control-plane events | CrashLoopBackOff appears after a deployment |
| Database logs | Slow queries, deadlocks, failed connections | Query duration exceeds the service objective |
| Cloud and network logs | Load balancer responses, flow logs, IAM activity | Denied requests spike from one source |
| Security and audit logs | Authentication, authorization, privilege changes | Repeated failures precede a successful login |
Start with application log monitoring when user-facing failures are the priority. Infrastructure logs may show that a container restarted; the application event can identify the request, operation and error that caused it.
A practical application log monitoring example
Suppose a checkout service begins returning HTTP 500 responses after a deployment.
- A monitor detects that the five-minute error ratio has crossed its threshold.
- The alert identifies
service.name=checkout,environment=productionand the affected deployment version. - An engineer opens the matching log view and groups errors by
event.nameor exception type. - A
trace_idconnects one failed event to the request path through the payment and inventory services. - Comparing the current and previous versions isolates the regression.
This workflow depends on stable fields. If each service writes a different timestamp, severity, or request identifier, central storage alone cannot provide reliable correlation.
Why monitor logs?
Detect incidents sooner
Rules and anomaly monitors can surface rising error rates, missing heartbeats, rejected requests, or suspicious access patterns before a customer reports the problem. Alerts shorten detection time only when they represent conditions that require action.
Investigate distributed systems
Containers disappear and requests cross service boundaries. Centralized logs preserve the event history and let engineers filter by service, host, deployment, request ID, or trace ID without connecting to individual machines.
Support security and audit work
Authentication, authorization and administrative events help teams detect misuse and reconstruct a timeline. NIST describes log management as supporting incident investigation, operational issue detection and required record retention in its cybersecurity log management guidance.
Understand performance problems
Application and database logs can expose slow operations, retries, timeouts and dependency errors. Metrics show the size of a latency increase; logs provide the event-level context behind it.
Common log monitoring failures
Collecting data without a monitoring goal
More data does not guarantee better detection. Before ingesting a source, define the failure, security, or compliance question it should answer. That decision also determines the fields and retention period it needs.
Inconsistent schemas
Correlation breaks when services use different names or types for the same concept. Adopt a small shared schema for timestamp, severity, service, environment, event name, request ID and trace context. Preserve source-specific details as attributes.
Excessive alert noise
Individual events rarely justify paging someone. Alert on sustained rates, missing expected events, or patterns associated with user impact. Group related notifications and route them to the team that owns the service.
Uncontrolled volume and retention
Debug events, health checks and repetitive success messages can dominate storage. Filter or sample low-value events, retain each dataset according to its operational or compliance value and measure ingestion before volume becomes a budget problem.
Missing pipeline health
A silent collector failure creates a false sense that the system is healthy. Monitor the monitoring pipeline itself: ingestion latency, rejected events, parsing failures, queue depth, collector health and the time of the last event from critical sources.
How to set up log monitoring
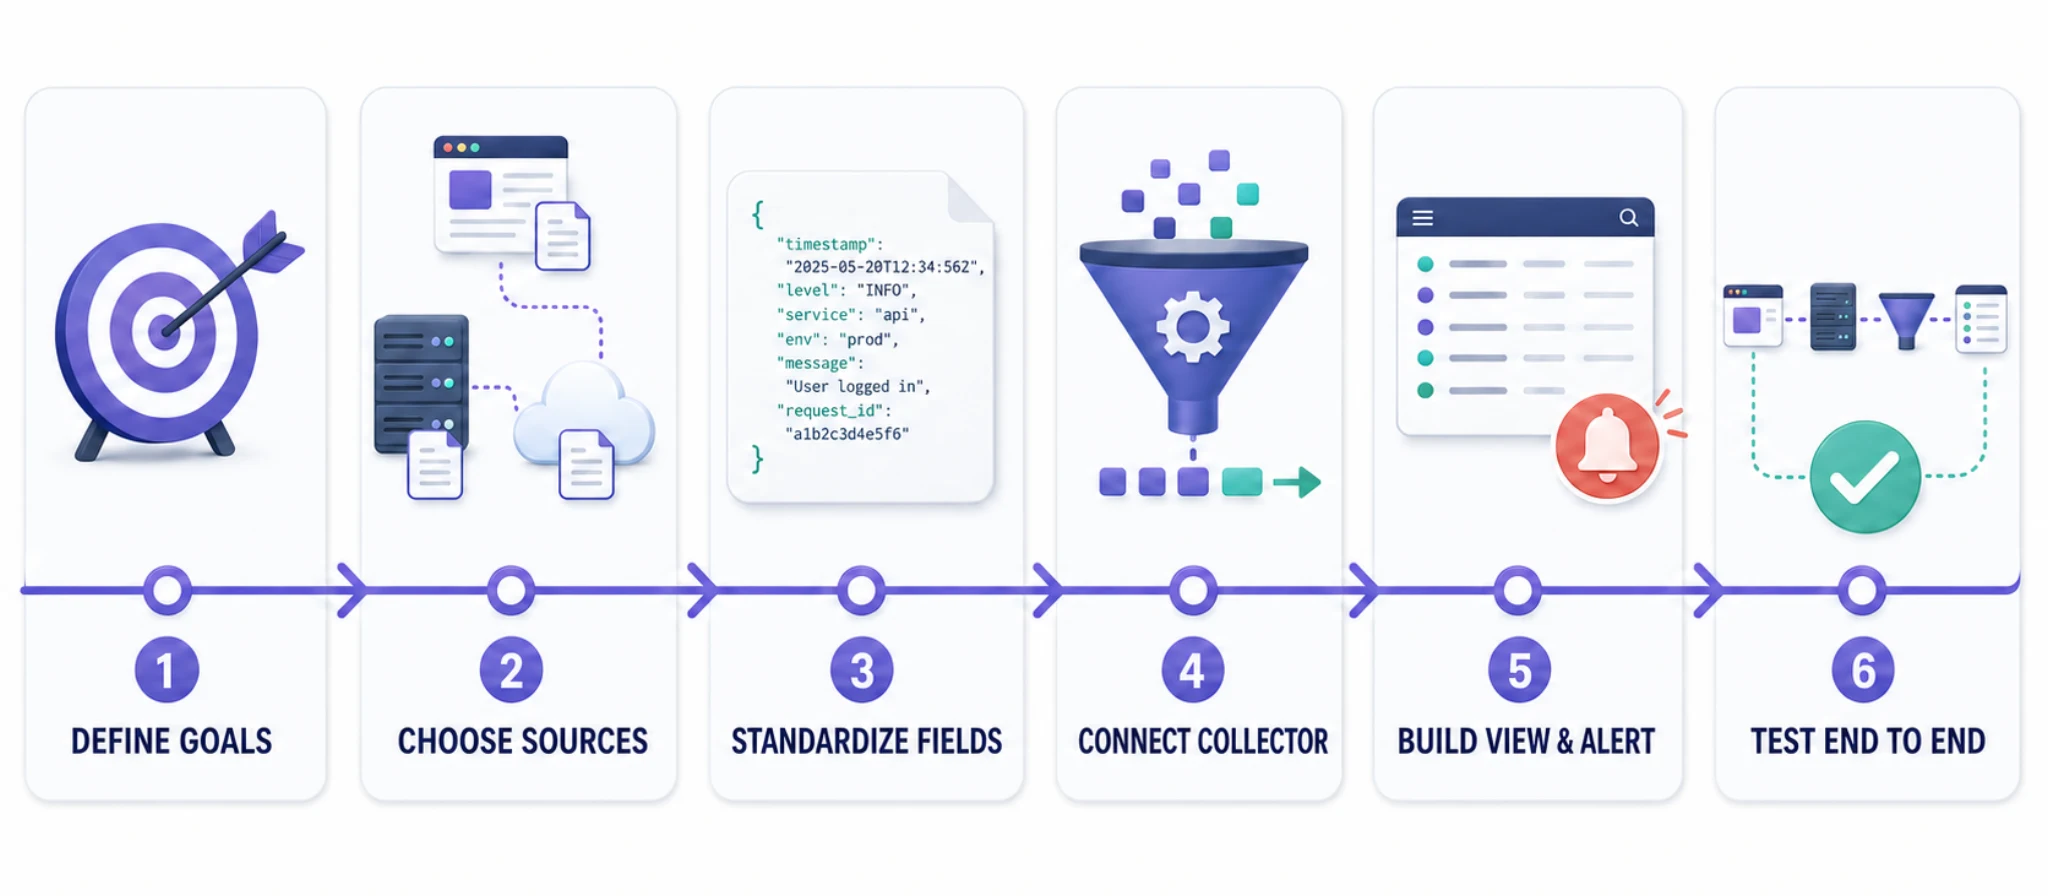
1. Define the questions and owners
List the incidents you need to detect and name the responder for each one. Examples include a rising payment failure rate, repeated database authentication failures, or missing events from a critical worker.
2. Choose the first log sources
Start with one user-facing application and its critical dependencies. List the application, server, container, database and cloud logs needed to investigate its failures.
3. Standardize important fields
Use structured logs where you control the source. Include consistent service identity, environment, severity, event name, request ID and trace context. Keep secrets and unnecessary personal data out of events.
4. Connect a collector and central backend
Deploy an agent or collector close to each source, add the required resource metadata and route events to central storage. Parse and redact before storage when possible.
5. Build one investigation view and one alert
Create a dashboard or saved query for the selected service, then add one alert tied to an actionable condition. Include links and context that help the responder begin the investigation.
6. Test the entire path
Trigger a known event and verify generation, collection, parsing, storage, search, alert delivery, ownership and recovery. Repeat the test after collector, schema, or routing changes.
For implementation details such as severity, correlation, redaction, sampling and retention, use the dedicated logging best practices guide. If you are still choosing the pipeline, compare log aggregation tools separately from broader log management tools.
What should a log monitoring platform provide?
Evaluate a platform against the workflow your team will operate:
- Reliable ingestion: Standard collectors, backpressure handling, retries and visibility into rejected events.
- Fast investigation: Field filters, full-text search, aggregation, saved queries and usable performance over the required time range.
- Actionable alerts: Thresholds, grouping, routing, suppression and direct links to evidence.
- Context: Service and deployment metadata plus correlation with trace IDs and other telemetry.
- Storage control: Clear retention, predictable cost, access controls and suitable deployment options.
- Open interfaces: Support for standards such as OpenTelemetry and portable data formats where possible.
If you need to evaluate products rather than design the workflow, see the best logging tools comparison.
Log monitoring with Parseable
Parseable receives logs through standard collectors and HTTP ingestion, then provides centralized search, SQL queries, dashboards and alerts. Teams can deploy it themselves or use a managed offering, while object storage and Parquet provide the storage layer.
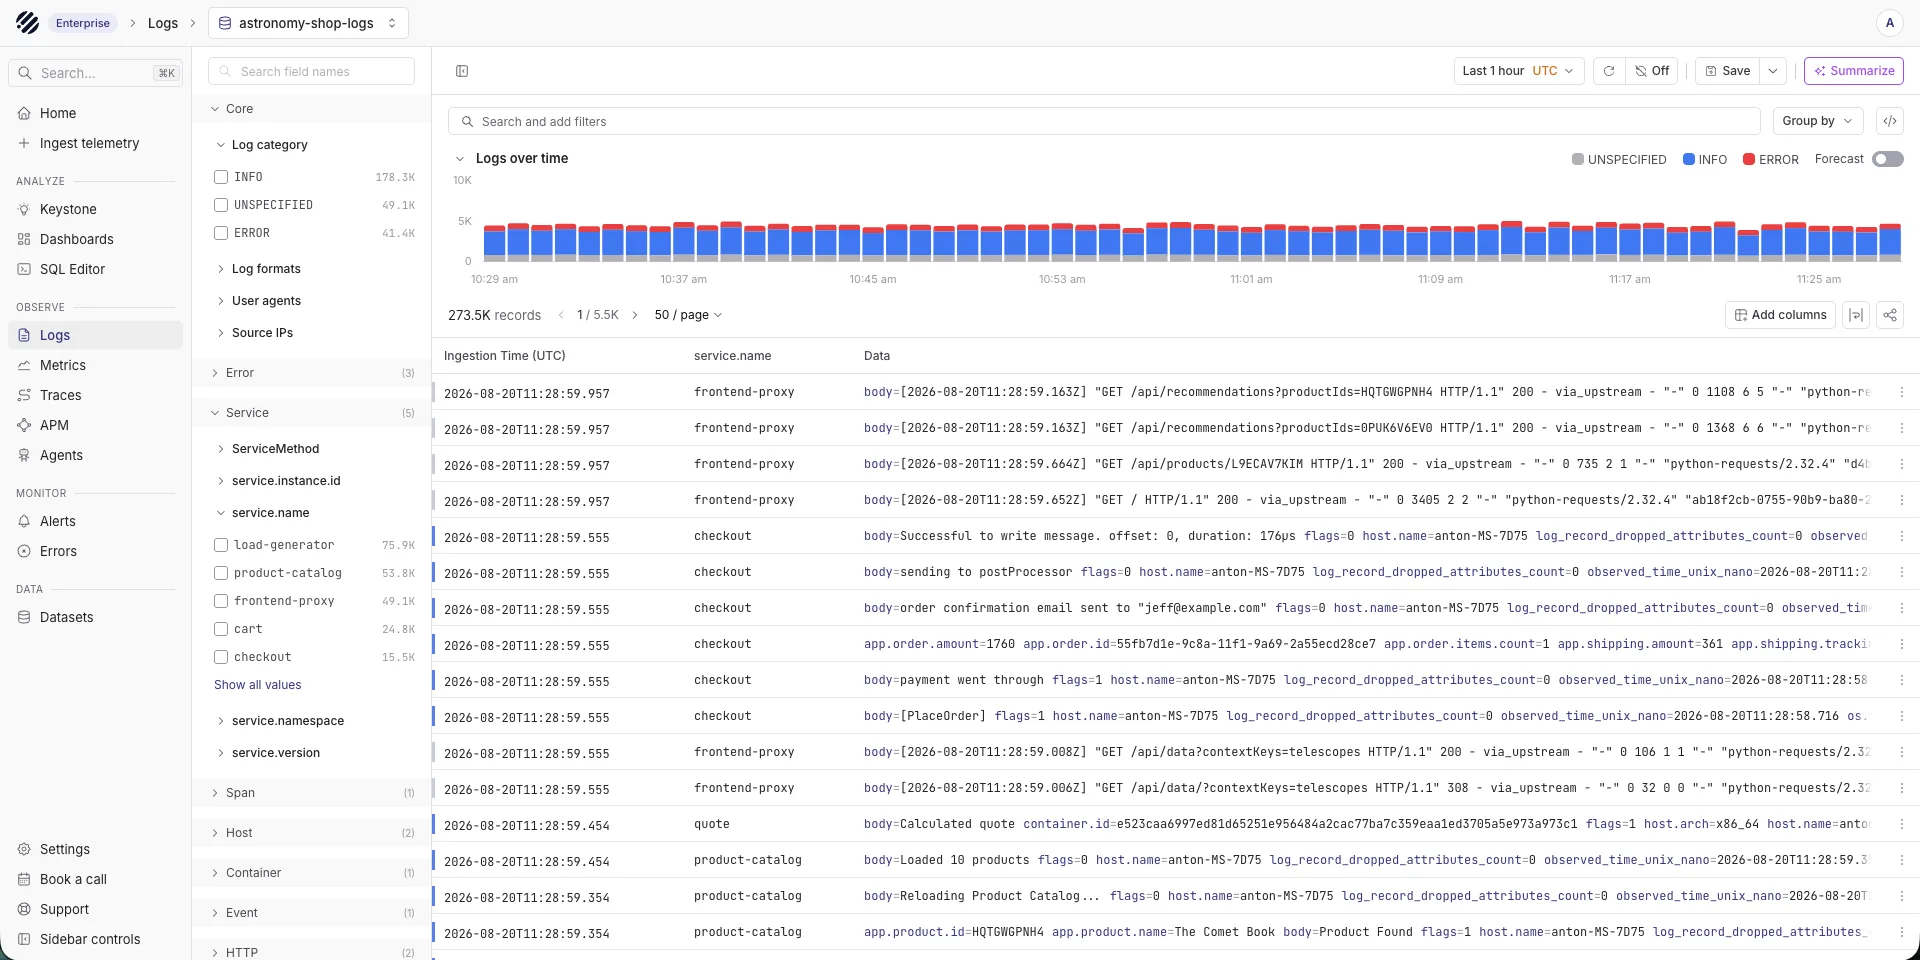
A typical setup sends application or server logs through Fluent Bit, Vector, or the OpenTelemetry Collector. In Parseable, an engineer can filter and aggregate those events by service, environment, severity, or trace context from one interface.
See the Log Monitoring solution for the product workflow or follow the ingestion documentation to connect a source.