
MongoDB
Send MongoDB logs, metrics, and traces to Parseable with OpenTelemetry
MongoDB is usually only one part of a larger service path. Parseable helps you bring the database logs, database metrics, and application traces for MongoDB-backed workloads into one place. The reference setup below uses a three-member replica set, one Percona MongoDB exporter per member, an OpenTelemetry Collector, and a continuously running client workload.
What the integration collects
| Signal | Source | Parseable dataset |
|---|---|---|
| Logs | mongod logs from every replica-set member | mongodb-logs |
| Metrics | OpenTelemetry MongoDB receiver and Percona MongoDB exporter | mongodb-metrics |
| Traces | Instrumented MongoDB client spans | mongodb-traces |
MongoDB server telemetry provides logs and metrics. Distributed traces come from the applications or workloads that execute MongoDB operations.
Prerequisites
- MongoDB 6.0 or later
- OpenTelemetry Collector Contrib
- Percona MongoDB Exporter for extended Prometheus metrics
- A Parseable ingestor endpoint and API key
Configure MongoDB
Create a monitoring user in the admin database:
use admin

db.createUser({
  user: "otel",
  pwd: "replace-me",
  roles: [
    { role: "clusterMonitor", db: "admin" },
    { role: "read", db: "local" }
  ]
})
For a replica set, start every member with the same replica-set name and a persistent log path:
mongod \
  --replSet rs0 \
  --bind_ip_all \
  --logpath /data/db/mongod.log \
  --logappend \
  --profile 1 \
  --slowms 50
Initiate the replica set once:
rs.initiate({
  _id: "rs0",
  members: [
    { _id: 0, host: "mongo1:27017", priority: 2 },
    { _id: 1, host: "mongo2:27017", priority: 1 },
    { _id: 2, host: "mongo3:27017", priority: 1 }
  ]
})
Run an exporter for each member. Direct connections preserve member-level replication and storage metrics:
mongo-exporter1:
  image: percona/mongodb_exporter:0.51.0
  environment:
    MONGODB_URI: >-
      mongodb://otel:${MONGODB_PASSWORD}@mongo1:27017/admin
      ?authSource=admin&directConnection=true
  command:
    - --mongodb.direct-connect
    - --compatible-mode
    - --discovering-mode
    - --collector.diagnosticdata
    - --collector.replicasetstatus
    - --collector.dbstats
    - --collector.topmetrics
    - --collector.indexstats
    - --collector.collstats
Collector configuration
Mount each MongoDB data volume read-only into the Collector and create otel-collector.yaml. The exporter examples expect PARSEABLE_ENDPOINT and PARSEABLE_API_KEY to be set in the Collector environment:
receivers:
  otlp:
    protocols:
      grpc:
        endpoint: 0.0.0.0:4317
      http:
        endpoint: 0.0.0.0:4318

  filelog/mongodb:
    include:
      - /mongo/mongo1/mongod.log
      - /mongo/mongo2/mongod.log
      - /mongo/mongo3/mongod.log
    start_at: end
    include_file_name: true
    include_file_path: true
    operators:
      - type: move
        from: body
        to: attributes["mongodb.raw"]
      - type: add
        field: body
        value: MongoDB structured log

  mongodb:
    hosts:
      - endpoint: mongo1:27017
      - endpoint: mongo2:27017
      - endpoint: mongo3:27017
    username: otel
    password: ${env:MONGODB_PASSWORD}
    replica_set: rs0
    collection_interval: 15s
    initial_delay: 1s
    timeout: 10s
    tls:
      insecure: true

  prometheus/mongodb_exporter:
    config:
      scrape_configs:
        - job_name: mongodb
          scrape_interval: 15s
          static_configs:
            - targets:
                - mongo-exporter1:9216
                - mongo-exporter2:9216
                - mongo-exporter3:9216

processors:
  memory_limiter:
    check_interval: 1s
    limit_mib: 512
    spike_limit_mib: 128
  resource/mongodb:
    attributes:
      - key: service.name
        value: mongodb
        action: upsert
      - key: deployment.environment.name
        value: production
        action: upsert
  batch:
    timeout: 1s

exporters:
  otlphttp/parseable_logs:
    endpoint: ${env:PARSEABLE_ENDPOINT}
    encoding: json
    headers:
      X-API-Key: "${env:PARSEABLE_API_KEY}"
      X-P-Stream: mongodb-logs
      X-P-Log-Source: otel-logs
      Content-Type: application/json
    retry_on_failure:
      enabled: true
      max_elapsed_time: 0s

  otlphttp/parseable_metrics:
    endpoint: ${env:PARSEABLE_ENDPOINT}
    encoding: json
    headers:
      X-API-Key: "${env:PARSEABLE_API_KEY}"
      X-P-Stream: mongodb-metrics
      X-P-Log-Source: otel-metrics
      Content-Type: application/json
    retry_on_failure:
      enabled: true
      max_elapsed_time: 0s

  otlphttp/parseable_traces:
    endpoint: ${env:PARSEABLE_ENDPOINT}
    encoding: json
    headers:
      X-API-Key: "${env:PARSEABLE_API_KEY}"
      X-P-Stream: mongodb-traces
      X-P-Log-Source: otel-traces
      Content-Type: application/json
    retry_on_failure:
      enabled: true
      max_elapsed_time: 0s

service:
  pipelines:
    logs:
      receivers: [filelog/mongodb]
      processors: [memory_limiter, resource/mongodb, batch]
      exporters: [otlphttp/parseable_logs]
    metrics:
      receivers: [mongodb, prometheus/mongodb_exporter]
      processors: [memory_limiter, resource/mongodb, batch]
      exporters: [otlphttp/parseable_metrics]
    traces:
      receivers: [otlp]
      processors: [memory_limiter, batch]
      exporters: [otlphttp/parseable_traces]
The filelog operators retain the original structured log under mongodb.raw while keeping the OTLP body type stable. This avoids schema conflicts when different MongoDB log records have different nested shapes.
Generate representative activity
The reference workload creates customers, products, inventory, orders, events, a time-series measurements collection, and a churn collection. It then exercises transactions, inserts, updates, aggregation pipelines, lookups, index access, collection scans, TTL deletion, and intentional duplicate-key failures.
const d = db.getSiblingDB("telemetry")

d.orders.insertOne({
  customerId: 42,
  status: "paid",
  total: 99.95,
  items: [{ productId: 7, quantity: 1 }],
  createdAt: new Date()
})

d.orders.aggregate([
  { $match: { createdAt: { $gte: new Date(Date.now() - 3600000) } } },
  { $unwind: "$items" },
  { $lookup: {
      from: "products",
      localField: "items.productId",
      foreignField: "_id",
      as: "product"
  } },
  { $group: { _id: "$status", orders: { $sum: 1 }, revenue: { $sum: "$total" } } }
]).toArray()
Instrument the MongoDB client and send spans to the Collector's OTLP HTTP endpoint. Recommended attributes include db.system.name=mongodb, db.namespace, db.collection.name, db.operation.name, server.address, and server.port.
Verify ingestion
SELECT count(*) FROM "mongodb-logs"
WHERE p_timestamp > NOW() - INTERVAL '10 minutes';
SELECT metric_name, count(*)
FROM "mongodb-metrics"
WHERE p_timestamp > NOW() - INTERVAL '10 minutes'
GROUP BY metric_name
ORDER BY metric_name;SELECT span_name, count(*)
FROM "mongodb-traces"
WHERE p_timestamp > NOW() - INTERVAL '10 minutes'
GROUP BY span_name;Use the resulting metrics for connections, operation rates, memory, WiredTiger cache, locks, cursors, collection/index sizes, replication state, and replica lag.
View in Parseable
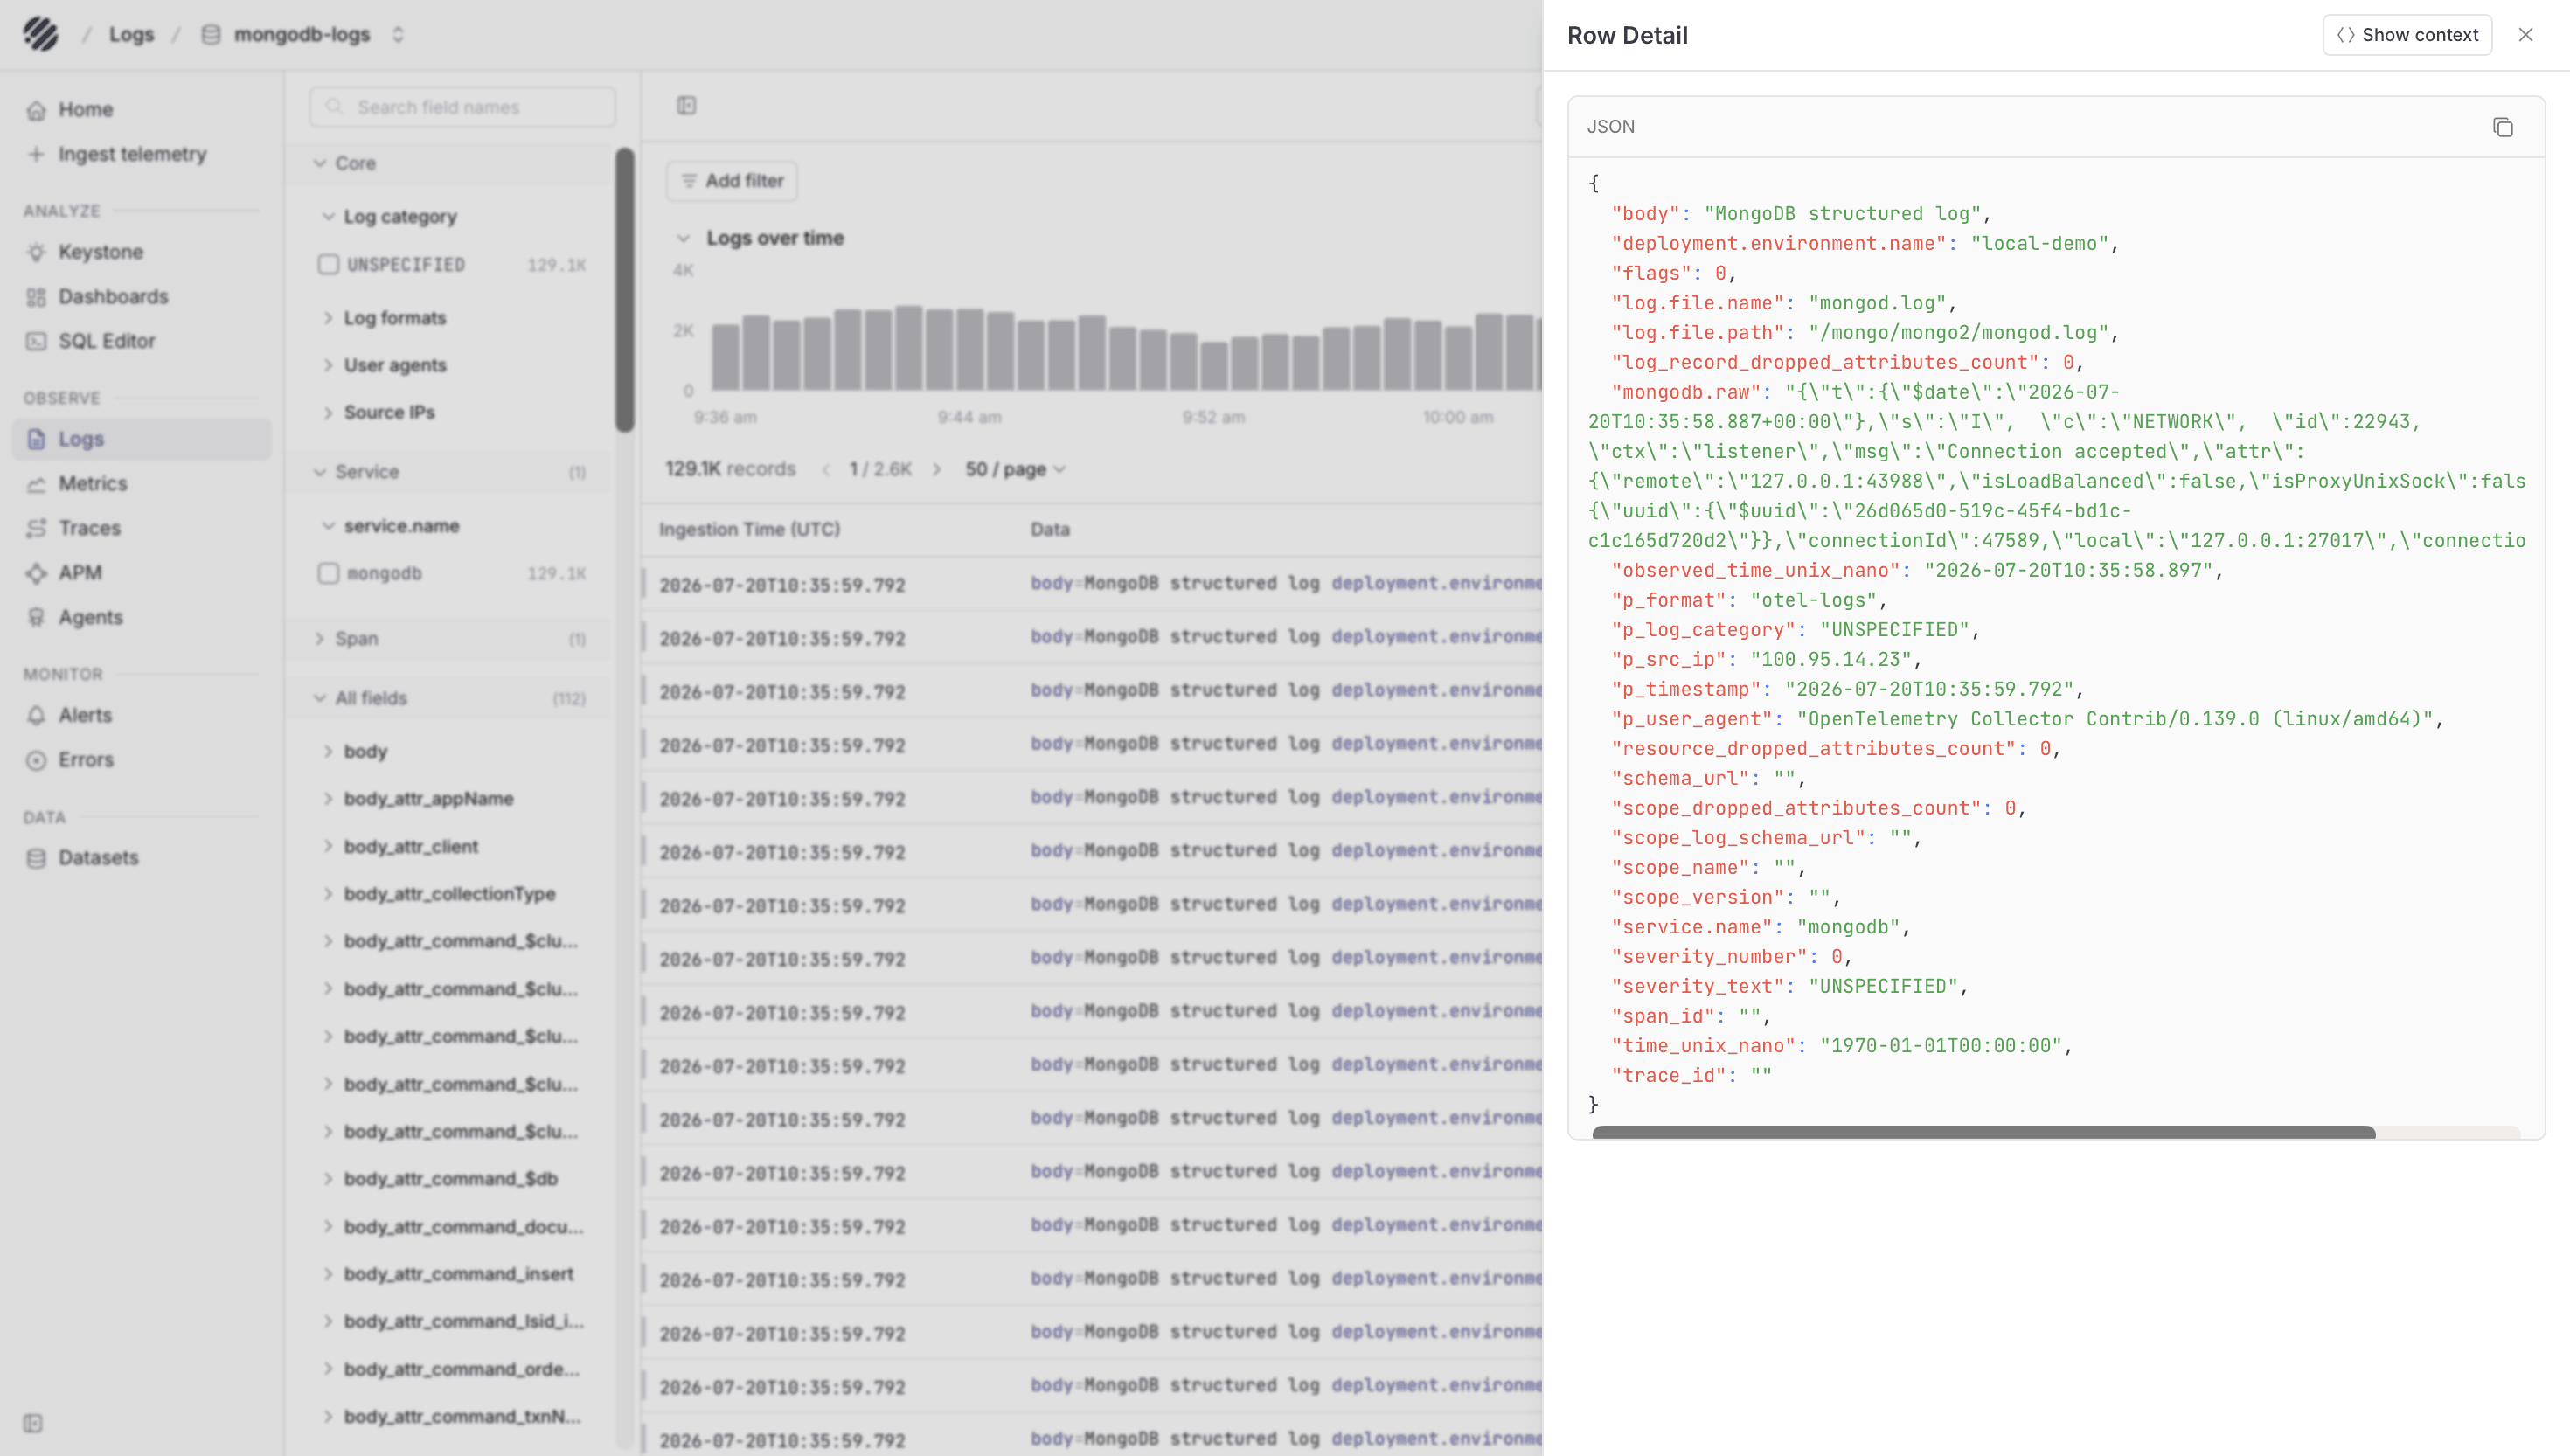
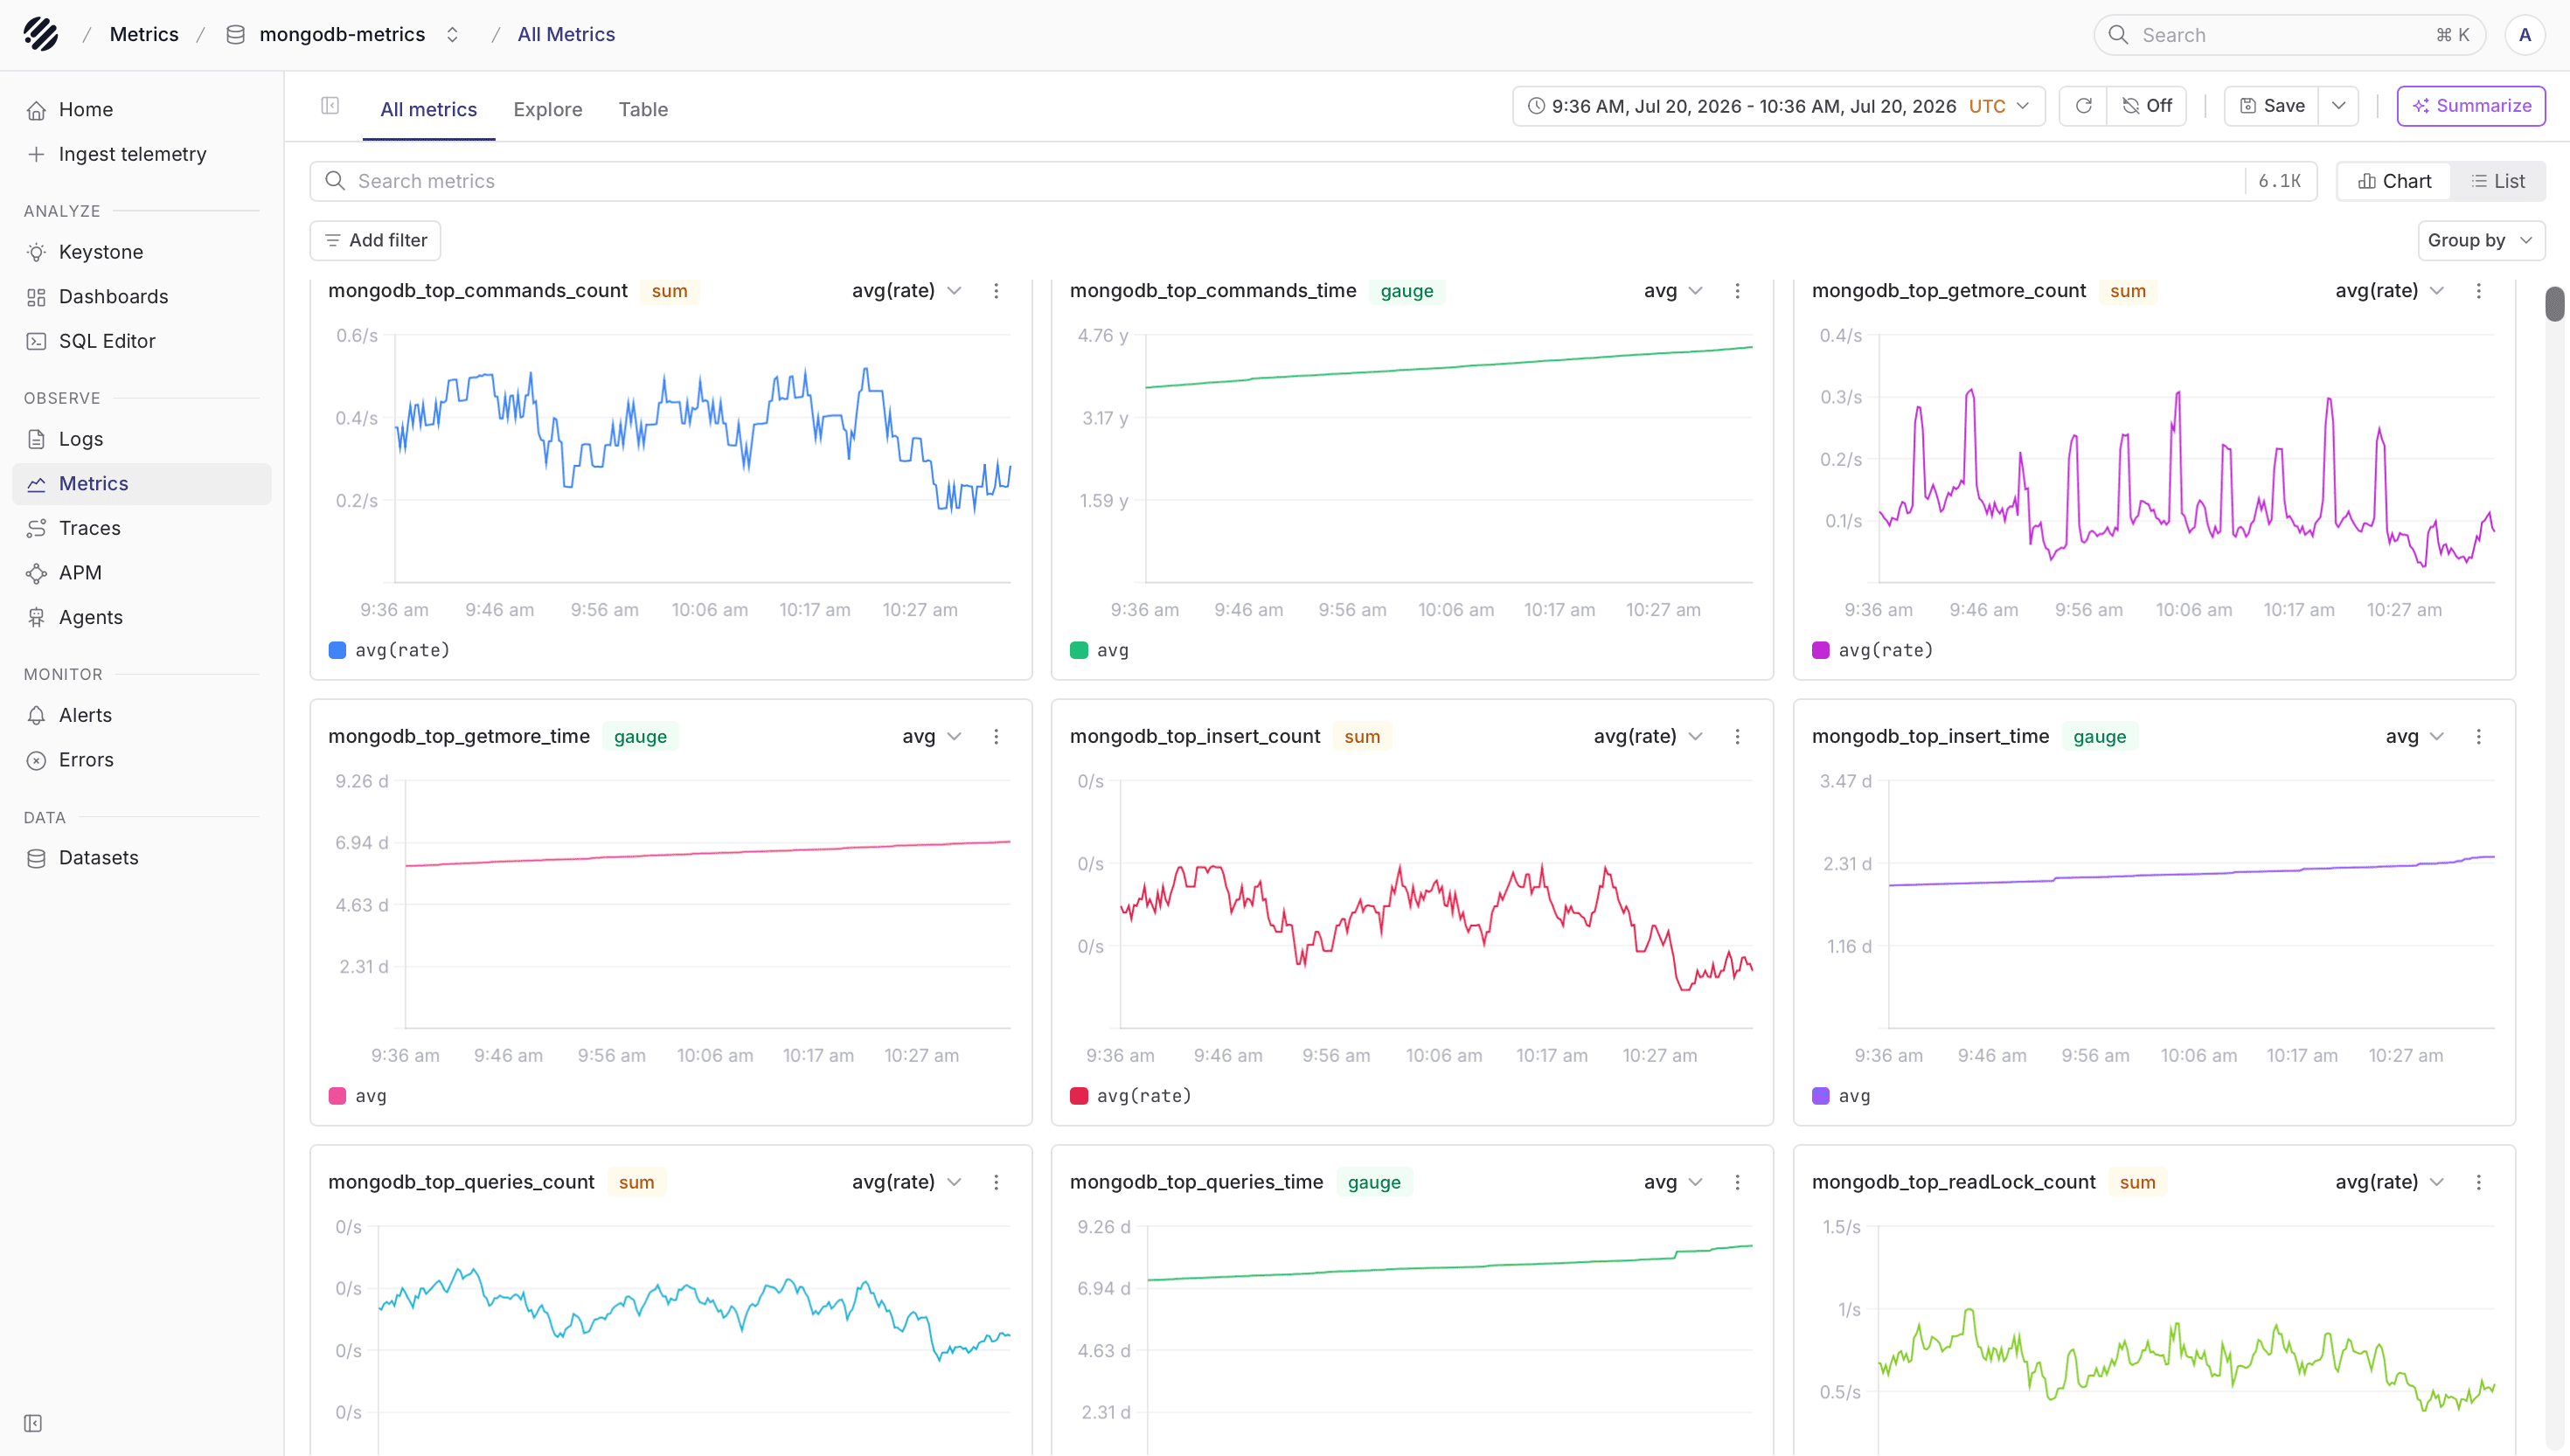
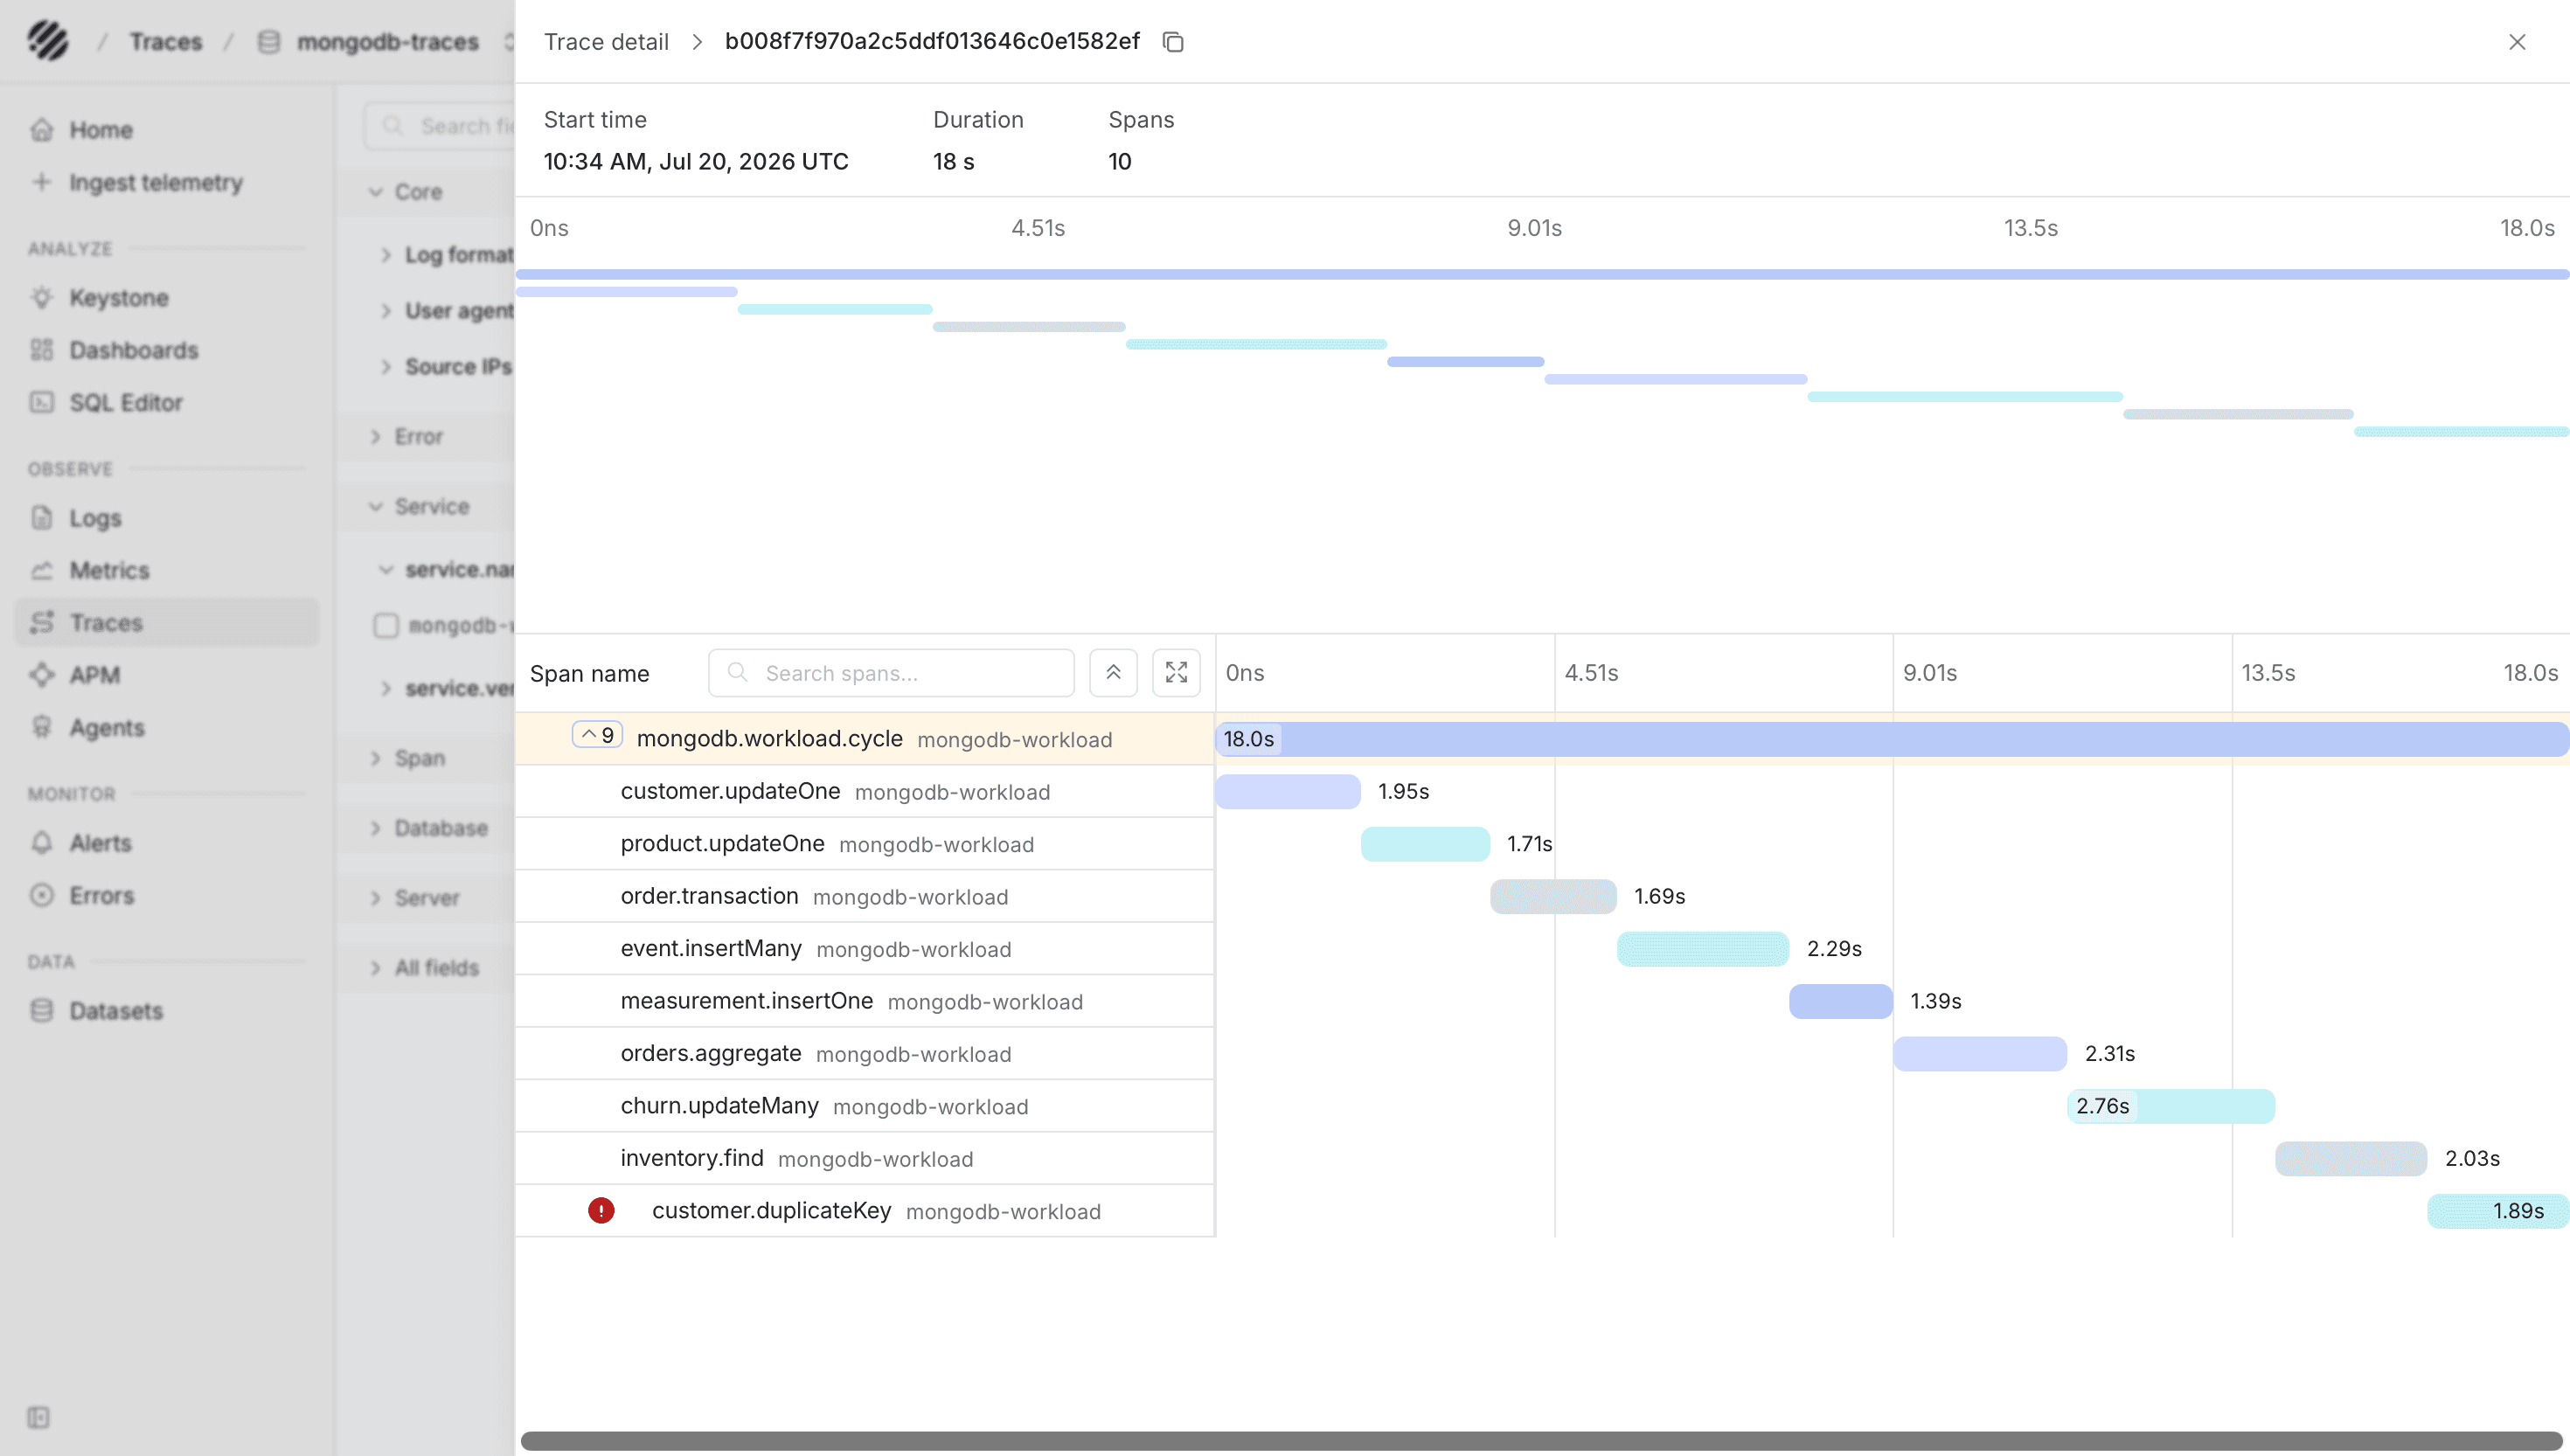
Once the Collector starts exporting, the three datasets appear separately in Parseable. The logs dataset helps you inspect MongoDB server events, the metrics dataset shows replica-set and exporter metrics, and the traces dataset shows the client-side database spans produced by your application workload.
Dashboards
Public Parseable dashboard templates are available in parseablehq/dashboards. Choose a MongoDB template and update its dataset variables if necessary.
Exporter versions can change metric names. Use the template version that matches your Percona exporter, or translate the queries using the metric_name values present in mongodb-metrics.
Troubleshooting
- Verify the monitoring account has
clusterMonitorand access to thelocaldatabase. - Verify
rs.status()is healthy before starting the exporters. - Verify every exporter endpoint returns metrics on port
9216. - Verify the Collector can read every
mongod.logvolume. - An HTTP
405from Parseable normally means the exporter is pointed at a query/UI endpoint rather than the ingestor.
Was this page helpful?