
PostgreSQL
Send PostgreSQL logs, metrics, and traces to Parseable with OpenTelemetry
PostgreSQL issues are easier to understand when query activity, database health, and application spans sit next to each other. This guide shows how to send PostgreSQL logs, metrics, and traces to Parseable using a primary and replica, pg_stat_statements, pg_exporter, an OpenTelemetry Collector, and a continuously running SQL workload.
What the integration collects
| Signal | Source | Parseable dataset |
|---|---|---|
| Logs | PostgreSQL JSON logs from the primary and replicas | postgres-logs |
| Metrics | OpenTelemetry PostgreSQL receiver and pg_exporter | postgres-metrics |
| Traces | Instrumented database client spans | postgres-traces |
The native receiver covers database and table health. pg_exporter adds the statement, WAL, replication, vacuum, lock, index, and I/O families commonly used by PostgreSQL dashboards.
PostgreSQL does not create distributed traces for SQL clients. Instrument the application or workload that issues SQL and send its spans to the Collector's OTLP receiver.
Prerequisites
- A supported PostgreSQL release
- OpenTelemetry Collector Contrib
pg_exporterfor dashboard-compatible metrics- A Parseable ingestor endpoint and API key
Configure PostgreSQL
Enable statement statistics, I/O timing, replication data, and JSON logs:
shared_preload_libraries = 'pg_stat_statements'
pg_stat_statements.track = all
track_io_timing = on
wal_level = replica
max_wal_senders = 10
logging_collector = on
log_destination = 'jsonlog'
log_directory = 'log'
log_filename = 'postgresql-%Y-%m-%d_%H%M%S.json'
log_connections = on
log_disconnections = on
log_checkpoints = on
log_lock_waits = on
Create the extension and a least-privilege exporter account:
CREATE EXTENSION IF NOT EXISTS pg_stat_statements;

CREATE ROLE postgres_exporter
  LOGIN NOSUPERUSER NOCREATEDB NOCREATEROLE NOREPLICATION
  PASSWORD 'replace-me';

GRANT pg_monitor TO postgres_exporter;
GRANT CONNECT ON DATABASE telemetry TO postgres_exporter;
Start pg_exporter with the collectors required by your dashboards:
pg-exporter:
  image: ghcr.io/nbari/pg_exporter:0.17.2
  environment:
    PG_EXPORTER_DSN: >-
      postgresql://postgres_exporter:${POSTGRES_EXPORTER_PASSWORD}
      @postgres:5432/telemetry?sslmode=disable
  command:
    - --collector.locks
    - --collector.database
    - --collector.stat
    - --collector.stat_io
    - --collector.replication
    - --collector.index
    - --collector.statements
    - --statements.top-n=50
Collector configuration
Mount the PostgreSQL data directories read-only into the Collector and create otel-collector.yaml. The exporter examples expect PARSEABLE_ENDPOINT and PARSEABLE_API_KEY to be set in the Collector environment:
receivers:
  otlp:
    protocols:
      grpc:
        endpoint: 0.0.0.0:4317
      http:
        endpoint: 0.0.0.0:4318

  filelog/postgresql:
    include:
      - /postgres/primary/log/*.json
      - /postgres/replica/log/*.json
    start_at: end
    include_file_name: true
    include_file_path: true

  postgresql:
    endpoint: postgres:5432
    transport: tcp
    username: postgres_exporter
    password: ${env:POSTGRES_EXPORTER_PASSWORD}
    databases: [telemetry]
    collection_interval: 10s
    tls:
      insecure: true

  prometheus/pg_exporter:
    config:
      scrape_configs:
        - job_name: postgresql
          scrape_interval: 15s
          static_configs:
            - targets: [pg-exporter:9432]

processors:
  memory_limiter:
    check_interval: 1s
    limit_mib: 512
    spike_limit_mib: 128
  resource/postgresql:
    attributes:
      - key: service.name
        value: postgresql
        action: upsert
      - key: deployment.environment.name
        value: production
        action: upsert
  batch:
    timeout: 1s

exporters:
  otlphttp/parseable_logs:
    endpoint: ${env:PARSEABLE_ENDPOINT}
    encoding: json
    headers:
      X-API-Key: "${env:PARSEABLE_API_KEY}"
      X-P-Stream: postgres-logs
      X-P-Log-Source: otel-logs
      Content-Type: application/json
    retry_on_failure:
      enabled: true
      max_elapsed_time: 0s

  otlphttp/parseable_metrics:
    endpoint: ${env:PARSEABLE_ENDPOINT}
    encoding: json
    headers:
      X-API-Key: "${env:PARSEABLE_API_KEY}"
      X-P-Stream: postgres-metrics
      X-P-Log-Source: otel-metrics
      Content-Type: application/json
    retry_on_failure:
      enabled: true
      max_elapsed_time: 0s

  otlphttp/parseable_traces:
    endpoint: ${env:PARSEABLE_ENDPOINT}
    encoding: json
    headers:
      X-API-Key: "${env:PARSEABLE_API_KEY}"
      X-P-Stream: postgres-traces
      X-P-Log-Source: otel-traces
      Content-Type: application/json
    retry_on_failure:
      enabled: true
      max_elapsed_time: 0s

service:
  pipelines:
    logs:
      receivers: [filelog/postgresql]
      processors: [memory_limiter, resource/postgresql, batch]
      exporters: [otlphttp/parseable_logs]
    metrics:
      receivers: [postgresql, prometheus/pg_exporter]
      processors: [memory_limiter, resource/postgresql, batch]
      exporters: [otlphttp/parseable_metrics]
    traces:
      receivers: [otlp]
      processors: [memory_limiter, batch]
      exporters: [otlphttp/parseable_traces]
For TLS-enabled PostgreSQL, replace tls.insecure: true with the appropriate CA and client certificate settings.
Generate representative activity
The reference workload creates customers, products, inventory, orders, order items, events, measurements, and churn tables. It continuously performs transactions, joins, aggregates, updates, deletes, lock contention, temporary-file sorts, and intentional constraint errors.
BEGIN;

INSERT INTO orders(customer_id, status, total, created_at)
VALUES (42, 'paid', 99.95, NOW());

UPDATE inventory
SET available = available - 1,
    reserved = reserved + 1
WHERE product_id = 7;

COMMIT;

SELECT status, count(*), sum(total)
FROM orders
WHERE created_at > NOW() - INTERVAL '1 hour'
GROUP BY status;
Instrument the client with OpenTelemetry. Database spans should include db.system.name=postgresql, db.namespace, db.operation.name, db.query.summary, server.address, and server.port. Avoid recording secrets or unredacted SQL parameters.
Verify ingestion
SELECT count(*) FROM "postgres-logs"
WHERE p_timestamp > NOW() - INTERVAL '10 minutes';
SELECT metric_name, count(*)
FROM "postgres-metrics"
WHERE p_timestamp > NOW() - INTERVAL '10 minutes'
GROUP BY metric_name
ORDER BY metric_name;SELECT span_name, count(*)
FROM "postgres-traces"
WHERE p_timestamp > NOW() - INTERVAL '10 minutes'
GROUP BY span_name;Use these signals to build panels for connections, query latency, cache hit ratio, locks, vacuum, WAL, replication lag, table activity, database size, and top statements.
View in Parseable
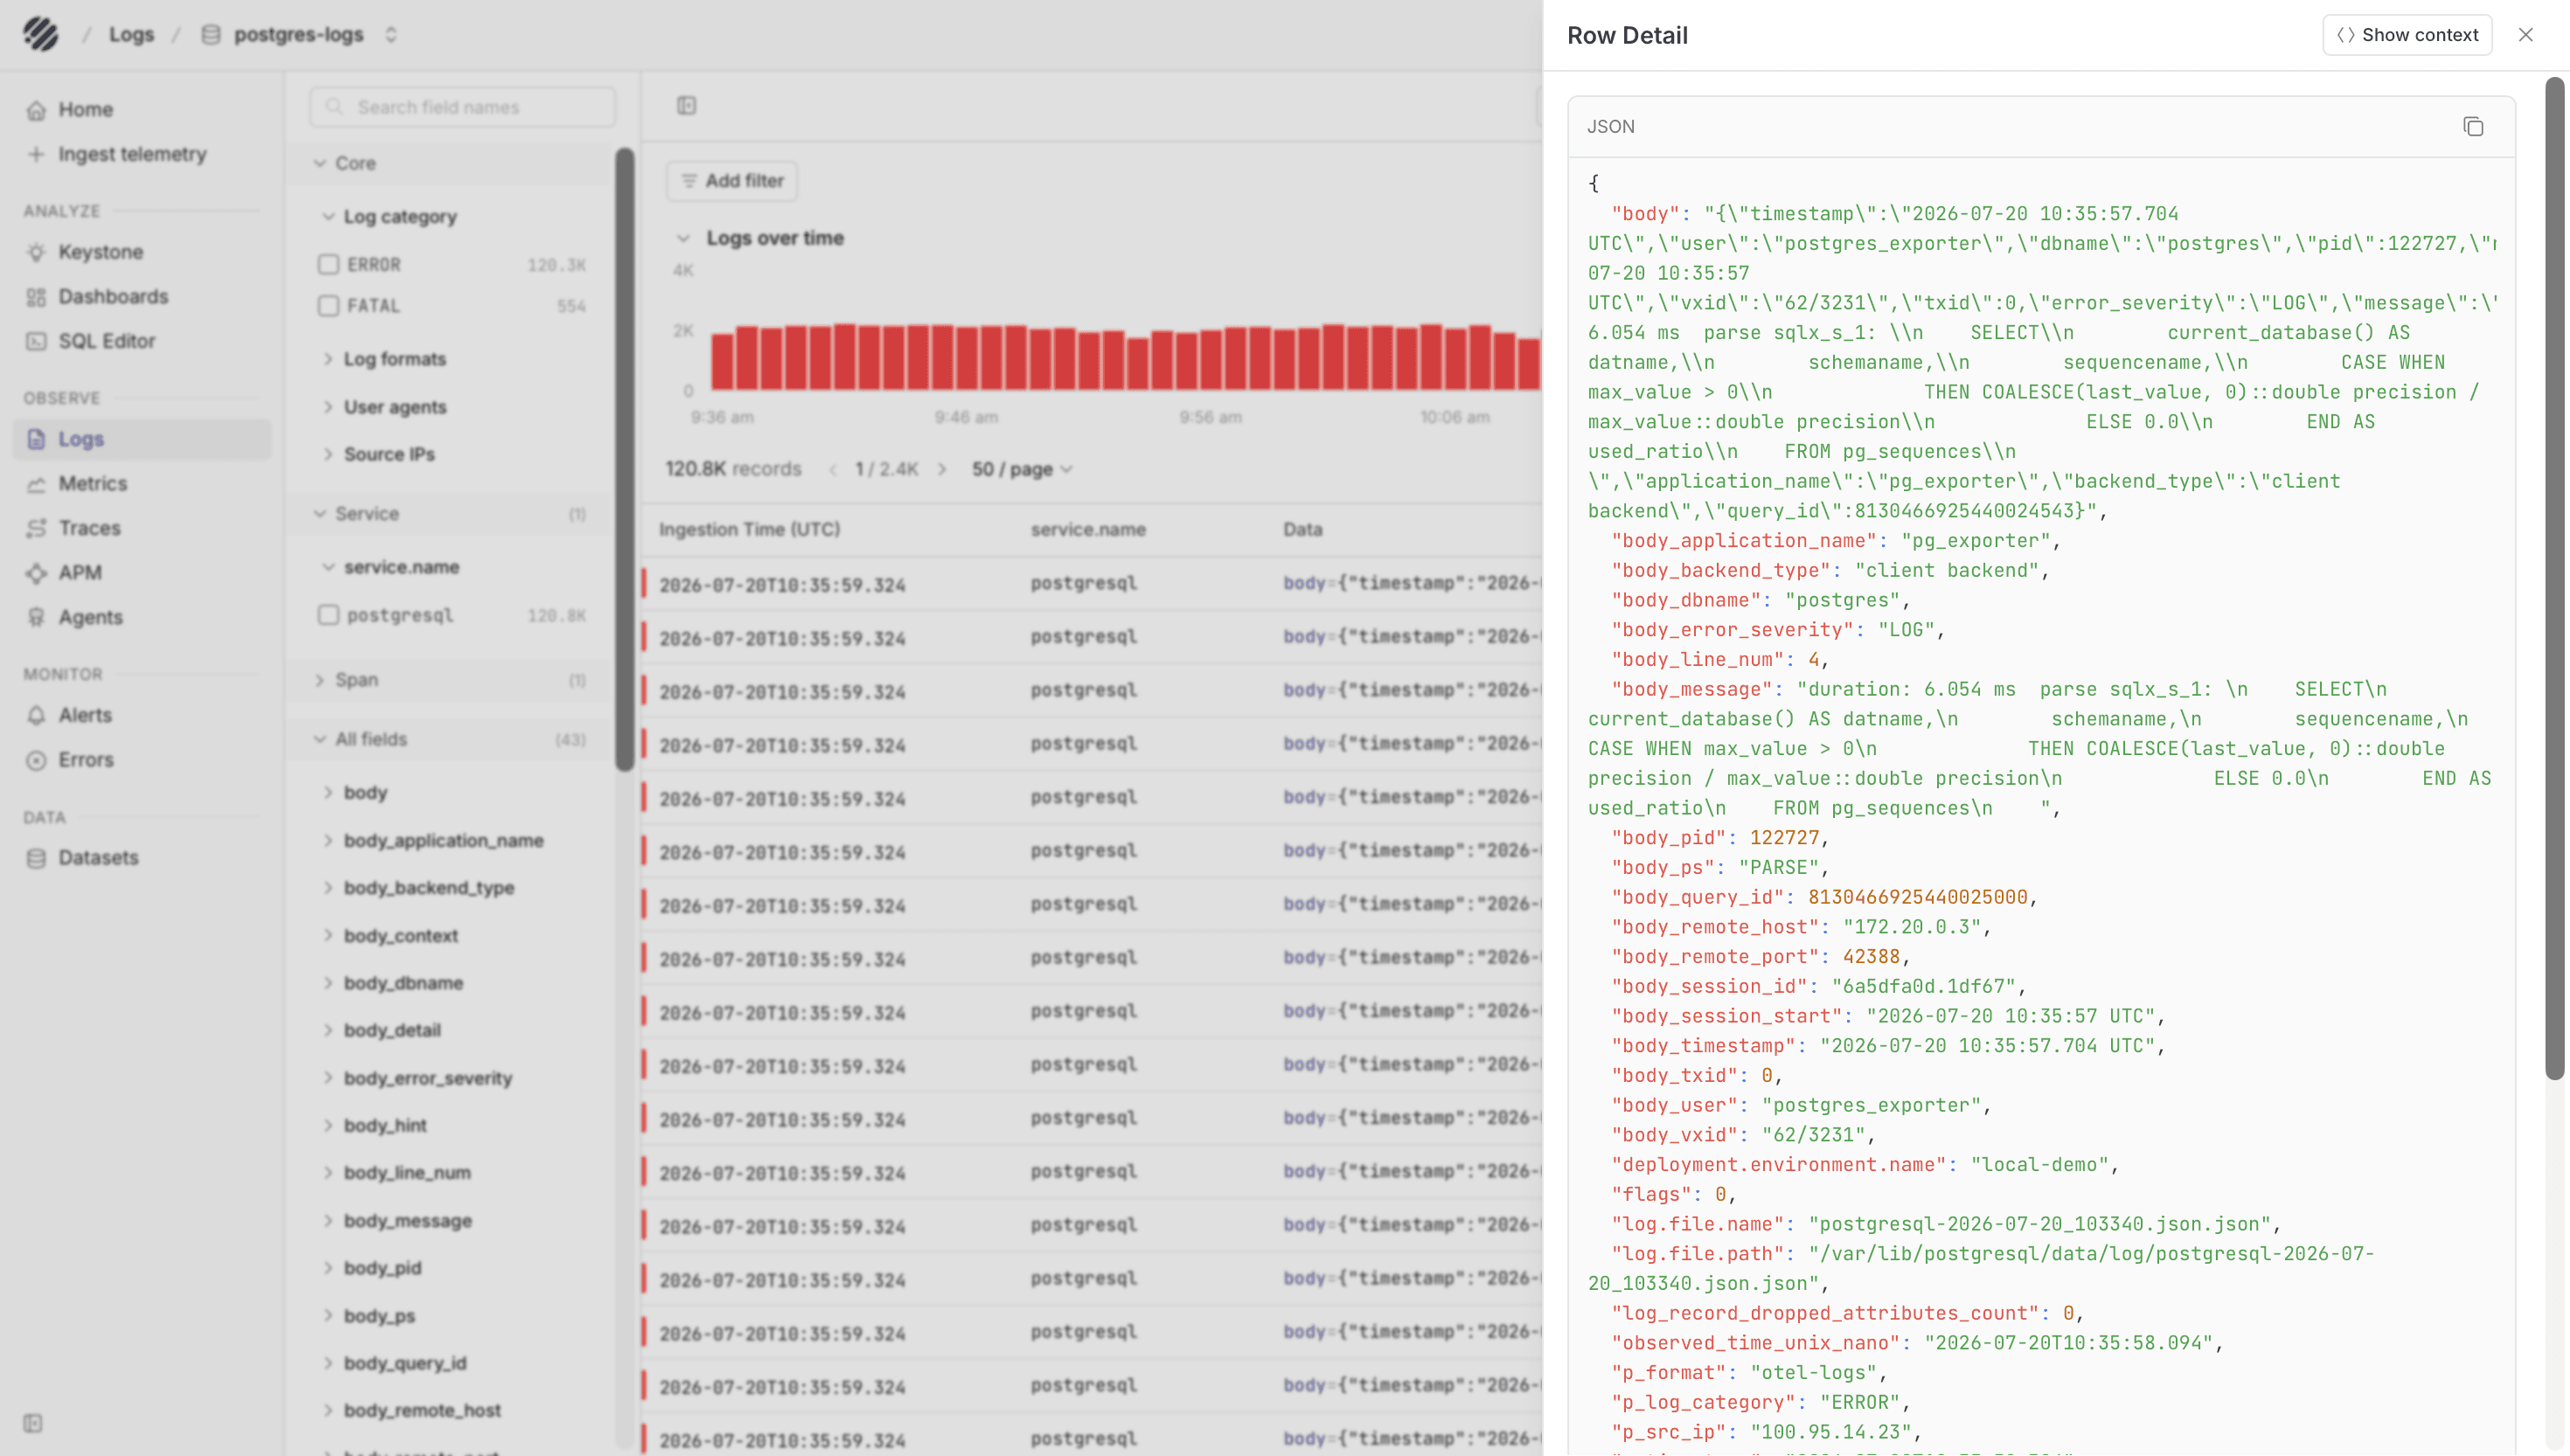
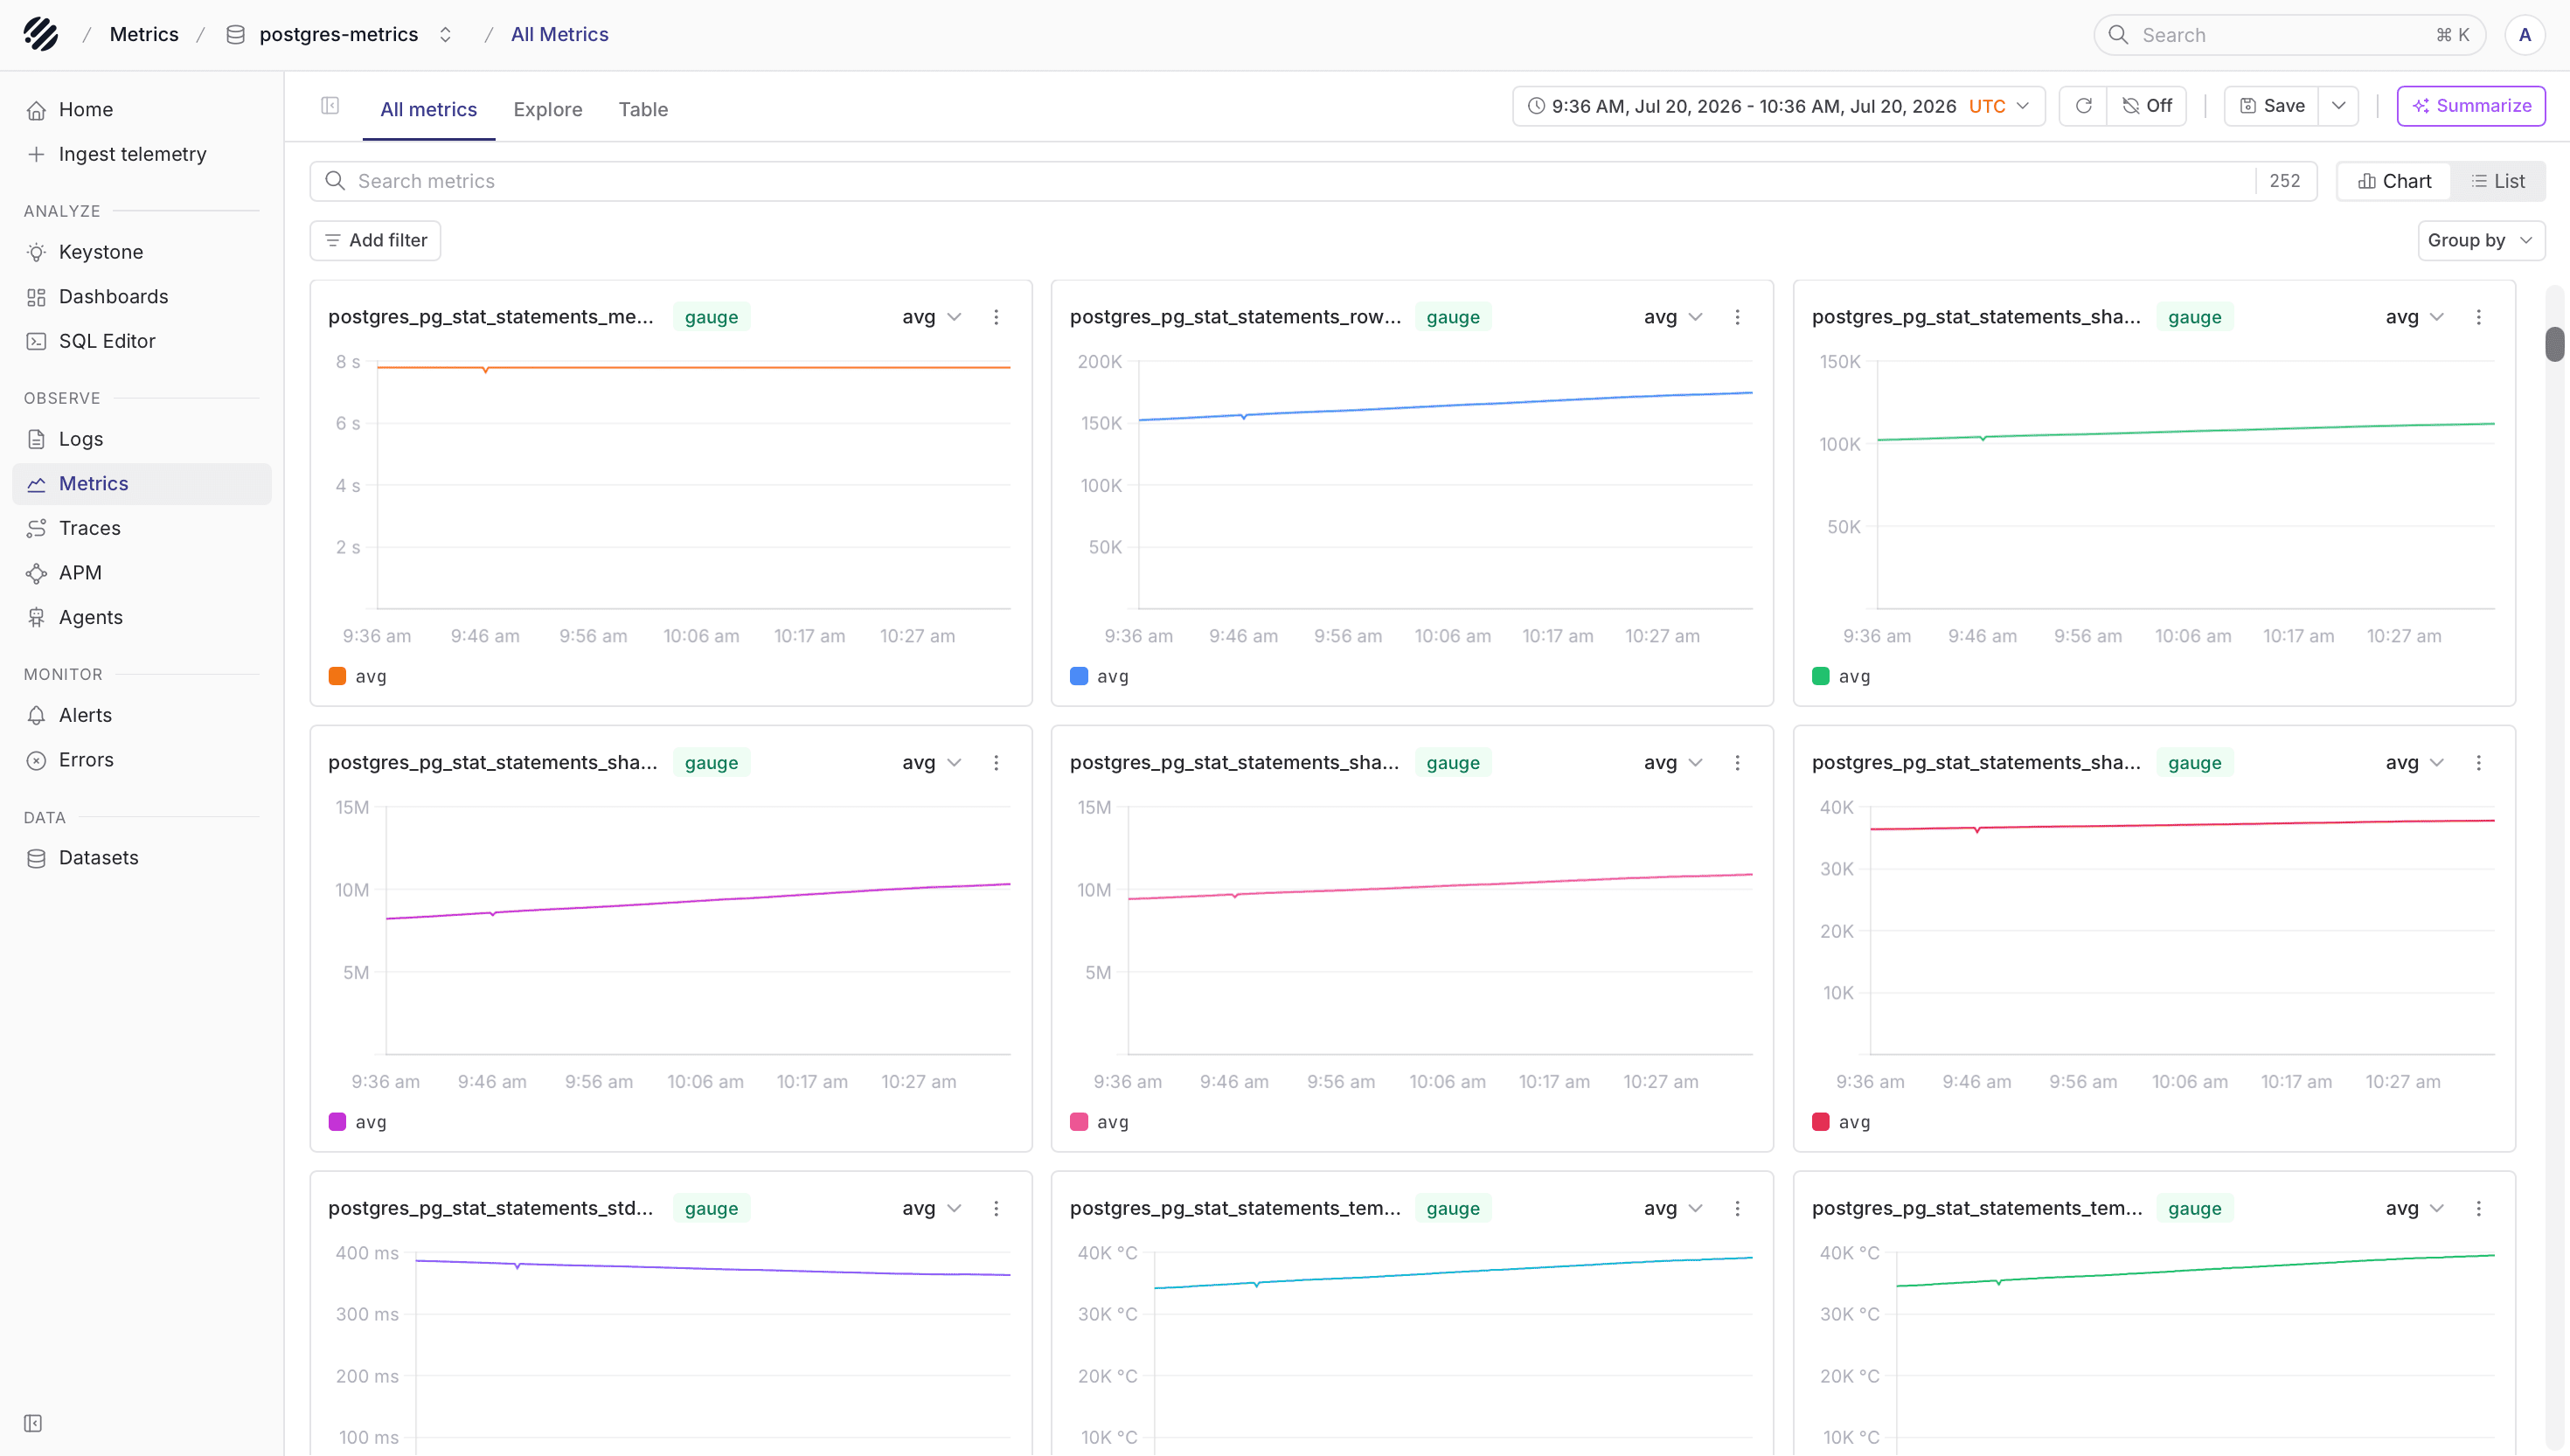
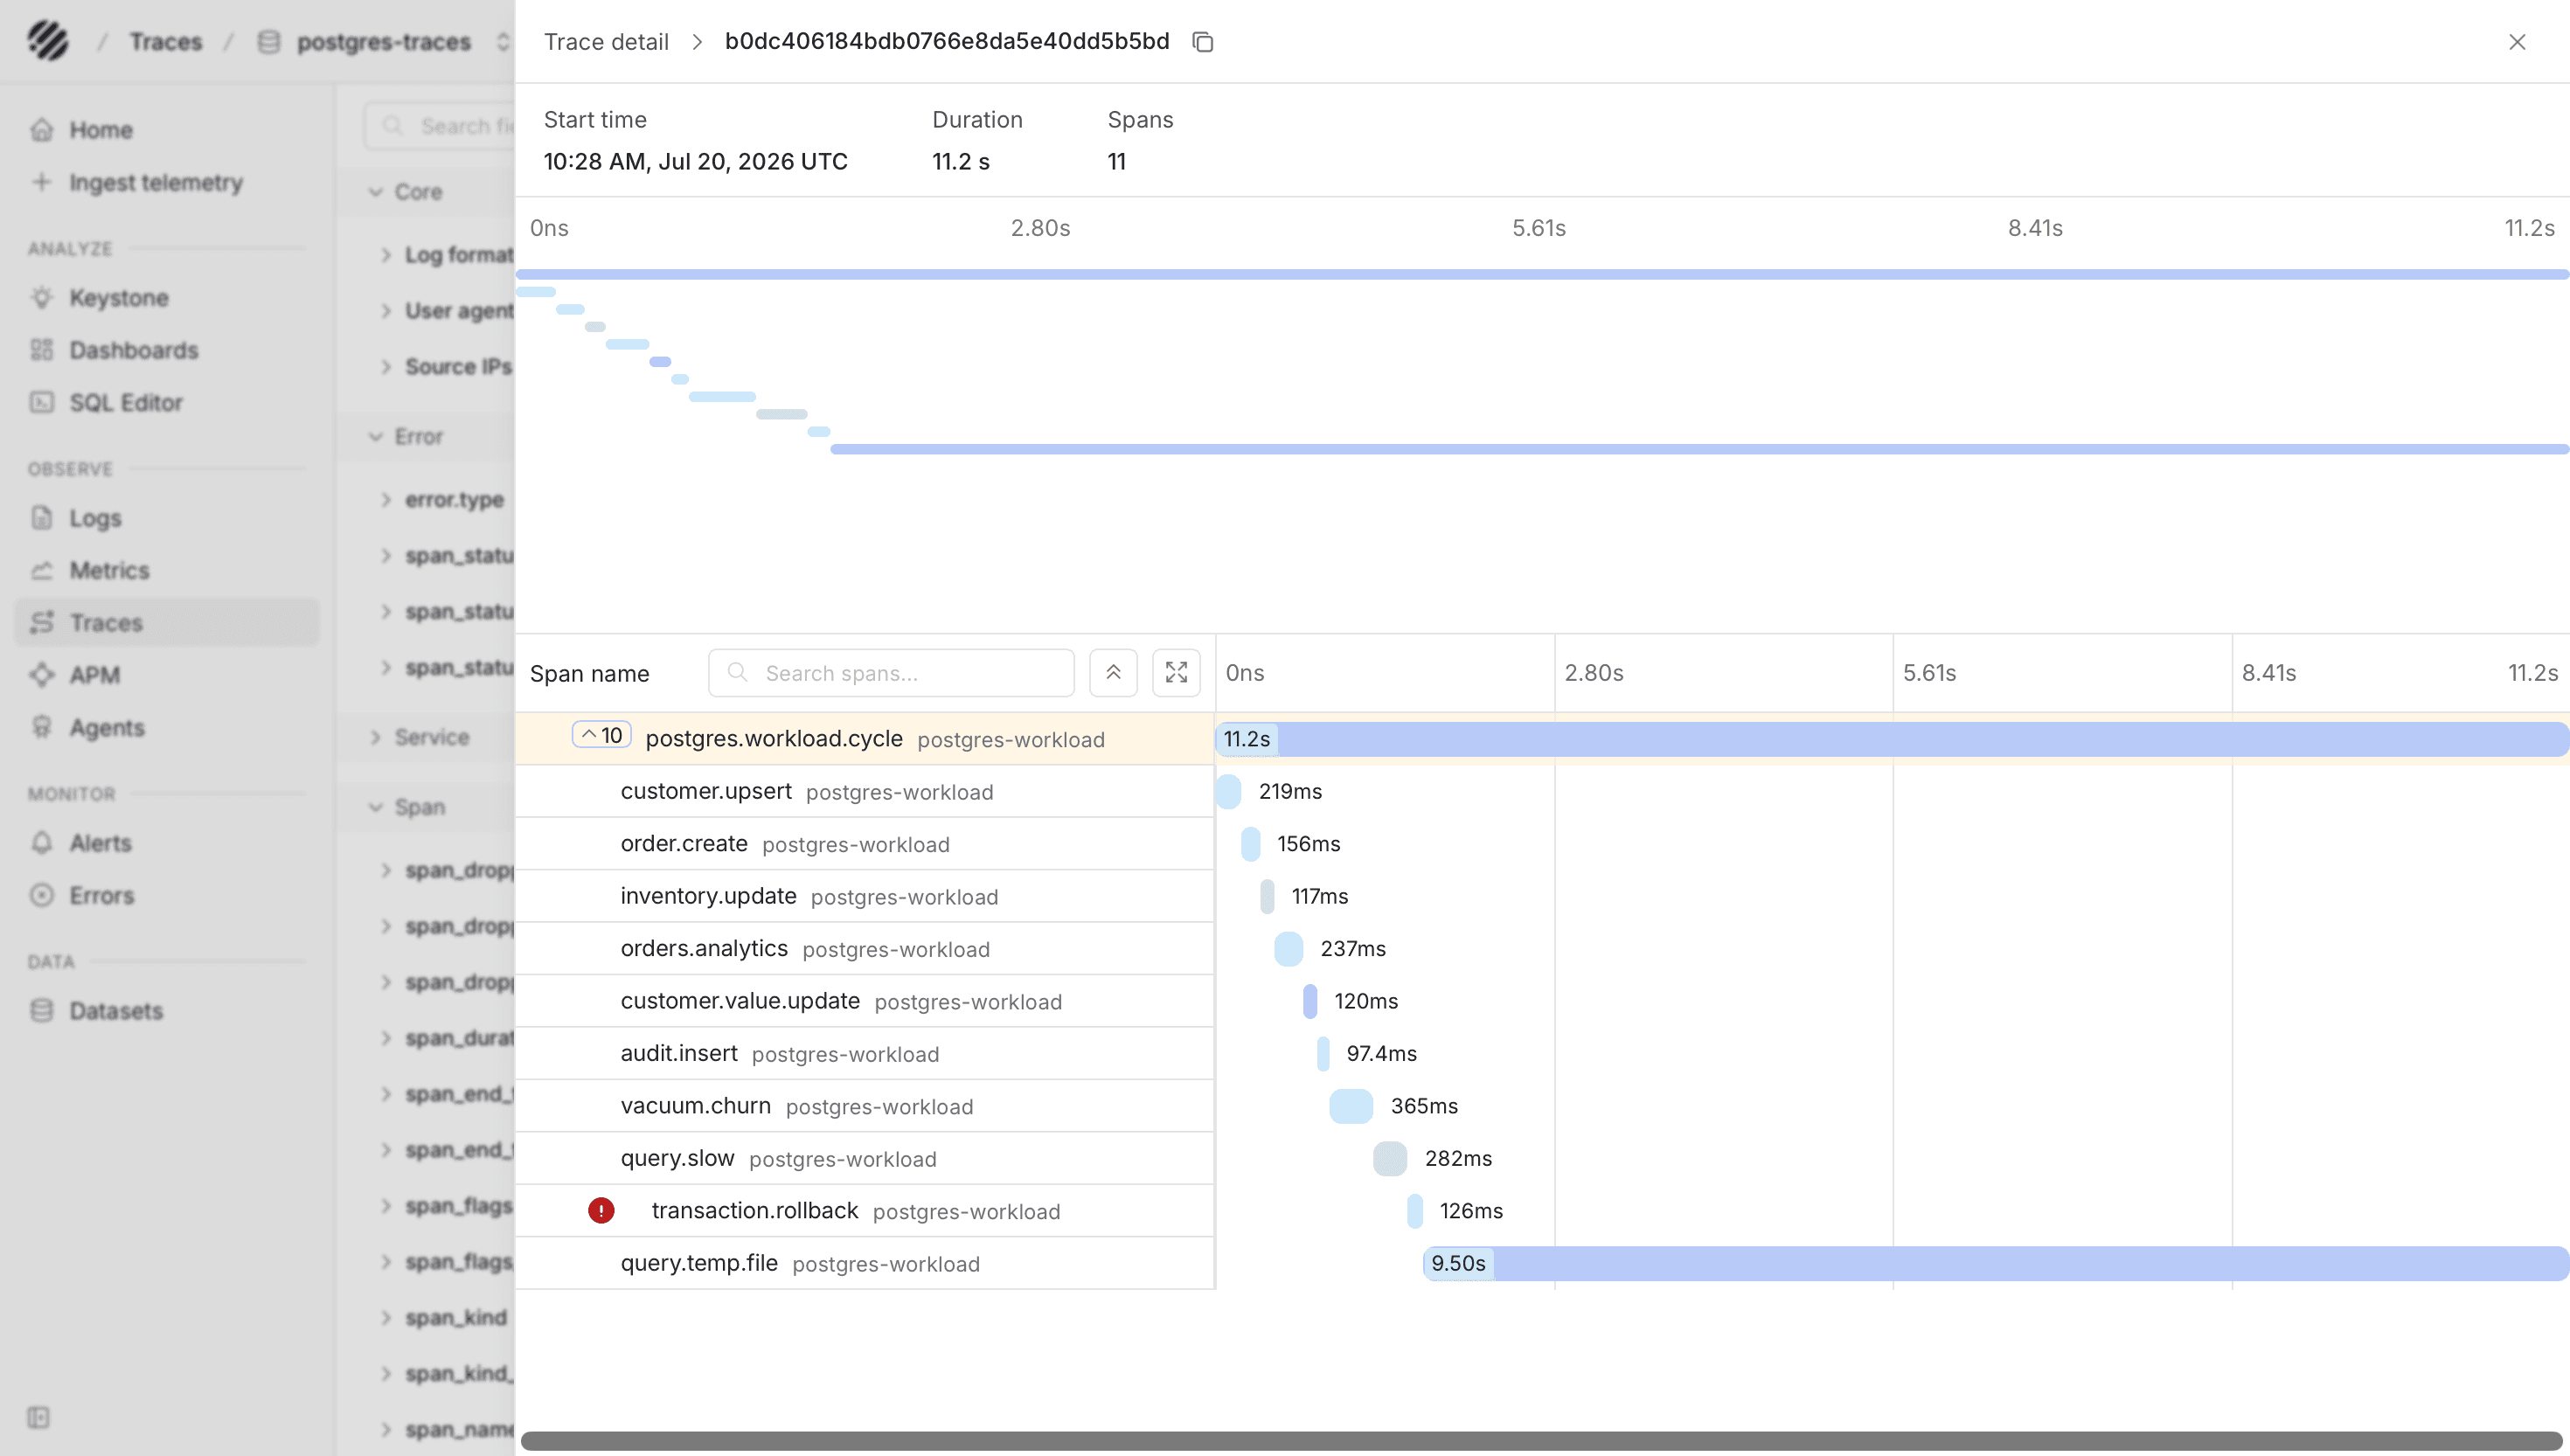
After the Collector exports data, Parseable keeps PostgreSQL logs, metrics, and traces in separate datasets. This makes it easier to move from a database log line to the related health metrics or client spans without mixing the signal types.
Dashboards
Public Parseable dashboard templates are available in parseablehq/dashboards. Choose a PostgreSQL template and update its dataset variables if you use different names.
Dashboards written for another PostgreSQL exporter may require metric-name changes. Confirm the expected names against the metric_name field in postgres-metrics.
Troubleshooting
- Confirm the database account has
pg_monitorand can connect to every configured database. - Confirm
shared_preload_librariescontainspg_stat_statementsand PostgreSQL was restarted after changing it. - Confirm
pg_exporterexposes/metricsand the Collector can scrape port9432. - Confirm the Collector can read the PostgreSQL log volume.
- An HTTP
405from Parseable normally indicates that the exporter is using the query/UI endpoint instead of the ingestor.
Was this page helpful?