
Redis
Send Redis logs, metrics, and traces to Parseable with OpenTelemetry
Redis often sits on the fast path for application traffic, so small changes in latency, memory, or command behavior can matter quickly. This guide shows how to send Redis logs, metrics, and traces to Parseable using a Redis primary with two replicas, one redis_exporter per node, an OpenTelemetry Collector, and a continuously running client workload.
What the integration collects
| Signal | Source | Parseable dataset |
|---|---|---|
| Logs | Redis server logs and optional MONITOR command audit output | redis-logs |
| Metrics | OpenTelemetry Redis receiver and Prometheus redis_exporter metrics | redis-metrics |
| Traces | Instrumented Redis client or workload spans | redis-traces |
Redis does not emit distributed traces by itself. Trace the application or workload that sends Redis commands and export those spans through OTLP.
Prerequisites
- Redis 6.0 or later
- OpenTelemetry Collector Contrib
- A Parseable ingestor endpoint and API key
redis_exporterwhen you need Prometheus-compatible dashboard metrics
The Collector must be able to reach Redis, the exporter, the Redis log files, and the Parseable ingestor. Do not point the OTLP exporter at a query-only endpoint.
Configure Redis
The following options enable persistence, latency data, slow-command history, and a file that the Collector can tail:
appendonly yes
appendfsync everysec
slowlog-log-slower-than 1000
slowlog-max-len 2048
latency-monitor-threshold 10
loglevel verbose
logfile /data/redis-server.log
requirepass ${REDIS_PASSWORD}
For a replica, add:
replicaof redis-primary 6379
masterauth ${REDIS_PASSWORD}
Run one exporter for each Redis node so role and replication metrics retain their node identity:
redis-exporter-primary:
  image: oliver006/redis_exporter:v1.84.0
  environment:
    REDIS_ADDR: redis://redis-primary:6379
    REDIS_PASSWORD: ${REDIS_PASSWORD}
Collector configuration
Create otel-collector.yaml. The exporter examples expect PARSEABLE_ENDPOINT and PARSEABLE_API_KEY to be set in the Collector environment:
receivers:
  otlp:
    protocols:
      grpc:
        endpoint: 0.0.0.0:4317
      http:
        endpoint: 0.0.0.0:4318

  filelog/redis:
    include:
      - /redis/primary/redis-server.log
      - /redis/replica1/redis-server.log
      - /redis/replica2/redis-server.log
    start_at: end
    include_file_name: true
    include_file_path: true

  redis:
    endpoint: redis-primary:6379
    password: ${env:REDIS_PASSWORD}
    collection_interval: 10s

  prometheus/redis_exporter:
    config:
      scrape_configs:
        - job_name: redis
          scrape_interval: 15s
          static_configs:
            - targets:
                - redis-exporter-primary:9121
                - redis-exporter-replica1:9121
                - redis-exporter-replica2:9121

processors:
  memory_limiter:
    check_interval: 1s
    limit_mib: 512
    spike_limit_mib: 128
  resource/redis:
    attributes:
      - key: service.name
        value: redis
        action: upsert
      - key: deployment.environment.name
        value: production
        action: upsert
  batch:
    timeout: 1s

exporters:
  otlphttp/parseable_logs:
    endpoint: ${env:PARSEABLE_ENDPOINT}
    encoding: json
    headers:
      X-API-Key: "${env:PARSEABLE_API_KEY}"
      X-P-Stream: redis-logs
      X-P-Log-Source: otel-logs
      Content-Type: application/json
    retry_on_failure:
      enabled: true
      max_elapsed_time: 0s

  otlphttp/parseable_metrics:
    endpoint: ${env:PARSEABLE_ENDPOINT}
    encoding: json
    headers:
      X-API-Key: "${env:PARSEABLE_API_KEY}"
      X-P-Stream: redis-metrics
      X-P-Log-Source: otel-metrics
      Content-Type: application/json
    retry_on_failure:
      enabled: true
      max_elapsed_time: 0s

  otlphttp/parseable_traces:
    endpoint: ${env:PARSEABLE_ENDPOINT}
    encoding: json
    headers:
      X-API-Key: "${env:PARSEABLE_API_KEY}"
      X-P-Stream: redis-traces
      X-P-Log-Source: otel-traces
      Content-Type: application/json
    retry_on_failure:
      enabled: true
      max_elapsed_time: 0s

service:
  pipelines:
    logs:
      receivers: [filelog/redis]
      processors: [memory_limiter, resource/redis, batch]
      exporters: [otlphttp/parseable_logs]
    metrics:
      receivers: [redis, prometheus/redis_exporter]
      processors: [memory_limiter, resource/redis, batch]
      exporters: [otlphttp/parseable_metrics]
    traces:
      receivers: [otlp]
      processors: [memory_limiter, batch]
      exporters: [otlphttp/parseable_traces]
Set the environment variables before starting the Collector:
export REDIS_PASSWORD='replace-me'
export PARSEABLE_ENDPOINT='https://ingestor.example.com'
export PARSEABLE_API_KEY='<your-api-key>'
Mount each Redis data volume read-only at the paths referenced by filelog/redis.
Generate representative activity
The workload used to validate this integration continuously exercises strings, hashes, lists, sets, sorted sets, HyperLogLog, bitmaps, pub/sub, TTL churn, Lua scripts, cache hits and misses, and Redis Streams consumer groups.
redis-cli -h redis-primary -a "$REDIS_PASSWORD" XGROUP \
  CREATE orders:stream processors 0 MKSTREAM

while true; do
  redis-cli -h redis-primary -a "$REDIS_PASSWORD" \
    XADD orders:stream MAXLEN '~' 10000 '*' status created
  redis-cli -h redis-primary -a "$REDIS_PASSWORD" INCR workload:cycles
  redis-cli -h redis-primary -a "$REDIS_PASSWORD" GET missing:key
  sleep 2
done
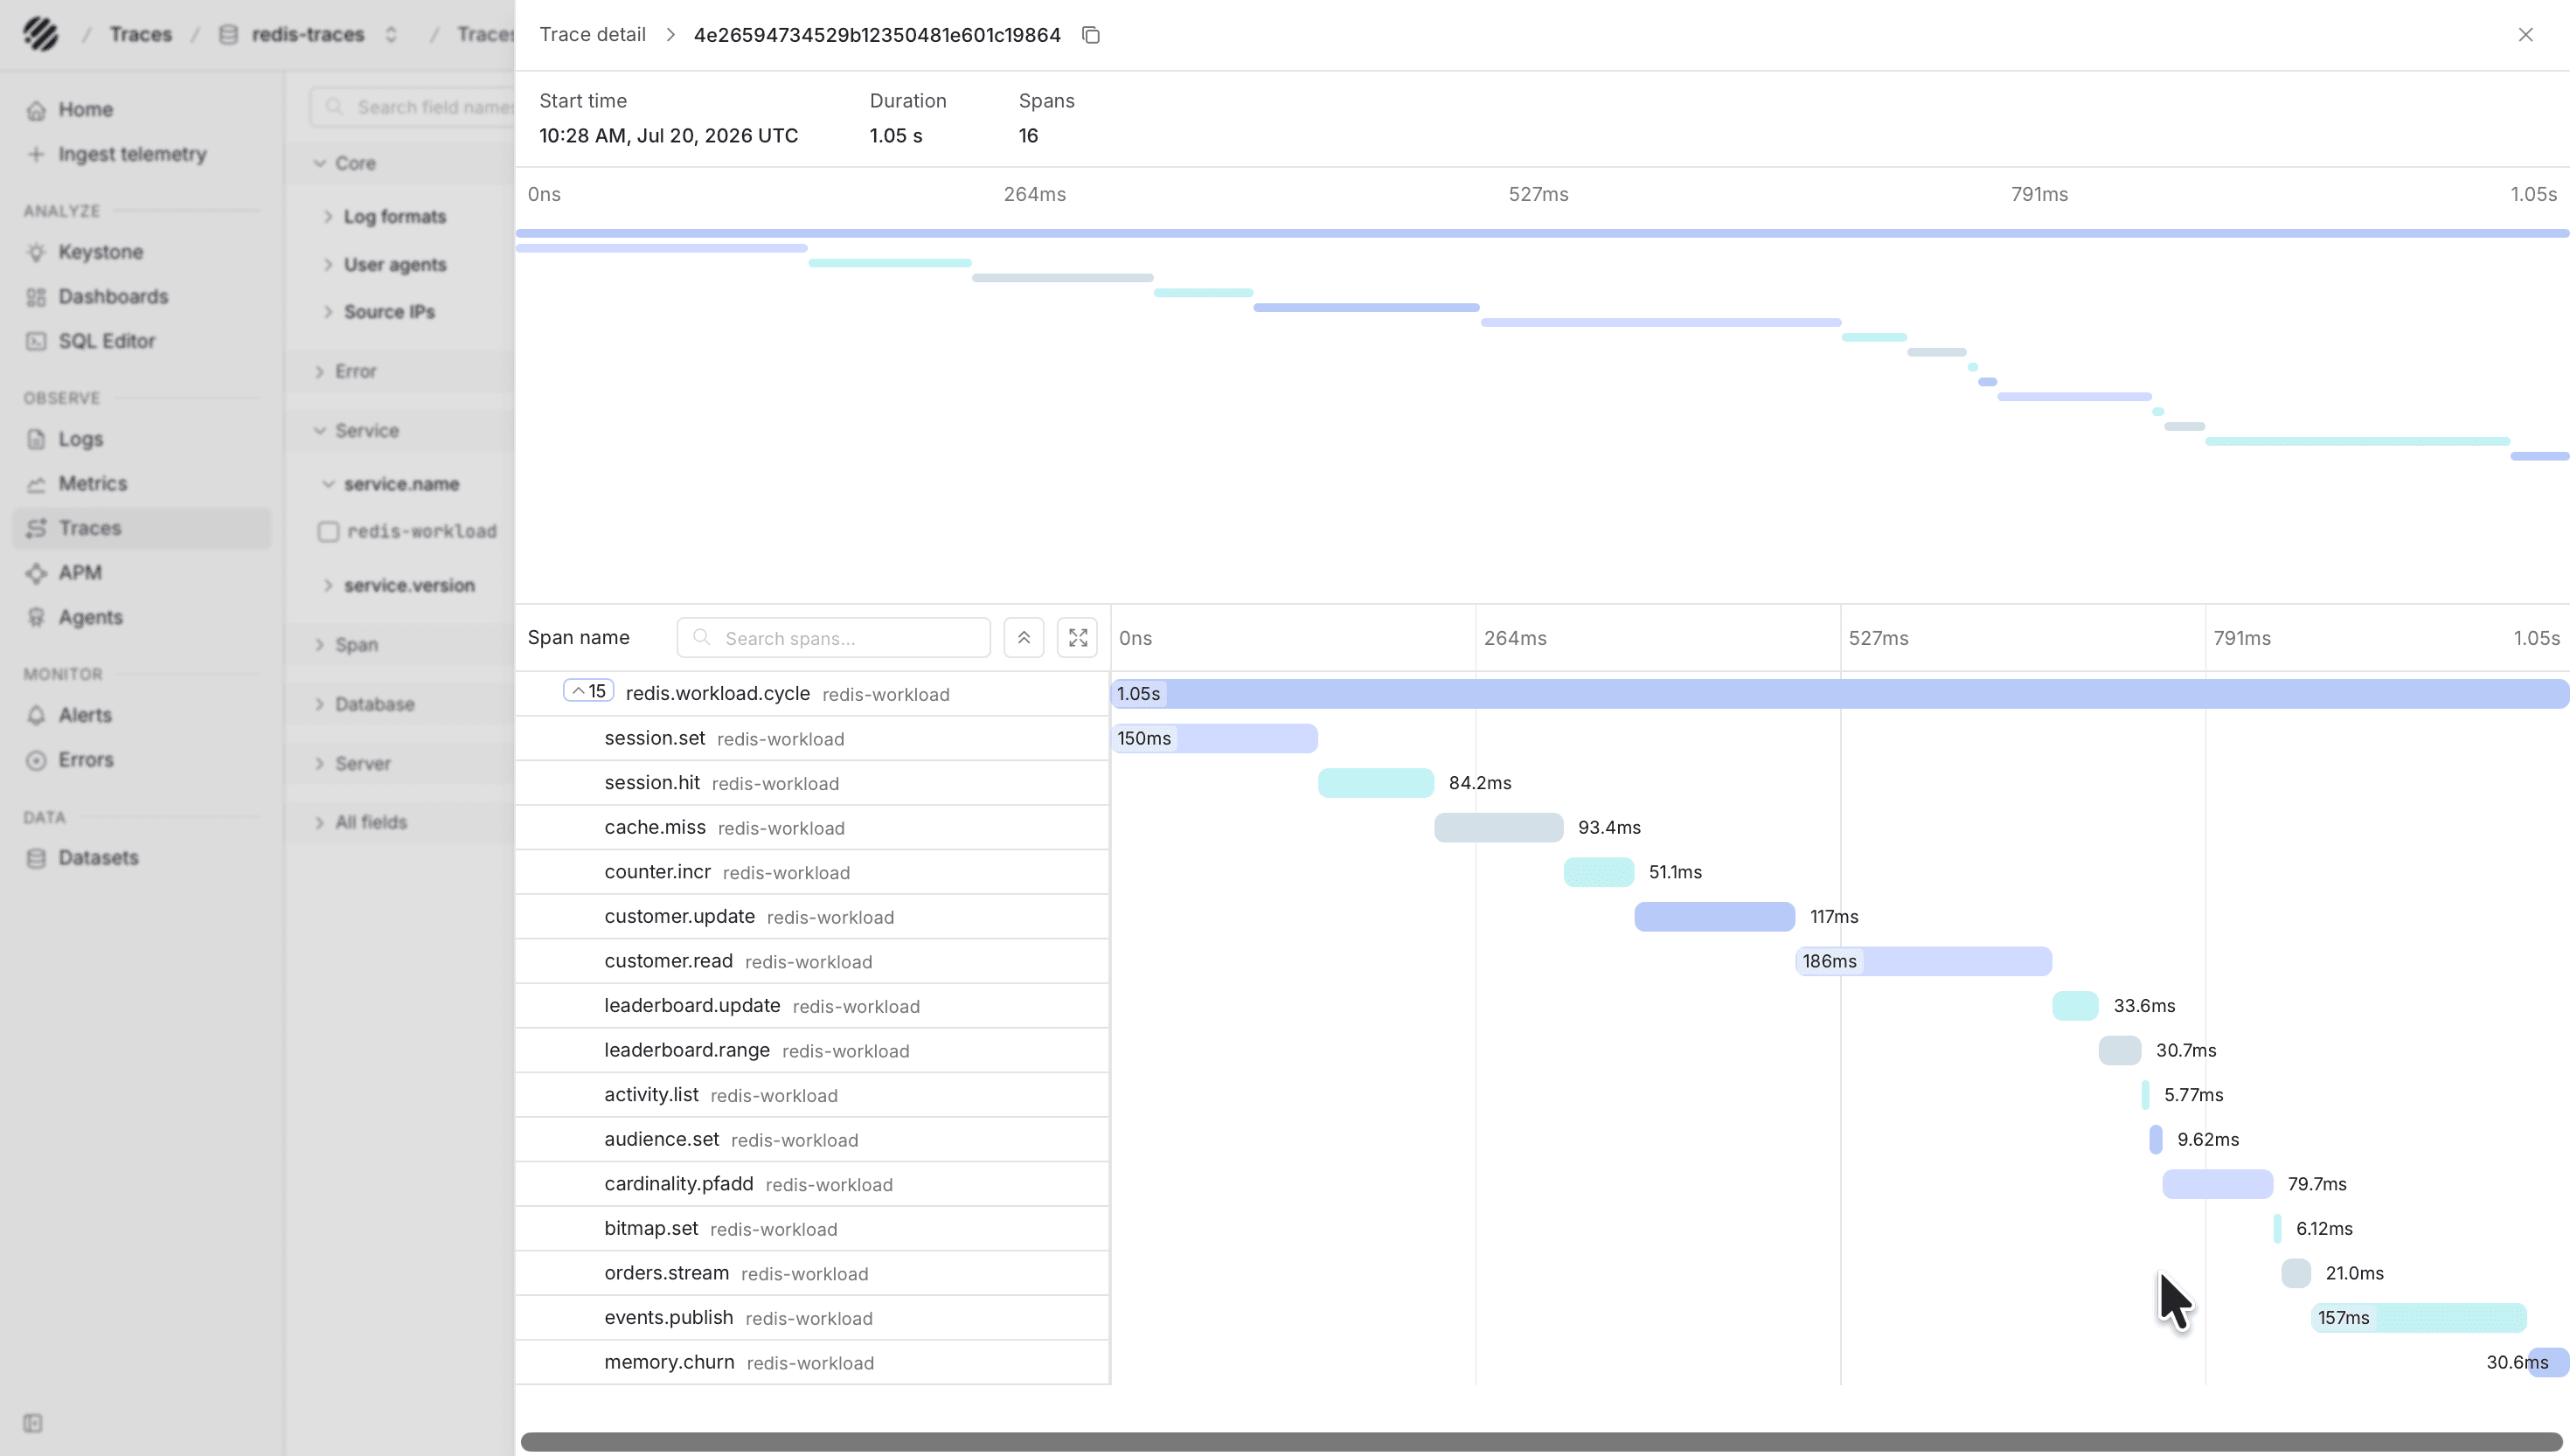
Instrument these client operations with an OpenTelemetry SDK and send spans to http://otel-collector:4318/v1/traces. Recommended span attributes include db.system.name=redis, db.namespace, db.operation.name, server.address, and server.port.
Optional command audit logs
MONITOR produces a live stream of every command and can be redirected to a file consumed by filelog/redis:
redis-cli -h redis-primary -a "$REDIS_PASSWORD" MONITOR \
  >> /logs/redis-monitor.log
MONITOR can expose command arguments and adds overhead. Use it only for controlled demonstrations or short diagnostic windows. Do not use it as a default production audit mechanism.
Verify ingestion
SELECT count(*) FROM "redis-logs"
WHERE p_timestamp > NOW() - INTERVAL '10 minutes';
SELECT metric_name, count(*)
FROM "redis-metrics"
WHERE p_timestamp > NOW() - INTERVAL '10 minutes'
GROUP BY metric_name
ORDER BY metric_name;SELECT span_name, count(*)
FROM "redis-traces"
WHERE p_timestamp > NOW() - INTERVAL '10 minutes'
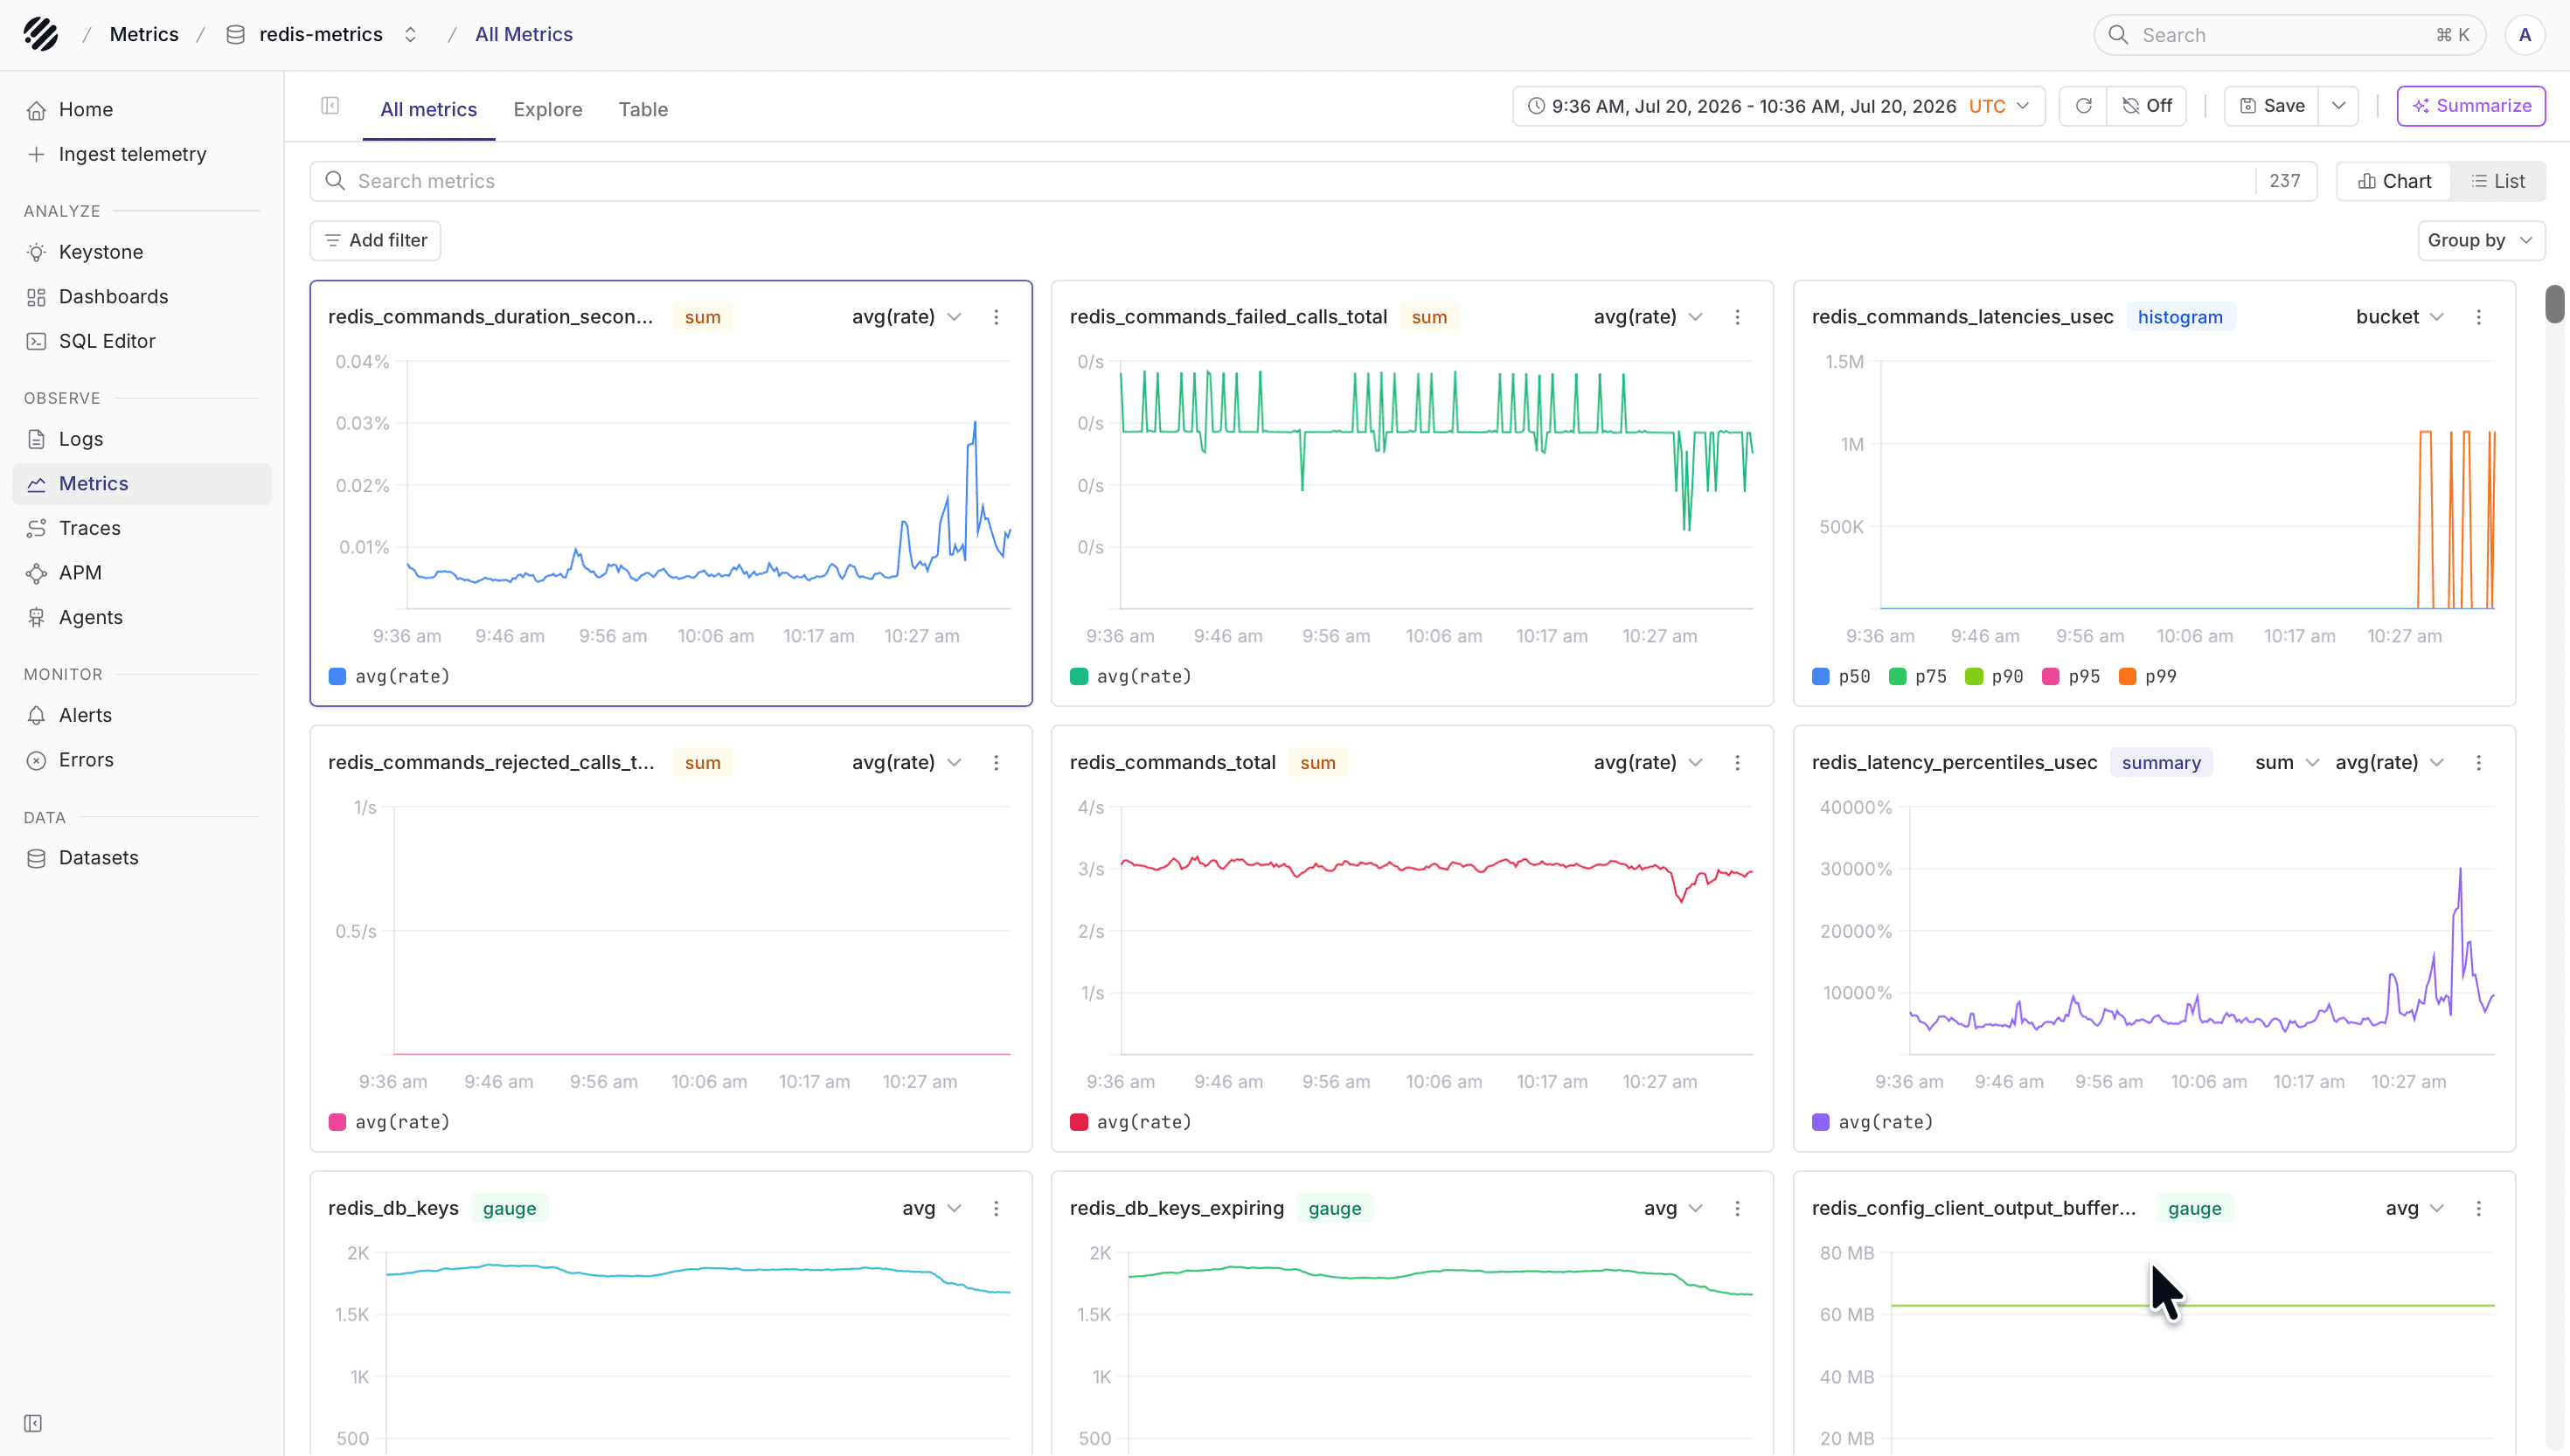
GROUP BY span_name;Expected metric families include native names such as redis.clients.connected and exporter names such as redis_commands_total, redis_memory_used_bytes, and redis_db_keys.
View in Parseable
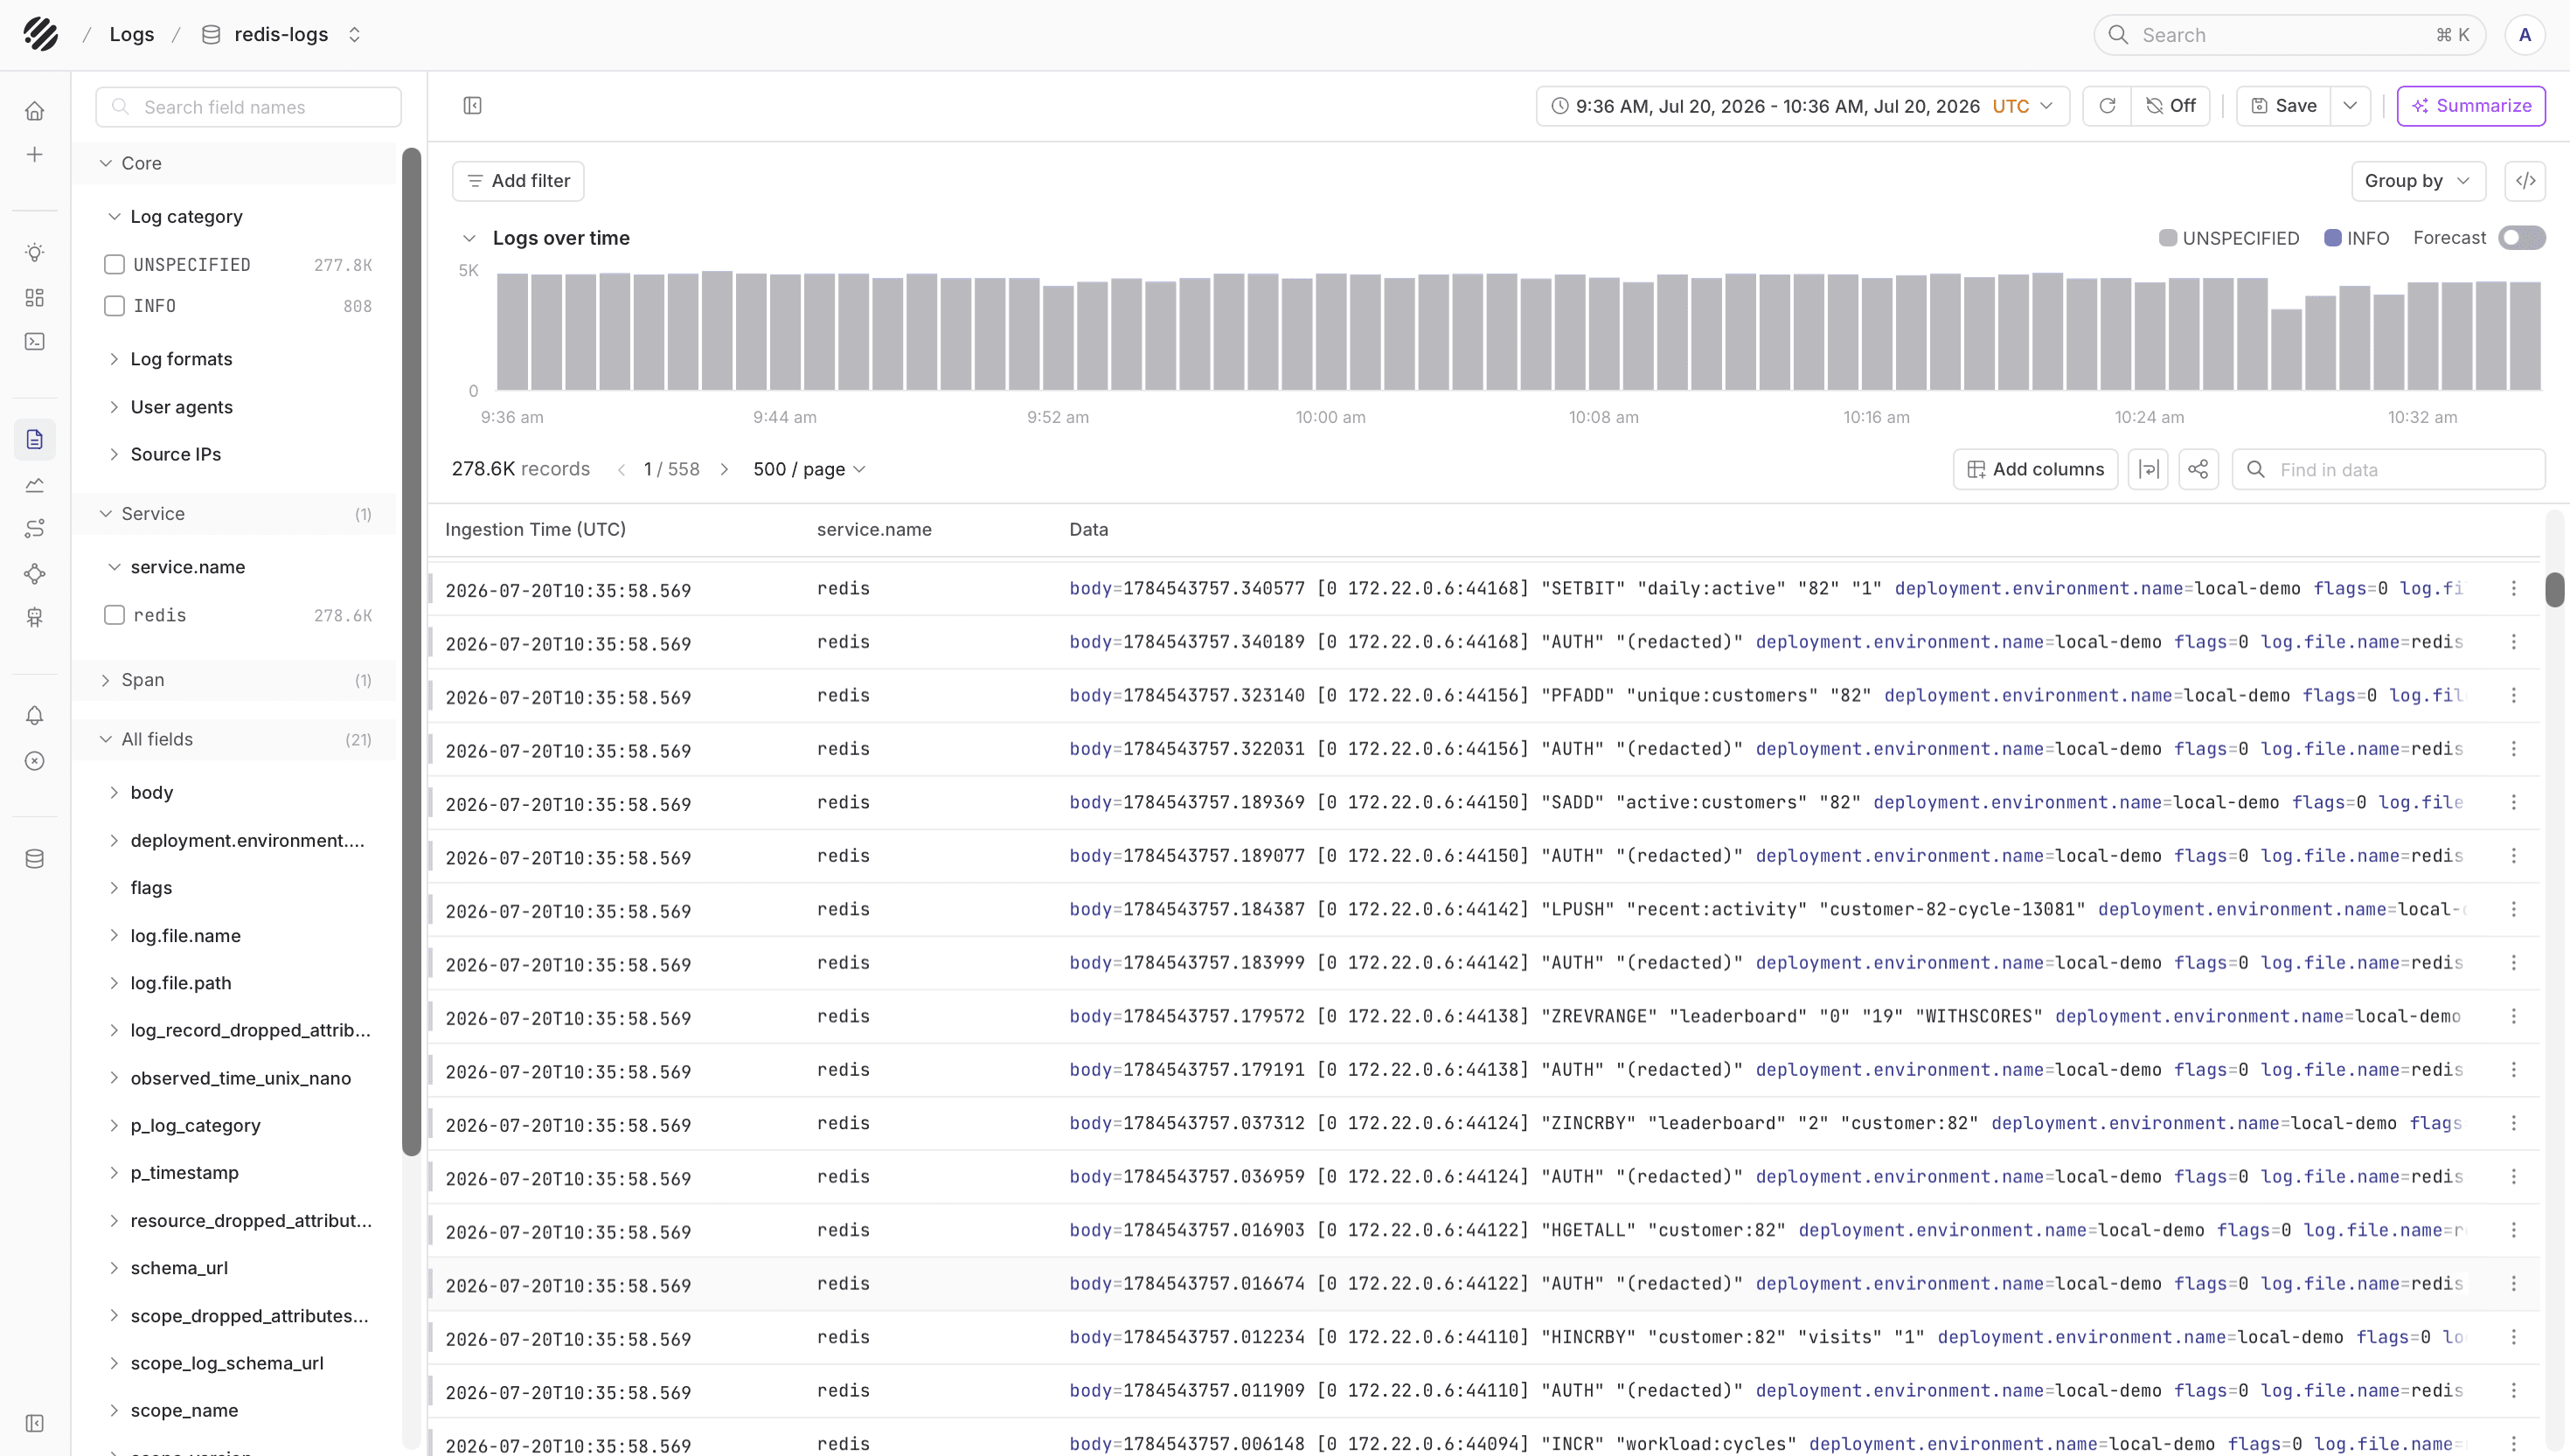
With the Redis datasets in place, you can inspect server logs, watch Redis and exporter metrics, and open traces from the client workload that is issuing Redis commands. This gives you enough context to see whether an application slowdown is coming from Redis itself or from the code path around it.
Dashboards
Parseable maintains reusable public dashboard templates in the parseablehq/dashboards repository. Start with a Redis template and adjust dataset names if you changed the defaults in this guide.
Grafana dashboards built for redis_exporter are useful references. Dashboards built for the direct Redis datasource or Telegraf require metric-name translation.
Troubleshooting
- Check the Collector log for Redis authentication, scrape, and OTLP export errors.
- Verify
redis-cli INFOworks with the monitoring credentials. - Verify every exporter returns metrics from
/metrics. - An HTTP
405from Parseable usually means the Collector is pointed at the query/UI endpoint instead of the ingestor. - Keep Redis, exporter, and OTLP receiver ports private; only the Collector needs outbound access to Parseable.
Was this page helpful?